DOI:
10.1039/C6RA23477A
(Paper)
RSC Adv., 2016,
6, 109718-109725
Synthesis and biological evaluation of heterocyclic hydrazone transition metal complexes as potential anticancer agents†
Received
21st September 2016
, Accepted 11th November 2016
First published on 11th November 2016
Abstract
In an effort to better understand the anticancer activity of the tridentate heterocyclic hydrazone metal complexes, three new transition metal complexes with (E)-4-hydroxy-N′-(quinolin-2-ylmethylene)benzohydrazide (HL), [Co(L)2] (C1), [Ni(L)2] (C2) and [Cu(L)2] (C3) were synthesized and characterized. The Cu(II) complex C3 had significantly higher intracellular reactive oxygen species (ROS) level and antitumor efficacy than C1 and C2. Further apoptosis, mitochondrial membrane potential and western blot studies showed that C3 can effectively induce caspase-mediated apoptosis in A549 cells through the activation of the mitochondrial signaling pathway. Moreover, the affinity of C3 towards human serum albumin (HSA) was investigated by fluorescence spectroscopy and molecular docking, which revealed hydrophobic interaction and hydrogen bonds in the subdomain IIA of HSA.
Introduction
Cancer remains one of the leading causes of morbidity and mortality around the world and one in eight deaths in the world is due to cancer.1 Cisplatin, a chemotherapeutic agent, is still one of the world's best-selling anticancer drugs and is primarily used in the treatment of bladder, ovarian, head and neck and cervical cancers.2–4 Regardless of the great achievements of cisplatin, its clinical use is still limited by some major draw-backs such as inherited or acquired resistance phenomena and severe toxic side effects.5,6 These disadvantages have motivated chemists to develop novel metal compounds with improved pharmacological properties based on different metals and ligands.7
The heterocyclic hydrazones are an important class of Schiff base ligands, that have attracted attention of medicinal chemists due to their wide ranging biological and pharmaceutical properties such as anticancer, antimicrobial and antituberculostatic activities.8–11 Heterocyclic hydrazones act as potentially tridentate chelating agents that can react with a large variety of transition metal cations via the imine–N, the pyridine–N and the carbonyl–O centers and can otherwise act as tridentate anionic ligands via enol–keto tautomerization.12–14 Metal complexes with these ligands can have a wide range of structures, with variations in the coordination numbers and geometries, accessible redox states and ‘tune-ability’ of the thermodynamics, which have a direct influence on the biological activity.15 Interestingly, several studies have shown that metals-bound ligands show better potential biological activity than free ligands.16–18 Therefore, development of heterocyclic hydrazones metal complexes may provide a broader spectrum of antitumor activity.
Based on this background, in the present study, a new heterocyclic hydrazone ligand (E)-4-hydroxy-N′-(quinolin-2-ylmethylene)benzohydrazide (HL) and complexes [Co(L)2] (C1), [Ni(L)2] (C2) and [Cu(L)2] (C3) its three essential metal elements for man (Co, Ni and Cu) were designed and synthesized (Scheme 1). The anticancer activity of the complexes against HeLa, A549 and cisplatin-resistant A549 cell lines was studied and the effects of the divalent metal centers on cytotoxicity were investigated. In particular, the apoptotic pathway of the most active complex (C3) was also investigated in detail by flow cytometry and western blot analysis. Furthermore, human serum albumin (HSA) is the single most abundant soluble protein in human blood and has several physiological functions.19–21 HSA binding with drugs has long been considered as one of the most important biochemical characteristics of drugs that can alter their transport, distribution, metabolism, and pharmacodynamics. Therefore, the interaction of HSA with metal complex C3 was also investigated in the present study.
 |
| Scheme 1 Synthesis of complexes C1–C3. | |
Materials and methods
Human serum albumin (HSA) was purchased from Sigma (Sigma-Aldrich, USA). All other chemicals and solvents used were of analytical reagent grade and available from commercial sources. Elemental analyses for C, N, and H were carried out on a Carlo Erba 1106 elemental analyzer. Infrared (IR) spectra were recorded using KBr pellets (4000–400 cm−1) on a Bruker Vector 22 FT-IR spectrophotometer. Electrospray ionization-mass spectroscopy (ESI-MS) spectra were recorded on a Thermo-Finnigan LCQ/AD Quadrupole Ion Trap ES-MS.
Synthesis of Schiff base ligand HL
2-Quinolinecarboxaldehyde (0.32 g, 2 mmol) and 4-hydroxybenzhydrazide (0.30 g, 2 mmol) were mixed in methanol (20 mL) in the presence of one drop of concentrated hydrochloric acid. Then, the reaction mixture was refluxed for 4 h (70 °C) and subsequently cooled to room temperature for slow evaporation. The yellow crystals of HL suitable for X-ray analysis were collected after 7 days. Yield: 525 mg (76%). Anal. calcd for C17H16ClN3O3 (345.78): C, 59.05; H, 4.66 and N, 12.15. Found: C, 59.23; H, 4.31 and N, 12.37. ESI-MS: calcd for C17H14N3O2 [M − Cl − H2O]+ 292.11, found 292.11. IR (KBr, cm−1): ν(O–H) 3438; ν(C
N) 1602–1578; ν(C
O) 1645.
Synthesis of [Co(L)2] (C1)
HL ligand (0.32 g, 2 mmol) was dissolved in 20 mL of methanol. NiCl2·6H2O (0.23 g, 1 mmol) was added to the solution and the mixture was gently refluxed for 24 h. A red precipitate of the product formed on cooling and it was washed with diethyl ether. Yield: 453 mg (71%). Anal. calcd for C34H24CoN6O4 (639.53): C, 63.88; H, 3.78 and N, 13.15. Found: C, 63.39; H, 3.93 and N, 13.07. ESI-MS: calcd for C34H25CoN6O4 [M + H]+ 640.13, found 640.13. IR (KBr, cm−1): ν(C
N–N
C–O−) 1602.
Synthesis of [Ni(L)2] (C2)
HL ligand (0.32 g, 2 mmol) was dissolved in 20 mL of methanol. CoCl2·6H2O (0.23 g, 1 mmol) was added to the solution and the mixture was gently refluxed for 24 h. A red precipitate of the product formed on cooling and it was washed with diethyl ether. Yield: 409 mg (64%). Anal. calcd for C34H24NiN6O4 (639.29): C, 63.85; H, 3.78 and N, 13.14. Found: C, 63.46; H, 3.97 and N, 12.87. ESI-MS: calcd for C34H25NiN6O4 [M + H]+ 639.13, found 639.13. IR (KBr, cm−1): ν(C
N–N
C–O−) 1607.
Synthesis of [Cu(L)2] (C3)
The methanol solution of CuCl2·2H2O (0.18 g, 1 mmol) was slowly added to the methanol solution of HL ligand (0.48 g, 2 mmol). The resulting dark green reaction mixture was stirred for 1 h and then filtrated. The obtained filtrate was left at room temperature for a week during which dark blue single crystals were obtained. Yield: 431 mg (67%). Anal. calcd for C34H24CuN6O4 (644.13): C, 62.40; H, 3.76 and N, 13.05. Found: C, 62.28; H, 3.95 and N, 13.30. ESI-MS: calcd for C34H25CuN6O4 [M + H]+ 644.12, found 644.12. IR (KBr, cm−1): ν(C
N–N
C–O−) 1604.
Crystal structure determinations
Diffraction intensities for the complexes were collected on a Bruker SMART Apex II CCD diffractometer using graphite-monochromated Mo-Kα radiation (λ = 0.71073 Å) at room temperature. The collected data were reduced using the SAINT program and empirical absorption corrections were performed for all data using the SADABS program.22 Two structures were solved by direct methods and refined using full-matrix least-squares methods on F2 with the SHELXTL (version 5.1).23 All non-hydrogen atoms were refined anisotropically and the H atoms were placed in geometrically ideal positions and constrained to ride on their parent atoms. Details of crystal data are summarized in Table 1. Selected angles and bond lengths are given in Table 2. Crystallographic data for the reported structural analyses have been deposited at the Cambridge Crystallographic Data Centre (deposition numbers 1500703 for HL and 1500979 for C3).
Table 1 Crystal data for complexes HL and C3
Complex |
HL |
C3 |
Empirical formula |
C17H16ClN3O3 |
C34H24CuN6O4 |
Molecular weight |
345.78 |
644.13 |
Crystal system |
Monoclinic |
Triclinic |
Space group |
P21/c |
P![[1 with combining macron]](https://www.rsc.org/images/entities/char_0031_0304.gif) |
a (Å) |
7.2591(3) |
11.839(3) |
b (Å) |
18.7570(10) |
12.193(4) |
c (Å) |
12.2090(5) |
13.482(4) |
α (°) |
90.00 |
70.196(5) |
β (°) |
103.578(4) |
80.076(5) |
γ (°) |
90.00 |
61.321(5) |
T (K) |
296.15 |
296.15 |
V (Å3) |
1615.90(13) |
1606.3(8) |
Z |
4 |
2 |
ρcalc. (g cm−3) |
1.421 |
1.332 |
F(000) |
720 |
662 |
μ(Mo-Kα) (mm−1) |
0.257 |
0.726 |
Data/restraint/parameters |
3289/0/221 |
6538/0/408 |
Goodness-of-fit on F2 |
1.026 |
0.970 |
Final R1, wR2 [I > 2σ(I)] |
0.0466, 0.0956 |
0.0723, 0.1505 |
Table 2 Selected bond lengths [Å] and angles [°] in complexes HL and C3
HL |
N2–N3 |
1.357(2) |
N3–N2–C7 |
117.42(19) |
N2–C7 |
1.373(3) |
C8–N3–N2 |
118.34(19) |
N3–C8 |
1.272(3) |
N3–C8–C9 |
118.2(2) |
O1–C7 |
1.226(3) |
N2–C7–C6 |
116.8(2) |
O2–C3 |
1.356(2) |
O1–C7–N2 |
120.7(2) |
![[thin space (1/6-em)]](https://www.rsc.org/images/entities/char_2009.gif) |
C3 |
Cu1–N2 |
1.970(4) |
N2–Cu1–O2 |
95.44(16) |
Cu1–N5 |
1.963(4) |
N2–Cu1–N1 |
76.45(18) |
Cu1–O1 |
2.171(4) |
N2–Cu1–N4 |
111.69(17) |
Cu1–O2 |
2.126(4) |
N5–Cu1–N2 |
168.49(18) |
Cu1–N1 |
2.284(4) |
N5–Cu1–O1 |
96.92(15) |
Cu1–N4 |
2.273(4) |
N5–Cu1–O2 |
76.18(17) |
O1–C11 |
1.257(6) |
N5–Cu1–N1 |
111.75(17) |
O2–C28 |
1.255(6) |
N5–Cu1–N4 |
76.80(18) |
N2–Cu1–O1 |
75.53(16) |
O1–Cu1–N1 |
151.24(15) |
O1–Cu1–N4 |
91.96(15) |
O2–Cu1–O1 |
93.87(15) |
O2–Cu1–N1 |
95.09(15) |
O2–Cu1–N4 |
152.85(15) |
N4–Cu1–N1 |
92.40(15) |
|
|
Density functional theory (DFT) calculations
Quantum-mechanical calculations were carried out at the density functional theory (DFT) level using B3LYP24,25 (Becke's three-parameter exchange hybrid functional, and gradient-corrected correlation functional of Lee, Yang, and Parr) method in the GAMESS program.26 Full geometry optimization of all structures and the reported Gibbs energies were optimized using the 6-31+G(d,p) basis set for all atoms. Solvation effects in the system were taken into account using the integral equation formalism model (IEF-PCM).27
Cell culture and cell viability
The human cervical cancer cell lines HeLa, the human lung carcinoma cell lines A549, cisplatin-resistant A549 (A549cisR) cells and normal lung fibroblast cells WI-38 (purchased from the American Type Culture Collection) were maintained in DMEM supplemented with 10% fetal bovine serum (FBS), 100 μg mL−1 streptomycin, 100 U mL−1 penicillin at 37 °C and 5% CO2 atmosphere.
The colorimetric 3-(4,5-dimethylthiazol-2-yl)-2,5-diphenyltetrazolium bromide (MTT) assay was used to determine the toxicity of cisplatin and these complexes. In brief, A549, A549cisR, HeLa and WI-38 cell lines were seeded into each well (5 × 10³ cells per well) of a 96-well microassay culture plates and incubated 24 h at 37 °C in a 5% CO2 incubator. Then, various concentrations of the test compound were added and incubated for 48 h. Upon completion of the incubation, the MTT solution (20 μL, 5 mg mL−1) was added into each well and the plates were incubated for an additional 4 h. After removal of the supernatant, DMSO (200 μL) was added to dissolve the resulting purple formazan crystals. The absorbance of each well was then measured using an enzyme labeling instrument with 570/630 nm double wavelength measurement. The IC50 values were calculated by the Bliss method (n = 5). Each experiment was repeated independently for at least three times.
Intracellular reactive oxygen species (ROS) measurements
A 549 cells (1 × 10⁵ cells per well) were incubated with C1–C3 at the indicated concentration (25 μM) for 24 h at 37 °C in a 5% CO2 incubator. Subsequently, the cells were collected and incubated for 15 min at 37 °C with 10 μM H2DCFDA in serum-free DMEM. The cells were washed twice with ice-cold PBS and the fluorescence intensity of each sample was measured by flow cytometric (FACScan, Bection Dickinson, San Jose, CA).
Apoptosis by flow cytometry
Induced apoptosis was assayed by Annexin V staining with propidium iodide (PI) according to the manufacturer's protocol (Abcam). For these analyses, cells were seeded at 2 × 10⁶ per well in 10% FBS–DMEM into 6-well plates, and treated with complete medium only (control) and test complex C3 at 12 μM and 25 μM. After 24 h, the cells were harvested and re-suspended in 100 μL 1× Annexin V-binding buffer, and 5 μL each of Annexin V and PI was added to each sample. Then, the cells were gently vortexed and incubated for 15 min at room temperature in the dark, followed by addition of 400 μL 1× Annexin V-binding buffer to each tube. Analysis was performed by flow cytometry (FACScan, Bection Dickinson, San Jose, CA).
Detection of mitochondrial membrane potential changes
Flow cytometry was used to detect mitochondrial membrane potential changes using the fluorescent probe JC-1 (Beyotime Jiangsu China). Cells were treated with the test complex C3 at indicated concentrations for 24 h and were then washed three times with PBS. Subsequently, the cells were collected by centrifugation and incubated with 1 mL of JC-1 (10 μg mL−1) stock solution for 20 min at 37 °C in the dark. Stained cells were centrifuged to remove the supernatant. Cells were immediately suspended in 0.5 mL PBS and analyzed immediately by flow cytometry (FACScan, Bection Dickinson, San Jose, CA).
Western blot analysis
Western blotting was performed as previously described.10,28 Primary antibodies: rabbit anti-β-actin (Sigma), rabbit anti-caspase-3 (Cell Signaling), rabbit anti-caspase-7 (Cell Signaling), mouse anti-Bcl-2 (Abcam), and mouse anti-Bcl-xl (Abcam). Secondary antibodies: horseradish peroxidase-conjugated donkey anti-rabbit and horseradish peroxidase-conjugated sheep anti-mouse (Abcam).
HSA binding studies
Fluorescence measurements were carried out on a Photon Technology International RC-D spectrofluorimeter in a 1 cm path-length quartz cell with the emission and excitation wavelength set at 300–420 and 280 nm, respectively. The interaction of complex C3 with HSA content of fixed concentration (10 μM) was studied. All measurements were recorded after 5 min of equilibration at 37 °C. The data obtained were analyzed by the following Stern–Volmer (eqn (1)) and modified Scatchard equations29 (eqn (2)): |
log[(F0 − F)/F] = log K + n × log(Q)
| (2) |
where F0 and F are the fluorescence intensities of the protein in the absence and presence of the complex C3, respectively; Kq is the quenching rate constant of the biological macromolecule; τ0 = 10−8 s, is the average lifetime of the protein without any quencher;30 K is the binding constant; [Q] is complex C3 concentration and n is the number of binding sites.
Molecular docking
Autodock Vina31 was used for protein-ligand docking and the crystal structure of HSA was retrieved from the Protein Data Bank (HSA complexed with fatty acid: 1BJ5). The 1BJ5 protein structure was modified to include polar hydrogen atoms and the protein structure was kept rigid. Rotation in the copper(II) complex, C3, was permitted about all single bonds.
Statistical analysis
Data are expressed as mean ± standard deviation (SD). Data were compared using Student's t test and considered to be statistically significant when p < 0.05.
Results and discussion
Crystal structure characterization
Fig. 1A depicts the ball-and-stick diagram for HL, which is almost planar with the dihedral angle of 4.2° between the quinoline ring and the phenyl ring. In solid state, the monomeric units of HL are arranged in a chain-like fashion by the π–π stacking between the quinoline rings and the phenyl rings (Fig. 1B).
 |
| Fig. 1 Crystallography of HL: (A) the local coordination environment of HL, hydrogen atoms and solvent molecules are omitted for clarity. (B) The π⋯π interactions (blank dash lines) in HL. | |
The molecular structure and atom numbering scheme for the complex C3 is shown in Fig. 2A. Complex C3 crystallizes in the triclinic system with space group P
. The copper atom was pseudo-octahedrally coordinated by two N2O tridentate L ligand. All Cu–N/O bond distances were highly similar to the related hydrazone Schiff base–copper complexes.32–34 In C3, the Cu–N(pyridine) distances [Cu1–N1 = 2.283 Å and Cu1–N4 = 2.274 Å] were relatively longer than the Cu–N(azo) distances [Cu1–N2 = 1.969 Å, and Cu1–N5 = 1.963 Å], indicating the different strength of the bond formed by each of the coordinated nitrogen atoms. In the solid state, C3 was linked into a two-dimensional sheet by O3–H3⋯N6iii hydrogen bond (O3⋯N6iii = 2.748 Å and the O3–H3⋯N6iii angle is 166.1, symmetry code: (iii) 1 + x, y, z) and stronger O4–H4⋯N3ii (O4⋯N3ii = 2.728 Å and the O4–H4⋯N3ii angle is 169.6°, symmetry code: (ii) 1 − x, 2 − y, 2 − z) hydrogen bond (Fig. 2B).
 |
| Fig. 2 Crystallography of C3: (A) the local coordination environment of C3, hydrogen atoms are omitted for clarity. (B) A perspective view of a 2-D supra-molecular network formed by hydrogen bonds in C3. | |
Quantum chemical calculations
As shown in Scheme 1, HL ligand can be represented by two tautomeric forms, the enol form and the keto form. Here, the C–O bond distances (C11–O1 = 1.257 Å and C28–O2 = 1.255 Å) in C3 are longer than the corresponding value (C7–O1 = 1.226 Å) in the free HL ligand, indicating that the carbonyl moiety in the C3 adopted a tautomeric form and acted as a mono-negative ligand (enol form). In order to investigate the energies involved in the process of tautomeric change of HL ligand in methanol, DFT calculations were performed (Fig. 3). As expected, the enol form was higher in energy by 5.1 kcal mol−1 in methanol, which implies that the HL ligand exists almost exclusively in its keto form in solution and that reorientation to the enol form prior to complexation is necessary. Calculated barrier in methanol for the transformation into the tautomeric form was 36.0 kcal mol−1.
 |
| Fig. 3 Optimized structures of ground (enol form and keto form) and transition states (TS) in CH3OH for HL. | |
In vitro cytotoxicity
Previous studies have illustrated that coupling of several series of chelators with metal ions can result in marked changes in anticancer activity.35,36 To determine the effect of complexation on the anticancer behavior of HL, the in vitro anticancer activity of these newly synthesized Ni(II), Co(II) and Cu(II) complexes was assessed using the MTT assay. Three human cancer cell lines, namely, the human cervical cancer cell lines HeLa, the human lung carcinoma cell lines A549 and cisplatin-resistant A549cisR were evaluated. As shown in Table 3, C1 and C2 complexes demonstrated poor anticancer activity and resulted in IC50 values of >40 μM. In comparison with C1, C2 and free HL ligand, the Cu(II) complex C3 demonstrated significantly increased anticancer activity, with no cross-resistance with cisplatin, as typified by its ability to induce cell death in both cisplatin-resistant and -sensitive cancer cell lines A549cisR and A549, respectively. In addition, we further evaluated the cytotoxicity of C3 in normal human cells (normal lung fibroblast cells WI-38). The IC50 value of C3 in WI-38 cell line was 25.74 ± 2.63 μM, which is about two times higher than that in the A549 cancer cell lines (IC50 = 12.86 ± 1.34 μM).
Table 3 Inhibition of human cancer cell lines growth (IC50a, μM) for C1–C3
Compounds |
Cell growth inhibition, IC50 ± SD (μM) |
HeLa |
A549 |
A549cisR |
WI-38 |
IC50 values are presented as the mean ± SD from three separated experiments. |
HL |
>40 |
>40 |
>40 |
>40 |
C1 |
>40 |
>40 |
>40 |
>40 |
C2 |
>40 |
>40 |
>40 |
>40 |
C3 |
17.98 ± 2.38 |
12.86 ± 1.34 |
16.06 ± 2.16 |
25.74 ± 2.63 |
Cisplatin |
12.44 ± 1.57 |
21.82 ± 1.32 |
75.29 ± 5.83 |
20.48 ± 1.75 |
Elevation of ROS levels
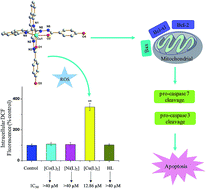
A strong correlation between the anticancer activity of metal complexes and redox potential has been demonstrated.16 Richardson et al.18 studies have shown that Cu(II) complexes were found to be redox active at potentials available to cellular oxidants and reductants, while the redox potentials of Co(II) or Ni(II) complexes lie without a range accessible to cellular oxidants and reductants. To confirm the redox activity of C1–C3, the ability of these complexes to catalyze the production of intracellular ROS in A549 cells was assessed using the fluorescent DCF probe and flow cytometry. Our studies showed that complex C3, with relatively high antiproliferative potency, can significantly increase the intracellular ROS levels, which suggests a correlation between the elevation of ROS and biological activity (Fig. 4A). However, no significant increase in H2DCF oxidation was observed with the same concentrations of Co(II) complex C1 and Ni(II) complex C2 over this same incubation period. The DCF fluorescence peaks for each concentration evaluated were quantified, which demonstrated that complex C3 caused a significant increase in H2DCF oxidation to 348 ± 23% of that of control cells (Fig. 4B).
 |
| Fig. 4 (A) Analysis of ROS levels by flow cytometry after A549 cells were treated with vehicle, HL and C1–C3 at the same concentration (25 μM) for 24 h. (B) Quantification of the flow cytometric results in (A) showing the percentage of cells with increased intracellular DCF oxidation compared to control cells. Results are the mean ± SD (n = 5): (**)p < 0.005. | |
Induction of apoptosis
It is well-known that most metal compounds can cause cell death through induction of apoptosis.37–39 Therefore, the capacity of the most active complex, C3, to induce apoptotic cell death was verified quantitatively by flow cytometric analysis of A549 cells double-labelled with Annexin V and PI. The combining Annexin V and PI staining was able to identify discriminate live, early apoptosis, late stage apoptosis and dead cells. A549 cells were incubated with C3 at the indicated concentrations and the untreated cells were used as control. The results showed that C3 can induce A549 cells apoptosis in a dose-dependent manner (Fig. 5A).
 |
| Fig. 5 (A) Representative dot plots of Annexin V and PI double staining on the A549 cells after treatment with C3 at the indicated concentrations for 24 h. (B) Effects of C3 on mitochondrial membrane potential analyzed by JC-1 staining and flow cytometry. | |
Induction of mitochondrial dysfunction
Mitochondrial dysfunction, which plays an essential role in triggering apoptosis, is demonstrated by several key events, such as the depletion of mitochondrial transmembrane potential (Δψm) and the release of cytochrome c.40 To determine whether apoptosis induced by C3 was related to mitochondrial dysfunction, we therefore investigated the change of Δψm in A549 cells by flow cytometric using the 5,5′,6,6′-tetrachloro-1,1′-3,3′-tetraethyl-benzimidazolylcarbocyanine iodide (JC-1) dye. As a cationic probe, JC-1 exhibits potential-dependent accumulation in mitochondria with the fluorescence of JC-1 dye shifting from red fluorescence (JC-1 aggregates) to green fluorescence (JC-1 monomers) at the loss of Δψm. As shown in Fig. 5B, treatment of A549 cells with C3 caused a decrease in the Δψm level in a concentration-dependent manner, which implies that C3 induced apoptosis in A549 cells through mitochondria-related pathway.
The assay of the expression of Bcl-2 family proteins
Bcl-2 family members have been described as key regulators of Δψm.41 Many previous studies on metal complexes inducing cell apoptosis showed that Bcl-2 family proteins are important key regulators of mitochondrial functions during apoptosis.42,43 To verify whether Bcl-2 family proteins were activated by C3, western blot analysis was performed to examine the expressions of Bcl-2 family proteins. A549 cells were treated with different concentration of C3 for 24 h. The western blot data revealed that the levels of proapoptotic proteins Bcl-2 and Bcl-xl were down-regulated, and the expression of a proapoptosis Bad protein was upregulated (Fig. 6). We also assessed the expression levels of cleaved caspase-3 and cleaved caspase-7 proteins. The results depicted in Fig. 6 show that C3 upregulated the expression levels of cleaved caspase-3 and cleaved caspase-7. The ratio of Bax/Bcl-2 protein and Bad/Bcl-xl increased, which led to mitochondrial dysfunction and activation of caspase-3 and caspase-7.
 |
| Fig. 6 Western blot analysis of Bcl-2, Bcl-xl, Bad, Bax, cleaved caspase-3 and cleaved caspase-7 in A549 cells treated with different concentrations of C3 for 24 h. | |
HSA binding studies
HSA is one of the most abundant soluble plasma proteins of the circulatory system, which plays a vital role in the exogenous drug transport, drug distribution and drug metabolism.44–46 Therefore, it is interesting to explore the interaction of human serum albumin with complex C3.
Fluorescence quenching is an important technique to understand the interaction of metal complexes with HSA. Upon addition of increasing concentrations of C3 to the aqueous HSA solution, a gradual attenuation of the fluorescence intensity (at around 345 nm) of HSA was observed (Fig. 7A). This result suggested the interaction of C3 with HSA protein leading to changes in its tryptophan residue (Trp-214) structure. Fluorescence quenching mechanisms are usually classified into static quenching and dynamic quenching. Using eqn (1) (Stern–Volmer equation), Kq value obtained for C3 studied was 1.67 (±0.04) × 1012 M−1 s−1, which far exceeds the diffusion controlled constant (2.0 × 10¹⁰ M−1 s−1), indicating that the quenching occurred statically in the C3–HSA complex. The binding constant K (5.83 (±0.05) × 104 M−1) and the numbers of binding sites n (1.1) were calculated according to the eqn (2) (Fig. 7B). The n value suggested that there was a single class-binding site in the neighborhood of the tryptophan residue of HSA for the complex.
 |
| Fig. 7 (A) Fluorescence quenching spectra of HSA by different concentrations of C3. (B) Double-log plots for the fluorescence quenching of the HSA by C3. T = 298 K; [HSA] = 10 μM; pH = 7.4; λex = 280 nm. | |
Docking studies were conducted to further investigate the interaction between C3 and HSA. As shown in Fig. 8A, the copper(II) complexes were located within the binding pocket of sub-domain IIA (the warfarin binding pocket). This region consists of a modestly flexible, hydrophobic cavity and a polar side chain cluster (Arg-218, Arg-222, Lys-195, Lys-199, Glu2-92) near the pocket entrance. The HSA–C3 complex is stabilized by hydrogen bonds with different bond lengths (Fig. 8B). Specifically, Glu-450 interacts with the pendant phenolic hydroxyl of C3. Lys-199 is in close proximity to the oxygen atom bound to Cu. Some hydrophobic interactions also exist in the corresponding residues including Leu-238, Leu-219, Ala-291, Phe-223 and Phe-157. The Cu(II) center is located approximately 6.7 Å away from Trp-214, allowing for quenching of fluorescence from the tryptophan residue of HSA, which is consistent with the fluorescence quenching studies.
 |
| Fig. 8 Docking studies of C3 and HSA using Autodock Vina: (A) Cu complex is buried beneath the HSA protein surface. (B) Cu complex interacting with a variety of amino acid residues. | |
Conclusions
In this study, we synthesized the Co(II), Ni(II) and Cu(II) complexes of the tridentate heterocyclic hydrazone ligand (HL) and examined their antiproliferative activity. Among them, the Cu(II) complex C3, as the most active metal complex, displayed micromolar toxicities against various cancer cell lines, including cisplatin-resistant A549 cells. Only the Cu(II) complex significantly increased the intracellular ROS level, which indicates its role in the anticancer activity. Further mechanism studies suggested that C3 regulated the expression of anti-apoptotic and pro-apoptotic proteins, leading to mitochondrial dysfunction and activations of caspase-7 and caspase-3 for inducing cell apoptosis. The interaction between C3 and HSA was also studied to understand the carrier role of serum albumin for C3 in blood under physiological conditions. This work may be helpful in the development of heterocyclic hydrazones metal complexes for cancer treatment.
Acknowledgements
The authors are grateful to the Guangxi Normal University for partial support of this work.
Notes and references
- L. A. Torre, F. Bray, R. L. Siegel, J. Ferlay, J. Lortet-Tieulent and A. Jemal, Ca-Cancer J. Clin., 2015, 65, 87 CrossRef PubMed.
- M. Galanski, M. A. Jakupec and B. K. Keppler, Curr. Med. Chem., 2005, 12, 2075 CrossRef CAS PubMed.
- A. L. Lainé and C. Passirani, Curr. Opin. Pharmacol., 2012, 12, 420 CrossRef PubMed.
- F. Arnesano and G. Natile, Coord. Chem. Rev., 2009, 253, 2070 CrossRef CAS.
- C. Santini, M. Pellei, V. Gandin, M. Porchia, F. Tisato and C. Marzano, Chem. Rev., 2014, 114, 815 CrossRef CAS PubMed.
- Y. W. Jung and S. J. Lippard, Chem. Rev., 2007, 107, 1387 CrossRef CAS PubMed.
- P. C. A. Bruijnincx and P. J. Sadler, Curr. Opin. Chem. Biol., 2008, 12, 197 CrossRef CAS PubMed.
- J. R. Dilworth, Coord. Chem. Rev., 1976, 21, 29 CrossRef CAS.
- D. R. Richardson and K. Milnes, Blood, 1997, 86, 3025 Search PubMed.
- J. Deng, Y. Gou, W. Chen, X. Fu and H. Deng, Bioorg. Med. Chem., 2016, 24, 2190 CrossRef CAS PubMed.
- J. Gao and D. R. Richardson, Blood, 2001, 98, 842 CrossRef CAS PubMed.
- C. M. Armstrong, P. V. Bernhardt, P. Chin and D. R. Richardson, Eur. J. Inorg. Chem., 2003, 1145 CrossRef CAS.
- S. Shit, J. Chakraborty, B. Samanta, A. Slawin, V. Gramlich and S. Mitra, Struct. Chem., 2009, 20, 633 CrossRef CAS.
- P. Krishnamoorthy, P. Sathyadevi, A. H. Cowley, R. R. Butorac and N. Dharmaraj, Eur. J. Med. Chem., 2011, 46, 3376 CrossRef CAS PubMed.
- S. H. van Rijt and P. J. Sadler, Drug Discovery Today, 2009, 14, 1089 CrossRef CAS PubMed.
- P. J. Jansson, P. C. Sharpe, P. V. Bernhardt and D. R. Richardson, J. Med. Chem., 2010, 53, 5759 CrossRef CAS PubMed.
- D. B. Lovejoy, P. J. Jansson, U. T. Brunk, J. Wong, P. Ponka and D. R. Richardson, Cancer Res., 2011, 71, 5871 CrossRef CAS PubMed.
- P. V. Bernhardt, P. C. Sharpe, M. Islam, D. B. Lovejoy, D. S. Kalinowski and D. R. Richardson, J. Med. Chem., 2009, 52, 407 CrossRef CAS PubMed.
- X. M. He and D. C. Carter, Nature, 1992, 358, 209 CrossRef CAS PubMed.
- Y. R. Zheng, K. Suntharalingam, T. C. Johnstone, H. Yoo, W. Lin, J. G. Brooks and S. J. Lippard, J. Am. Chem. Soc., 2014, 136, 8790 CrossRef CAS PubMed.
- F. Kratz, J. Controlled Release, 2014, 190, 331 CrossRef CAS PubMed.
- G. M. Sheldrick, SADABS: Program for Empirical Absorption Correction of Area Detector Data, University of Göttingen, Germany, 1996 Search PubMed.
- G. M. Sheldrick, SHELXTL V5.1: Software Reference Manual, Bruker AXS, Inc., Madison, WI, USA, 1997 Search PubMed.
- A. D. Becke, J. Chem. Phys., 1993, 98, 5648 CrossRef CAS.
- C. Lee, W. Yang and R. G. Parr, Phys. Rev., 1988, B37, 785 Search PubMed.
- M. W. Schmidt, K. K. Baldridge, J. A. Boatz, S. T. Elbert, M. S. Gordon, J. H. Jensen, S. Koseki, N. Matsunaga, K. A. Nguyen, S.
J. Su, T. L. Windus, M. Dupuis and J. Montgomery, J. Comput. Chem., 1993, 14, 1347 CrossRef CAS.
- J. Tomasi, B. Mennucci and E. Cances, THEOCHEM, 1999, 464, 211 CrossRef CAS.
- J. Deng, W. Chen and H. Deng, J. Fluoresc., 2016, 26, 1987 CrossRef CAS PubMed.
- J. J. Stephanos, J. Inorg. Biochem., 1996, 62, 155 CrossRef CAS PubMed.
- J. R. Lakowicz and G. Weber, Biochemistry, 1973, 12, 4161 CrossRef CAS PubMed.
- O. Trott and A. J. Olson, J. Comput. Chem., 2010, 31, 455 CAS.
- Y. J. Jang, U. Lee and B. K. Koo, Bull. Korean Chem. Soc., 2005, 26, 925 CrossRef CAS.
- M. Nandya, D. L. Hughesb, G. M. Rosairc, R. K. B. Singhd and S. Mitra, J. Coord. Chem., 2014, 67, 3335 CrossRef.
- J. Patole, U. Sandbhor, S. Padhye, D. N. Deobagkar, C. E. Anson and A. Powell, Bioorg. Med. Chem. Lett., 2003, 13, 51 CrossRef CAS PubMed.
- D. S. Kalinowski, Y. Yu, P. C. Sharpe, M. Islam, Y. T. Liao, D. B. Lovejoy, N. Kumar, P. V. Bernhardt and D. R. Richardson, J. Med. Chem., 2007, 50, 3716 CrossRef CAS PubMed.
- D. R. Richardson, P. C. Sharpe, D. B. Lovejoy, D. Senaratne, D. S. Kalinowski, M. Islam and P. V. Bernhardt, J. Med. Chem., 2006, 49, 6510 CrossRef CAS PubMed.
- W. Ginzinger, G. Muhlgassner, V. B. Arion, M. A. Jakupec, A. Roller, M. Galanski, M. Reithofer, W. Berger and B. K. Keppler, J. Med. Chem., 2012, 55, 3398 CrossRef CAS PubMed.
- A. Kisova, L. Zerzankova, A. Habtemariam, P. J. Sadler, V. Brabec and J. Kasparkova, Mol. Pharm., 2011, 8, 949 CrossRef CAS PubMed.
- X. Qiao, Z. Y. Ma, C. Z. Xie, F. Xue, Y. W. Zhang, J. Y. Xu, Z. Y. Qiang, J. S. Lou, G. J. Chen and S. P. Yan, J. Inorg. Biochem., 2011, 105, 728 CrossRef CAS PubMed.
- C. Wang and R. J. Youle, Annu. Rev. Genet., 2009, 43, 95 CrossRef CAS PubMed.
- S. Cory and J. M. Adams, Nat. Rev. Cancer, 2002, 2, 647 CrossRef CAS PubMed.
- L. L. Li, Y. S. Wong, T. F. Chen, C. D. Fan and W. J. Zheng, Dalton Trans., 2012, 41, 1138 RSC.
- T. F. Chen, Y. N. Liu, W. J. Zheng, J. Liu and Y. S. Wong, Inorg. Chem., 2010, 49, 6366 CrossRef CAS PubMed.
- N. Seedher and S. Bhatia, Pharmacol. Res., 2006, 54, 77 CrossRef CAS PubMed.
- F. Kratz, J. Controlled Release, 2008, 132, 171 CrossRef CAS PubMed.
- J. C. Pessoa and I. Tomaz, Curr. Med. Chem., 2010, 17, 3701 CrossRef CAS PubMed.
|
This journal is © The Royal Society of Chemistry 2016 |
Click here to see how this site uses Cookies. View our privacy policy here.