 Open Access Article
Surfactant-free synthesis of hollow mesoporous organosilica nanoparticles with controllable particle sizes and diversified organic moieties†
Natsume
Koike
,
Watcharop
Chaikittisilp
,
Atsushi
Shimojima‡
and
Tatsuya
Okubo
*
Department of Chemical System Engineering, The University of Tokyo, 7-3-1 Hongo, Bunkyo-ku, Tokyo 113-8656, Japan. E-mail: okubo@chemsys.t.u-tokyo.ac.jp
First published on 14th September 2016
Abstract
Fine control over particle sizes and organic moieties of hollow organosilica nanoparticles is of importance towards practical applications of functional colloids in, for example, catalysis, drug delivery, and coating. Here, we report the versatile synthesis of hollow mesoporous organosilica nanoparticles with controllable particle sizes and diversified organic moieties using silica nanoparticles (SNs) as sacrificial, hard templates, which are removed by dissolution under alkali conditions. The resulting organosilica nanoparticles possessed size-tunable hollow interiors that can be accessed through mesoporous shells. The diameters of such hollow organosilica nanoparticles were easily controlled by altering the diameters of the SN templates, ranging from 12 to 170 nm. Organic moieties in the mesoporous shells can be diversified by changing the organosilica sources, (EtO)3Si–R–Si(OEt)3, where R = methylene, ethylene, and phenylene groups. In addition, it was revealed that there are minimum surface areas of the SN templates in the dispersions required to achieve the monodisperse silica/organosilica core/shell nanoparticles without homogeneous nucleation of organosilica nanoparticles. The nitrogen and argon adsorption–desorption isotherms of the resulting hollow organosilica nanoparticles showed type H5 hysteresis loops, which are derived from the mixed pore system of cage-like pores (hollow spaces) and open pores (interparticular voids between hollow organosilica nanoparticles). Hysteresis scanning measurements and NLDFT pore size distributions revealed the pore structures of the resulting hollow organosilica nanoparticles.
Introduction
Mesoporous silica nanoparticles have been intensively studied for increasing numbers of applications such as catalysis,1–3 drug delivery,4,5 and coating6,7 due to their fascinating characteristics including tunable pore sizes, high surface areas, and large pore volumes. Tailoring their structural features can greatly improve their performance. In particular, hollow nanoparticles with mesoporous shells are highly desirable because such nanoparticles can be functionalized by modifying the chemical compositions of the shells and by incorporating guest species into the hollow nanospaces.8,9 In addition, when used as drug delivery carriers they offer the possibility to incorporate a large amount of drug molecules inside the hollow spaces with controllable release rates.10,11 The hollow interiors can also be a container of nanocrystals to form yolk–shell catalysts,12–16 which are used as highly active nano-reactors for successful cascade reactions, and confined templates for the growth of nanoparticles.17Physicochemical properties of the hollow nanoparticles mainly depend on the functionalities of the shells.8,9 Organosilica, a hybrid material having organic groups in the silica framework, has several advantages over the pure siliceous framework as a shell component, including versatile functionalities and potential to modify mechanical and physical properties of the particles.18–20 For example, the phenylene-bridged silsesquioxane (O1.5Si–C6H4–SiO1.5) framework can be subjected to sulfonation and amination for catalysis,21,22 act as a support for homogeneous catalysts with controlled locations of active species,23 and provide desirable interactions with aromatic anticancer drugs and unique pH-stimuli responsive drug-releasing performance.24,25 Recent examples of functional groups in organosilica materials include redox-responsive disulfide26 and enzymatically degradable oxamide27 bridges. In addition, organic moieties that are able to form hydrogen-bonds can provide molecular assembly through hydrogen-bonding interaction, resulting in organosilica with crystal-like framework.28
Soft- and hard-templating approaches have been developed to prepare hollow nanoparticles.29 Until recently, most of hollow organosilica nanoparticles have been fabricated using block copolymers or surfactant micelles such as cetyltrimethylammonium bromide and pluronic F127 block copolymer as soft templates.30–35 However, such a soft-templating method generally requires careful adjustments of synthesis conditions to control the micelle formation. Furthermore, it is difficult to finely tune the particle sizes and to keep the dispersibility of the particles. Particle sizes larger than 50 nm are generally hard to be obtained and the resulting particles are often aggregated during the removal of the templates by calcination, solvent extraction, and ion exchange. These limit their uses in the applications where high dispersibility and precise control of particle sizes are required (e.g., drug delivery).36
On the other hand, the hard templates can maintain their structures during the synthesis and hence can template their particle sizes and shapes, resulting in the hollow nanoparticles with variable sizes and shapes.37,38 The synthesis of hollow organosilica nanoparticles by using several hard templates such as polystyrene beads39 and α-Fe2O3 nanoparticles40 have been reported. However, the available particle sizes are limited for those conventional hard templates (generally larger than 100 nm) and the removal of the templates requires complex procedures often impairing the monodispersity of the resulting materials.
We have established a one-pot synthesis method for hollow organosilica nanoparticles using silica nanoparticles (SNs) as hard templates.41 By simply stirring a biphasic mixture of bridge-type organoalkoxysilane precursors ((R′O)3Si–R–Si(OR′)3 where R, R′ = organic groups) and aqueous dispersions of SNs, granular shells constructed from tiny nanoparticles of organosilica are formed on SN templates, yielding aqueous dispersions of silica/organosilica core/shell nanoparticles. In the shell, mesopores exist as voids between tiny organosilica nanoparticles. Because the stability against hydrolysis at elevated pH of pure silica is much lower than that of organosilica,42,43 the SN cores can be removed easily by relatively moderate base treatments, while keeping the high dispersibility of the resulting hollow nanoparticles. Recently, by employing similar silica etching strategies, other groups have also reported the syntheses of hollow and yolk/shell mesoporous organosilica nanoparticles but their procedures require surfactants to generate mesoporous within the organosilica shells.44,45
Given that the sizes of SNs and hollow spaces are almost identical, it should be able to finely tune the sizes of hollow spaces if the sizes of SNs can be controlled precisely. In the previous report,41 however, when the sizes of SNs were increased to ca. 60 nm, some tiny organosilica nanoparticles were formed in dispersions, in addition to the hollow organosilica nanoparticles. In this paper, we report that the hollow organosilica nanoparticles with controlled sizes and different organic moieties can be synthesized without the tiny organosilica nanoparticles co-formed in dispersions by carefully tuning the synthesis conditions. The key parameter to prevent the homogeneous nucleation of tiny organosilica nanoparticles is discussed. In addition, the detailed porous structures of the hollow organosilica nanoparticles are characterized by advanced adsorption–desorption analysis including the hysteresis scanning measurement.46
Experimental
Chemicals
All chemicals were used as received without any further purification. Tetraethoxysilane (TEOS), L-arginine, 50% sodium hydroxide (NaOH) solution were purchased from Wako Pure Chemical Industries, Ltd. Bis(triethoxysilyl)methane (BTME) was purchased from Gelest, Inc. 1,2-Bis(triethoxysilyl)ethane (BTEE) and 1,4-bis(triethoxysilyl)benzene (BTEB) were purchased from Sigma-Aldrich.Synthesis of hollow organosilica nanoparticles
In a typical synthesis of the hollow organosilica nanoparticles, an aqueous dispersion of the template SNs, which was obtained by the reported procedures47–49 (see the ESI† for the details), was mixed with required amounts of water and L-arginine. The total amount of the dispersion and the L-arginine concentration were fixed at 25 g and 0.01 mol%, respectively. Then, BTEE (0.88 g) was added dropwise and the resulting biphasic mixture was heated at 60 °C while stirring at 500 rpm. After the upper oil (BTEE) phase disappeared, pH of the dispersion was increased to about pH 13 by adding a NaOH aqueous solution (0.15 mol L−1). After stirring at room temperature for 2 days to dissolve the SN templates, the dispersion was dialyzed against deionized water for 1 day to remove NaOH and dissolved silicate species. The resulting dispersion was subjected to further characterizations. The amount of BTEE, the ratio of SNs dispersion to additional water, and the concentration of L-arginine were altered respectively to clarify the key parameter to obtain the hollow nanoparticles without the tiny organosilica nanoparticles co-formed in the dispersions. In addition, BTME and BTEB were employed as organosilica precursors to show the versatility of this method.Characterizations
Field-emission scanning electron microscopy (FE-SEM) images were obtained with a Hitachi S-900 at an accelerating voltage of 6 kV. Samples for SEM observation were prepared by spin-coating the dispersions of nanoparticles onto silicon substrates, followed by sputter deposition of Pt for 15 s in an argon atmosphere with a Hitachi E-1030 ion sputter. Transmission electron microscopy (TEM) observations of nanoparticles were performed to observe the morphology of nanoparticles using a JEOL JEM 2000EXII microscopy at 200 kV. A carbon-coated copper grid was used as a substrate. Dynamic light scattering and zeta potential measurements were performed on a Malvern Zetasizer Nano ZS90 instrument at 25 °C. Solid-state 29Si MAS NMR spectra were obtained on a Chemagnetics CMS-300 spectrometer at 59.7 MHz with a 45° pulse and a recycle delay of 80 s. Adsorption and desorption measurements, including hysteresis scanning experiments, were conducted using an Autosorb-iQ2-MP (Quantachrome Instruments) with nitrogen (at −196 °C) and argon (at −186 °C). Before measurements, samples were degassed at 150 °C for 6 h. The Brunauer–Emmett–Teller (BET) specific surface areas of samples were calculated from adsorption data at a relative pressure range of 0.05–0.2. The total pore volumes were calculated from the adsorbed amount at a relative pressure of 0.99. The pore size distributions were calculated from the isotherms by applying a nonlocal density functional theory (NLDFT) method assuming argon (or nitrogen) adsorption in cylindrical silica pores. Fourier transform infrared (FT-IR) spectra of the samples were obtained using a KBr method on a JASCO FT/IR-6100 spectrometer at a nominal resolution of 0.5 cm−1. Powder samples for solid-state NMR, gas sorption, and FT-IR measurements were obtained by evaporation of solvents from the dispersions at 60 °C under vacuum.Results and discussion
Synthesis of hollow organosilica nanoparticles using silica nanoparticles with different diameters
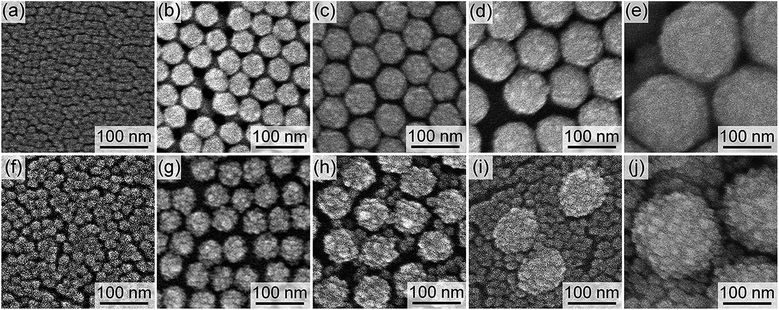
The sizes of the hollow spaces of the organosilica nanoparticles are determined by the diameters of the SN templates. The SNs with five different diameters of 12, 44, 60, 88, and 170 nm were employed as the hard templates to show the controllability of the hollow sizes. FE-SEM images of the SNs are shown in Fig. 1a–e with larger images in Fig. S1 in the ESI.† The SNs were monodisperse regardless of the diameters. FE-SEM images of the resulting silica/organosilica core/shell nanoparticles prepared using the SN templates are shown in Fig. 1f–j. In all cases, the concentration of the SN templates in the reactant solutions, calculated from the TEOS amount used in the preparation of SNs, was fixed at 1.25 wt%. Hereafter, the core/shell nanoparticles are named as CS-SNw-x, where w and x are the diameter and the concentration of the SN template, respectively. For example, the core/shell nanoparticles prepared using 12 nm SN templates with a concentration of 1.25 wt% is referred to as CS-SN12-1.25. Note that the total weight of SN dispersions, the concentration of L-arginine in the reactant mixtures, and the BTEE amount were fixed at 25 g, 0.01 mol%, and 0.88 g, respectively.Organosilica shells were successfully formed on the SN templates in the cases of CS-SN12-1.25 (Fig. 1f) and CS-SN44-1.25 (Fig. 1g). On the contrary, tiny organosilica nanoparticles were separately formed in the dispersion together with the silica/organosilica core/shell nanoparticles in the cases of CS-SN60-1.25 (Fig. 1h), CS-SN88-1.25 (Fig. 1i), and CS-SN170-1.25 (Fig. 1j). Because of the tiny particle formation, the monodisperse core/shell nanoparticles cannot be obtained when SNs larger than 60 nm were used as templates at the concentration of 1.25 wt%. The key parameters to control the successful shell formation without the separately formed tiny nanoparticles are discussed below.
To make the hollow structures, the SN cores of the successfully synthesized core/shell nanoparticles (CS-SN12-1.25 and CS-SN44-1.25) were removed by dissolution under basic conditions followed by dialysis. Hereafter, the hollow nanoparticles after the core removal are named as H-SNw-x. Fig. 2 shows FE-SEM and TEM images of H-SN12-1.25 and H-SN44-1.25. Apparently, the hollow structures reflecting the diameters of the SN templates were successfully formed for both H-SN12-1.25 and H-SN44-1.25. For both samples, the internal spaces were spherical and smooth, reflecting the morphology of the SNs, in contrast to the granular morphology of the external surface of the shells.
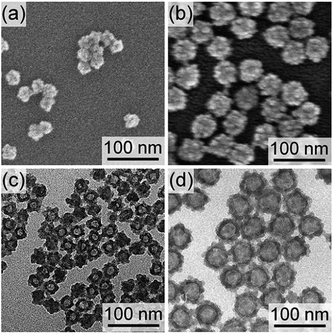 | ||
| Fig. 2 (a, b) FE-SEM and (c, d) TEM images of (a, c) H-SN12-1.25 and (b, d) H-SN44-1.25 obtained after the base treatment. | ||
The removal of silica cores by the base treatment was confirmed by solid-state 29Si MAS NMR (see Fig. S2 in the ESI†). The spectrum of CS-SN44-1.25 showed both T2 and T3 signals, arising from the organosilica shells, and Q3 and Q4 signals, attributed to the SN templates (Tm and Qn represent CSi(OSi)m(OH)3−m and Si(OSi)n(OH)4−n, respectively). The integral intensity ratio of (Q3 + Q4)/(T2 + T3) was 1.4 for CS-SN44-1.25. By contrast, in the case of H-SN44-1.25, the Q3 and Q4 signals almost disappeared with the (Q3 + Q4)/(T2 + T3) ratio greatly decreasing to 0.09, suggesting that about 93% of the Qn silica species were removed from CS-SN44-1.25 by the base treatment. FT-IR analyses of CS-SN44-1.25 and H-SN44-1.25 indicated that the organosilica shells remained intact as no changes in the spectra of the C–H stretching were observed after the core removal, confirming that no cleavage of Si–(CH2)2–Si linkages occurred upon the core removal (Fig. S3 in the ESI†).
Importantly, dynamic light scattering (DLS) of the aqueous suspensions of 44 nm SN, CS-SN44-1.25 and H-SN44-1.25 revealed that these particles were monodisperse throughout the synthetic procedures (see Fig. S4a in the ESI†). Moreover, the dispersion of the hollow nanoparticles is highly stable as no precipitate has been observed even after 2 years in the H-SN44-1.25 dispersion (see Fig. S4b in the ESI†). This can be attributed to strong electrostatic repulsions between the nanoparticles, as suggested by the high zeta potential (−34 mV at pH 7.8). The DLS analysis also showed that particle size increased after the shell formation and slightly decreased after the core removal.
Effect of the amounts of organosilica source on the formation of organosilica shell
As shown in the previous section, the tiny organosilica nanoparticles were formed in the dispersion together with the organosilica shells under the synthesis conditions described above when the SN templates were larger than 60 nm. One may confer that a decrease in the amount of organosilica precursors can suppress the formation (nucleation) of the tiny organosilica nanoparticles in the dispersion. To investigate the effect of the amount of organosilica precursors, the amount of BTEE was varied from the typical amount (0.88 g) to 0.60 and 2.20 g, when the SNs of 44 and 60 nm were employed.Fig. 3 shows TEM images of the products after the base treatment obtained with varied amounts of BTEE. For the 44 nm SNs, organosilica shells became thicker as the amounts of BTEE were increased (Fig. 3a, c and e). No tiny organosilica nanoparticles were separately formed in the dispersions even when the BTEE amount was increased to 2.2 g. On the other hand, as shown in Fig. 3b, d and f, tiny organosilica particles were formed in the dispersions together with the hollow nanoparticles when 60 nm nanoparticles were employed, even when the BTEE amount was reduced to 0.6 g. Note that the BTEE amount of 0.6 g was not enough to form the organosilica shells and partial collapse of the shell occurred upon the core removal (Fig. 3b). These results suggest that the amount of BTEE has no significant effects on the formation of tiny organosilica nanoparticles in the dispersion. In addition, if the synthesis conditions are appropriate (i.e., no tiny organosilica nanoparticles formed), the shell thickness can be altered according to the BTEE amount as can be observed in the case when 44 nm SNs were employed.
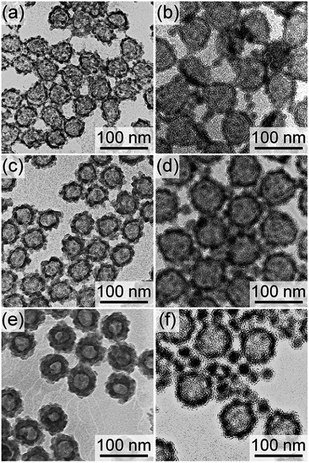 | ||
| Fig. 3 TEM images of products after the base treatment synthesized using (a, c, e) 44 nm and (b, d, f) 60 nm SN templates with the BTEE amounts of (a, b) 0.6, (c, d) 0.88, and (e, f) 2.2 g. | ||
Effect of the concentrations of SN templates on the formation of organosilica shell
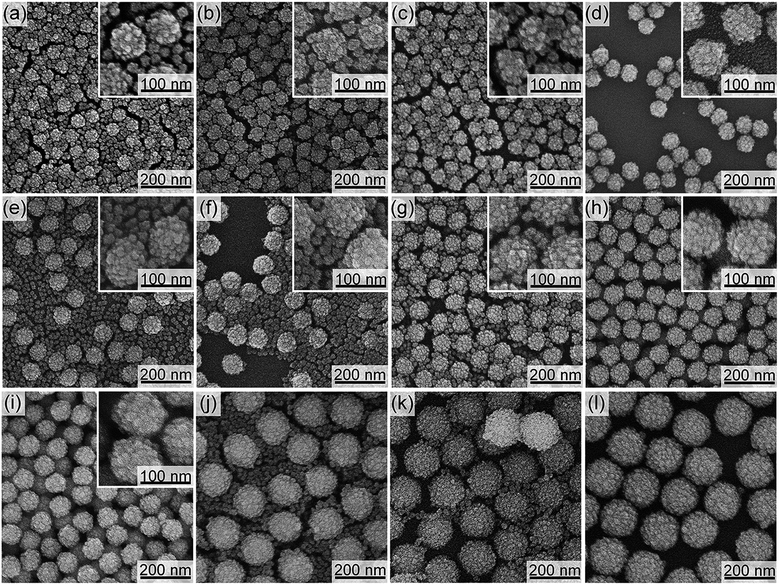
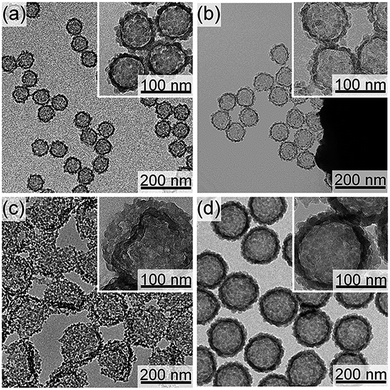
When the silica/organosilica core/shell nanoparticles are formed simultaneously with the tiny organosilica nanoparticles in the dispersion, one can imply that the deposition of organosilica shells on the SN templates occurs competitively with the homogeneous nucleation of tiny nanoparticles in the dispersion. Therefore, the enhancement in the deposition of organosilica shells should suppress the homogenous nucleation of tiny nanoparticles. We have thus considered that the deposition of organosilica shells can be enhanced by increasing the total external surface areas of the SN templates in the dispersion. This can decrease the concentration of the hydrolyzed organosilane precursors available for the nucleation of tiny nanoparticles in the dispersion and subsequently suppress their formation.As summarized in Table 1, the effect of SN templates concentrations on the organosilica shell formation was investigated. The ratio of SN dispersion to additional water was changed while keeping the total amount of final dispersion at 25 g. The concentration of L-arginine in the reactant mixture and the BTEE amount were fixed at 0.01 mol% and 0.88 g, respectively. FE-SEM images of the resulting core/shell nanoparticles are shown in Fig. 1f–j and 4. When the concentrations of the SN templates were low, tiny organosilica nanoparticles were observed together with the silica/organosilica core/shell nanoparticles (i.e., CS-SN60-1.25, -1.90, -2.02, -2.15 for 60 nm SNs, CS-SN88-1.25, -2.68, -2.95, -3.22 for 88 nm SNs, and CS-SN170-1.25, -4.08, -5.44 for 170 nm SNs). By increasing the concentrations of SN templates, the core/shell nanoparticles were successfully formed without the separately formed tiny nanoparticles (i.e., CS-SN60-2.27, CS-SN88-3.49, and CS-SN170-6.81). The required concentrations of SN templates depend on the SN sizes, being 2.27 wt% for 60 nm SNs, 3.49 wt% for 88 nm SNs, and 6.81 wt% for 170 nm SNs.
| Sample | SN diameter/nm | Amount of SN dispersion/g | Amount of additional water/g | SN concentrations/wt% | Silica surface-area density (SSN)/m2 g−1 | Organosilica formation |
|---|---|---|---|---|---|---|
| a The total amount of the final dispersion, the concentration of L-arginine in the reactant mixture, and the BTEE amount were fixed at 25 g, 0.01 mol%, and 0.88 g, respectively. | ||||||
| CS-SN12-1.25 | 12 | 14.7 | 10.3 | 1.25 | 2.85 | Shell |
| CS-SN44-1.25 | 44 | 5.0 | 20.0 | 1.25 | 1.03 | Shell |
| CS-SN60-1.25 | 60 | 4.9 | 20.1 | 1.25 | 0.56 | Tiny particles/shell |
| CS-SN60-1.90 | 60 | 7.5 | 17.5 | 1.90 | 0.86 | Tiny particles/shell |
| CS-SN60-2.02 | 60 | 8.0 | 17.0 | 2.02 | 0.92 | Tiny particles/shell |
| CS-SN60-2.15 | 60 | 8.5 | 16.5 | 2.15 | 0.98 | Tiny particles/shell |
| CS-SN60-2.27 | 60 | 9.0 | 16.0 | 2.27 | 1.03 | Shell |
| CS-SN88-1.25 | 88 | 4.7 | 20.3 | 1.25 | 0.38 | Tiny particles/shell |
| CS-SN88-2.68 | 88 | 10.0 | 15.0 | 2.68 | 0.83 | Tiny particles/shell |
| CS-SN88-2.95 | 88 | 11.0 | 14.0 | 2.95 | 0.91 | Tiny particles/shell |
| CS-SN88-3.22 | 88 | 12.0 | 13.0 | 3.22 | 1.00 | Tiny particles/shell |
| CS-SN88-3.49 | 88 | 13.0 | 12.0 | 3.49 | 1.08 | Shell |
| CS-SN88-6.71 | 88 | 25.0 | 0 | 6.71 | 2.08 | Shell |
| CS-SN170-1.25 | 170 | 4.6 | 20.4 | 1.25 | 0.20 | Tiny particles/shell |
| CS-SN170-4.08 | 170 | 15.0 | 10.0 | 4.08 | 0.66 | Tiny particles/shell |
| CS-SN170-5.44 | 170 | 20.0 | 5.0 | 5.44 | 0.85 | Tiny particles/shell |
| CS-SN170-6.81 | 170 | 25.0 | 0 | 6.81 | 1.09 | Shell |
The core/shell nanoparticles formed without the tiny particles in the solution (CS-SN60-2.27, CS-SN88-3.49 and CS-SN170-6.81) were treated with a basic solution to remove the silica cores. As shown in Fig. 5, the hollow structures were successfully formed for CS-SN60-2.27 and CS-SN88-3.49; however, in the case of CS-SN170-6.81, partial collapse of the shell occurred upon the core removal (Fig. 5c). The required amount of organosilica source to strengthen the shells of the hollow structures after the core removal seemed higher for 170 nm SNs. When the BTEE amount was increased from 0.88 to 2.5 g, hollow nanoparticles were successfully formed after the core removal (Fig. 5d).
To identify the factor determining the successful shell formation, surface-area density (SSN) defined as the external surface areas of the SN templates per the unit mass of the reactant dispersion was calculated as follows.
 | (1) |
 | (2) |
Interestingly, the surface-area density, SSN, at the required concentrations to form organosilica shells without tiny nanoparticles in the dispersions for each size of SNs is almost identical, as shown in Table 1, being ca. 1 m2 g−1, suggesting that the surface areas of SNs are critical to the shell formation. When the SSN in the reactant dispersion is higher than the minimum required value, the more concentrated condition is applicable. For example, CS-SN88-6.71 was prepared by using the 88 nm SN template at the SN concentration of 6.71 wt%, resulting in the SSN of 2.08 m2 g−1 (see Table 1). The organosilica shells were successfully formed on the SN templates without the separately-formed tiny nanoparticles (Fig. 4i). Akin to the case of H-SN170-6.81 (Fig. 5c), however, the amount of the organosilica source was not enough to strengthen the shells and the organosilica shells were partially collapsed after the core removal (see Fig. S5a in the ESI†). When the organosilica amount was increased to 2.3 g, the hollow organosilica nanoparticles, which is named as H-SN170-6.81′, were successfully formed (see Fig. S5b and c in the ESI†). These results suggested that when the SSN and the amount of organosilica sources were controlled appropriately, the hollow organosilica nanoparticles can be prepared with a wide range of interior diameters by altering the sizes of the SN templates.
Formation scheme of the core/shell nanoparticles
It is clear that the surface-area density of SNs is an important factor for the formation of the organosilica shell without tiny nanoparticles existing in the dispersion. In our method, the initial reactant mixture contains two phases, namely, oil (organosilica precursors) and water (SN dispersions). In the preparation of monodisperse silica nanoparticles,47–49 it was reported that the similar two-phase method allows the silica source to hydrolyze slowly at the oil/water interfaces to continuously supply silicate species into the water phase. As a result, the silica nanoparticles formed at the early stage are gradually grown while the number density of the nanoparticles remains unchanged.49In our case, it is considered that organosilica source is similarly hydrolyzed at the oil/water interfaces. The hydrolyzed species are then transferred into the water phase and subsequently condensed (deposited) on the surfaces of the SN templates. The hydrolysis rate of organosilica source is independent of the sizes and the concentrations of SNs. On the other hand, the condensation rate of the hydrolyzed organosilanes on the SN surfaces is considered to be directly correlated to the surface-area density of SNs because it determines the accessibility to the silanol groups on the SN surfaces (see Fig. 6). Therefore, the co-condensation rate of organosilanes decreases as the surface-area density decreases. When the co-condensation rate falls below the hydrolysis rate, the concentration of the hydrolyzed organosilicate species in water increases, leading to the formation (nucleation) of organosilica nanoparticles in the dispersions when a critical supersaturation is reached.50
To further understand the effect of the hydrolysis rate, the concentrations of L-arginine, which catalyzes the hydrolysis of organosilica precursors, were altered. Fig. 7 shows FE-SEM images of the resulting silica/organoslica core/shell nanoparticles synthesized under the identical conditions for CS-SN88-3.49 but with different L-arginine concentrations of 0.01–0.10 mol%. The tiny organosilica nanoparticles formed separately in the dispersion were observed together with the silica/organosilica core/shell nanoparticles when the concentration of L-arginine was higher than 0.031 mol% (Fig. 7c–e). When the L-arginine concentration was decreased to 0.003 mol%, the hydrolysis of organosilica precursor became very slow and the reaction did not finish even after 1 week.
It can be considered that when the concentration of L-arginine increased, the hydrolysis of organosilanes was enhanced, which is agreed with the previous time-dependent study on the formation of SNs using amino acid as a catalyst.49 For a series of experiments with varied L-arginine concentrations, there likely exists a point where the hydrolysis rate balances with the co-condensation rate of organosilica precursors. If the hydrolysis rate exceeded the co-condensation rate, the formation of tiny nanoparticles in the dispersion was observed. These results indicated that control of the hydrolysis of organosilica precursors at a lower rate than the rate of co-condensation on the SN surface is crucial to obtain the core/shell structure while preventing the homogeneous nucleation of organosilica nanoparticles in the dispersion.
Analysis of porous structure
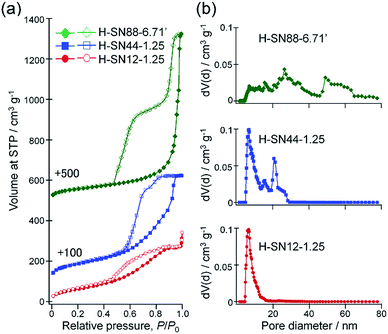
Fig. 8a compares the nitrogen adsorption–desorption isotherms of H-SN12-1.25, H-SN44-1.25, and H-SN88-6.71′. All samples showed large hysteresis loops, which are the characteristics of mesoporous materials. The pore volumes were significantly increased by enlargement of the internal hollow spaces as the total pore volumes at P/P0 = 0.99 for H-SN12-1.25, H-SN44-1.25, and H-SN88-6.71′ were 0.53, 0.81, and 1.28 cm3 g−1, respectively. The Brunauer–Emmett–Teller (BET) specific surface areas of the hollow organosilica nanoparticles were 230, 320 and 210 m2 g−1 for H-SN12-1.25, H-SN44-1.25, and HSN88-6.71′, respectively.The pore size distributions of the hollow nanoparticles were calculated from the isotherms by using the NLDFT method assuming nitrogen adsorption at −196 °C in cylinder silica pores (Fig. 8b). The pore sizes corresponding to the internal hollow spaces were observed at 5–17, 20–30, and 48–65 nm for H-SN12-1.25, H-SN44-1.25, and H-SN88-6.71′, respectively. The relatively broad distributions seen in a range of 6–20 nm for H-SN40-1.25 and 20–45 nm for HSN88-6.71′ can be ascribed to the interparticular voids of the hollow nanoparticles (vide infra).
The characteristic hysteresis loops with two-step desorption seen in H-SN44-1.25 and HSN88-6.71′ are classified as the hysteresis loops of type H5, according to the recent 2015 IUPAC Technical Report.51 The type H5 hysteresis is indicative of the presence of partially blocked and open pores, and can be considered as the combination of types H1 and H2 hysteresis. In the first desorption step at higher P/P0 can be attributed to the gas desorption from the open pores freely accessible without constriction (being the type H1 loop portion). On the other hand, the second desorption step at lower P/P0 can be assigned to the so-called pore blocking effect, which happens if the accessibility through the pores is restricted by the narrower mesopore necks or micropore channels (e.g., cage-like or ink-bottle pore), reflecting the type H2 loop portion.52,53
To further investigate the pore structures of the hollow organosilica nanoparticles, the hysteresis scanning analyses were performed on argon sorption at −186 °C for H-SN88-6.71′.54,55 In the hysteresis scanning, after measuring the full adsorption and desorption isotherms, the pores were partially re-filled until the relative pressure (P/P0) reached 0.98, and then argon gas was desorbed until the hysteresis loop was closed (at P/P0 of 0.40, in this case). Subsequently, the adsorption–desorption measurements were repeated to the maximum relative pressure of 0.97 for the segment 3, 0.96 for the segment 4, and 0.94 for the segment 5, while the desorption relative pressures were the same for all segments (at P/P0 of 0.40).
As shown in Fig. 9a, when the pores were partially filled at the relative pressure of 0.97 or less, only type H1 loops were seen, indicating that the open pores were filled (i.e., segments 3–5). When the maximum relative pressure was slightly increased to 0.98 (i.e., segment 2), the filled volumes sharply increased and the type H5 loop was observed, implying that the gas adsorption in the cage-like spaces started from the higher relative pressure. Comparison between the desorption branches of the segments 1 and 2 showed that the desorbed volumes of the first desorption step were almost identical whereas the desorbed amount of the second step in the segment 2 was slightly lower than that in the segment 1. These suggested that in both segments 1 and 2 the open pores were fully filled with gas amounts equal to the desorbed volumes of the first desorption step while the cage-like pores were partially filled in the segment 2. The hysteresis scanning measurements were also conducted for the core/shell nanoparticles before the removal of SN cores (i.e., CS-SN88-6.71′) (see Fig. 9b). All isotherms didn't have large hysteresis loops, confirming that the adsorption at higher pressure which arises the second desorption step comes from the hollow spaces. The isotherms show H1 loops, which can be attributed to the interparticular voids of core/shell nanoparticles.
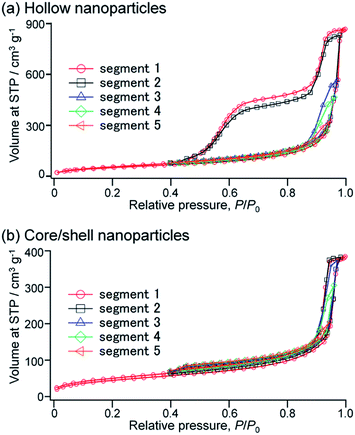 | ||
| Fig. 9 Hysteresis scanning isotherms performed on argon sorptions for (a) H-SN88-6.71′ and (b) CS-SN88-6.71′. | ||
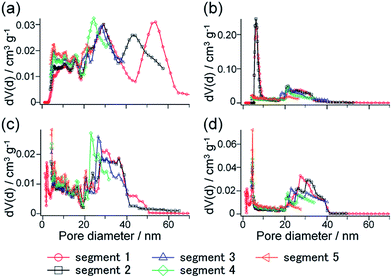
Fig. 10 shows the NLDFT pore size distributions calculated from each segment of the hysteresis scanning isotherms. Comparing the pore size distributions derived from the adsorption branches of H-SN88-6.71′ and CS-SN88-6.71′ (Fig. 10a and c), the broad distributions ranging from ca. 20 to 40 nm were observed for both samples, indicating that these pores were ascribed to the interparticular voids. In addition, these broad distributions were observed in all segments, again suggesting that the adsorption is first occurred in the interparticular voids – the open pores in this case. Larger pores of ca. 40–70 nm observed only in the segments 1 and 2 of H-SN88-6.71′ were ascribed to the hollow spaces, which are the cage-like pores filled at higher relative pressure.
The pore size distributions calculated from the desorption branches of H-SN88-6.71′ exhibited broad peaks at 18–40 nm in all segments and sharp peaks at 5–8 nm in the segments 1 and 2 (see Fig. 10b). The former broad distributions, which were always observed from both adsorption and desorption branches of the hollow and the core/shell nanoparticles, can be assigned to the interparticular voids. The latter sharp distribution can be attributed to the neck mesopores in the organosilica shells. As shown in Fig. S6 in the ESI,† the pore size distributions derived from the desorption branches of argon (at −186 °C) and nitrogen (at −196 °C) adsorption–desorption isotherms agreed well, confirming that the calculated pore size distributions represented the sizes of the mesopore in the shells and the cavitation phenomenon can be excluded.46 The pore model obtained from the sorption analyses is depicted in Fig. 11a, which corresponds well with the TEM observation shown in Fig. 11b.
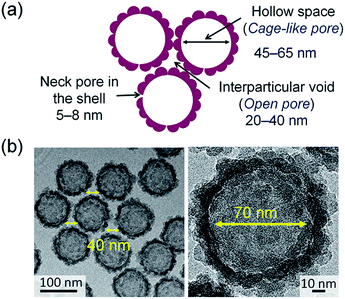 | ||
| Fig. 11 (a) Illustration of the pore model based on the adsorption–desorption analyses and (b) representative TEM images of the hollow organosilica nanoparticles. | ||
Diversification of organic moieties in the shell framework
Organosilica precursors with the bridged methylene group (bis(triethoxysilyl)methane, BTEM) and phenylene group (1,4-bis(triethoxysilyl)benzene, BTEB) were also employed as organosilica sources. Similar to the typical procedure for BTEE, an organosilica source (0.88 g) was added to the mixture of 40 nm SN dispersion (5 g) and deionized water (20 g) (i.e., 1.25 wt% silica). When BTEM was used as the organosilica source, the formation of tiny organosilica nanoparticles was observed together with the core/shell nanoparticles probably because the hydrolysis rate of BTEM is faster than that of BTEE (Fig. 12a). Therefore, the concentration of SNs was increased to 2.5 wt% (10 g of SNs dispersion and 15 g of deionized water). The successful shell formation was confirmed without separately formed tiny nanoparticles in the dispersion (Fig. 12b) and the hollow structure was then successfully obtained after the base treatment (Fig. 12c). In the case of BTEB, the hollow nanoparticles were successfully obtained without separately formed tiny nanoparticles in the dispersion at the SN concentrations of 1.25 wt% without any modification of the condition (Fig. 12d and e).Changes in FT-IR spectra upon the shell formation and the core removal were observed (see Fig. S7 in the ESI†). When BTEM was used as the oragnosilica source, the band around 2900 cm−1, attributed to C–H stretching, was observed for the hollow organosilica nanoparticles after the core removal, confirming the formation of organosilica shells. Note that this band was not clearly observed for the core/shell nanoparticles before the core removal probably due to the high amount of silica cores compared to the organosilica shells. In the case of BTEB-derived samples, a band arising from C–H stretching in aromatics appeared at 3060 cm−1, again suggesting the successful formation of organosilica shells.
For both BTEM and BTEB, granular surface morphology of the organosilica shell was observed and the monodispersity was remained throughout the preparation procedure, akin to the case using BTEE. It should be noted that although diversification of organic moieties in the shells of the hollow mesoporous organosilica nanoparticles (e.g., phenylene, ethylene and ethenylene groups) were reported previously, the particle sizes were larger than those reported here and surfactants were required to generate mesopores.56
Conclusions
Versatile syntheses of the hollow organosilica nanoparticles with controllable particle sizes and diversified organic moieties without using any surfactants were presented here for the first time. The diameters of hollow organosilica nanoparticles were easily tuned by changing the sizes of silica nanoparticle (SN) templates. The shell thickness can be controlled by altering the amount of organosilica source, although too small amount of organosilica source resulted in the partial collapse of the shell after the core removal. The organic moieties in the shell framework can be diversified by choosing different organosilica sources. In addition, elimination of the use of surfactants can offer many engineering advantages such as cost-saving and process simplicity.Surface-area density of the SN templates was defined as the external surface areas of the SN templates per the unit mass of the reactant dispersion. It was found that there was minimum surface-area density required to form the monodisperse core/shell nanoparticles without homogeneous nucleation of tiny organosilica nanoparticles in the dispersion. The results indicated that keeping hydrolysis rates of organosilica precursors slower than the co-condensation rates on the SN surfaces is crucial to achieve the characteristic core/shell structure without separately formed tiny organosilica nanoparticles. The adsorption–desorption isotherms of the hollow organosilica nanoparticles revealed type H5 hysteresis loops, representing the mixed pore systems composed of cage-like pores (hollow spaces) and open pores (interparticular voids between hollow organosilica nanoparticles). Hysteresis scanning measurements well revealed the pore structures of the hollow organosilica nanoparticles.
The hollow structure with the accessible shell is very beneficial for many applications such as antireflective coating, drug delivery and catalysis. For example, for antireflective coating in optical display devices, the hollow structure can provide low refractive index (n) because the interior space is filled with air, while the mesopores in the shell are, in the present work, small enough to prevent the infiltration of polymer matrix, used for the preparation of nanocomposite films, into the interior space.6,57 We are currently aiming to explore our materials for such applications and hope to report the results in near future.
Acknowledgements
We are grateful to Dr Matthias Thommes (Quantachrome Instruments) and Prof. Yukio Yamaguchi (The University of Tokyo) for fruitful discussion on the analyses of gas adsorption–desorption isotherms and for access to the dynamic light scattering instrument. A part of this work was conducted at the Center for Nano Lithography & Analysis at The University of Tokyo, which is supported by the Ministry of Education, Culture, Sports, Science and Technology (MEXT). N. K. thanks the Program for Leading Graduate Schools, “Global Leader Program for Social Design and Management (GSDM),” by MEXT for financial support.Notes and references
- K. C.-W. Wu and Y. Yamauchi, J. Mater. Chem., 2012, 22, 1251–1256 RSC.
- Y. Li and J. Shi, Adv. Mater., 2014, 26, 3176–3205 CrossRef CAS PubMed.
- V. E. Collier, N. C. Ellebracht, G. I. Lindy, E. G. Moschetta and C. W. Jones, ACS Catal., 2016, 6, 460–468 CrossRef CAS.
- Z. Li, J. C. Barnes, A. Bosoy, J. F. Stoddart and J. I. Zink, Chem. Soc. Rev., 2012, 41, 2590–2605 RSC.
- A. Popat, S. B. Hartono, F. Stahr, J. Liu, S. Z. Qiao and G. Q. Lu, Nanoscale, 2011, 3, 2801–2818 RSC.
- Y. Hoshikawa, H. Yabe, A. Nomura, T. Yamaki, A. Shimojima and T. Okubo, Chem. Mater., 2010, 22, 12–14 CrossRef CAS.
- L. Xu and J. He, Langmuir, 2012, 28, 7512–7518 CrossRef CAS PubMed.
- X. Fang, X. Zhao, W. Fang, C. Chen and N. Zheng, Nanoscale, 2013, 5, 2205–2218 RSC.
- Y. Si, M. Chen and L. Wu, Chem. Soc. Rev., 2016, 45, 690–714 RSC.
- L. Chen, X. She, T. Wang, L. He, S. Shigdar, W. Duan and L. Kong, Nanoscale, 2015, 7, 14080–14092 RSC.
- N. Jatupaiboon, Y. Wang, H. Wu, X. Song, Y. Song, J. Zhang, X. Ma and M. Tan, J. Mater. Chem. B, 2015, 3, 3130–3133 RSC.
- K. Watanabe, D. Nagao, H. Ishii and M. Konno, Langmuir, 2015, 31, 5306–5310 CrossRef CAS PubMed.
- Q. Yue, Y. Zhang, C. Wang, X. Wang, Z. Sun, X.-F. Hou, D. Zhao and Y. Deng, J. Mater. Chem. A, 2015, 3, 4586–4594 CAS.
- J. Liu, S. Z. Qiao, S. B. Hartono and G. Q. Lu, Angew. Chem., Int. Ed., 2010, 49, 4981–4985 CrossRef CAS PubMed.
- G. D. Moon and U. Jeong, Chem. Mater., 2008, 20, 3003–3007 CrossRef CAS.
- Y. Yang, X. Liu, X. Li, J. Zhao, S. Bai, J. Liu and Q. Yang, Angew. Chem., Int. Ed., 2012, 51, 9164–9168 CrossRef CAS PubMed.
- M. Xiao, C. Zhao, H. Chen, B. Yang and J. Wang, Adv. Funct. Mater., 2012, 22, 4526–4532 CrossRef CAS.
- J. G. Croissant, X. Cattoën, M. Wong Chi Man, J.-O. Durand and N. M. Khashab, Nanoscale, 2015, 7, 20318–20334 RSC.
- Y. Chen and J. Shi, Adv. Mater., 2016, 28, 3235–3272 CrossRef CAS PubMed.
- P. Yang, S. Gai and J. Lin, Chem. Soc. Rev., 2012, 41, 3679–3698 RSC.
- J. Gao, X. Zhang, Y. Lu, S. Liu and J. Liu, Chem.–Eur. J., 2015, 21, 7403–7407 CrossRef CAS PubMed.
- X. Zhang, Y. Zhao, S. Xu, Y. Yang, J. Liu, Y. Wei and Q. Yang, Nat. Commun., 2014, 5, 3170 Search PubMed.
- A. Zamboulis, N. Moitra, J. J. E. Moreau, X. Cattoën and M. Wong Chi Man, J. Mater. Chem., 2010, 20, 9322–9338 RSC.
- M. Wu, Y. Chen, L. Zhang, X. Li, X. Cai, Y. Du, L. Zhang and J. Shi, J. Mater. Chem. B, 2015, 3, 766–775 RSC.
- J. G. Croissant, Y. Fatieiev, H. Omar, D. H. Anjum, A. Gurinov, J. Lu, F. Tamanoi, J. I. Zink and N. M. Khashab, Chem.–Eur. J., 2016, 22, 9607–9615 CrossRef CAS PubMed.
- L. Maggini, I. Cabrera, A. Ruiz-Carretero, E. A. Prasetyanto, E. Robinet and L. D. Cola, Nanoscale, 2016, 8, 7240–7247 RSC.
- Y. Fatieiev, J. G. Croissant, K. Julfakyan, L. Deng, D. H. Anjum, A. Gurinov and N. M. Khashab, Nanoscale, 2015, 7, 15046–15050 RSC.
- N. Mizoshita and S. Inagaki, Angew. Chem., Int. Ed., 2015, 54, 11999–12003 CrossRef CAS PubMed.
- S.-H. Wu, C.-Y. Mou and H.-P. Lin, Chem. Soc. Rev., 2013, 42, 3862–3875 RSC.
- H. Djojoputro, X. F. Zhou, S. Z. Qiao, L. Z. Wang, C. Z. Yu and G. Q. Lu, J. Am. Chem. Soc., 2006, 128, 6320–6321 CrossRef CAS PubMed.
- J. Liu, Q. Yang, L. Zhang, H. Yang, J. Gao and C. Li, Chem. Mater., 2008, 20, 4268–4275 CAS.
- J. Liu, S. Bai, H. Zhong, C. Li and Q. Yang, J. Phys. Chem. C, 2010, 114, 953–961 CAS.
- M. Mandal and M. Kruk, Chem. Mater., 2012, 24, 123–132 CrossRef CAS.
- M. Sasidharan, K. Nakashima, N. Gunawardhana, T. Yokoi, I. Ito, M. Inoue, S.-I. Yusa, M. Yoshio and T. Tatsumi, Nanoscale, 2011, 3, 4768–4773 RSC.
- A. S. Manchanda and M. Kruk, Langmuir, 2016, 32, 900–908 CrossRef CAS PubMed.
- M. E. Davis, Z. G. Chen and D. M. Shin, Nat. Rev. Drug Discovery, 2008, 7, 771–782 CrossRef CAS PubMed.
- T. Ikuno, A. Nomura, K. Iyoki, A. Sugawara-Narutaki, T. Okubo and A. Shimojima, Chem. Lett., 2013, 42, 316–317 CrossRef CAS.
- Y. Wang, X. Su, P. Ding, S. Lu and H. Yu, Langmuir, 2013, 29, 11575–11581 CrossRef CAS PubMed.
- W. Guo, J. Wang, S.-J. Lee, F. Dong, S. S. Park and C.-S. Ha, Chem.–Eur. J., 2010, 16, 8641–8646 CrossRef CAS PubMed.
- J. Y. Shi, C. A. Wang, Z. J. Li, Q. Wang, Y. Zhang and W. Wang, Chem.–Eur. J., 2011, 17, 6206–6213 CrossRef CAS PubMed.
- N. Koike, T. Ikuno, T. Okubo and A. Shimojima, Chem. Commun., 2013, 49, 4998–5000 RSC.
- C. Urata, H. Yamada, R. Wakabayashi, Y. Aoyama, S. Hirosawa, S. Arai, S. Takeoka, Y. Yamauchi and K. Kuroda, J. Am. Chem. Soc., 2011, 133, 8102–8105 CrossRef CAS PubMed.
- H. Ujiie, A. Shimojima and K. Kuroda, Chem. Commun., 2015, 51, 3211–3214 RSC.
- Y. Chen, P. Xu, H. Chen, Y. Li, W. Bu, Z. Shu, Y. Li, J. Zhang, L. Zhang, L. Pan, X. Cui, Z. Hua, J. Wang, L. Zhang and J. Shi, Adv. Mater., 2013, 25, 3100–3105 CrossRef CAS PubMed.
- H. Zou, R. Wang, X. Li, X. Wang, S. Zeng, S. Ding, L. Li, Z. Zhang and S. Qiu, J. Mater. Chem. A, 2014, 2, 12403–12412 CAS.
- M. Thommes and K. A. Cychosz, Adsorption, 2014, 20, 233–250 CrossRef CAS.
- T. Yokoi, Y. Sakamoto, O. Terasaki, Y. Kubota, T. Okubo and T. Tatsumi, J. Am. Chem. Soc., 2006, 128, 13664–13665 CrossRef CAS PubMed.
- R. Watanabe, T. Yokoi, E. Kobayashi, Y. Otsuka, A. Shimojima, T. Okubo and T. Tatsumi, J. Colloid Interface Sci., 2011, 360, 1–7 CrossRef CAS PubMed.
- T. Yokoi, J. Wakabayashi, Y. Otsuka, W. Fan, M. Iwama, R. Watanabe, K. Aramaki, A. Shimojima, T. Tatsumi and T. Okubo, Chem. Mater., 2009, 21, 3719–3729 CrossRef CAS.
- V. K. Lamer and R. H. Dinegar, J. Am. Chem. Soc., 1950, 72, 4847–4854 CrossRef CAS.
- M. Thommes, K. Kaneko, A. V. Neimark, J. P. Olivier, F. Rodriguez-Reinoso, J. Rouquerol and K. S. W. Sing, Pure Appl. Chem., 2015, 87, 1051–1069 CrossRef CAS.
- J. Garcia-Martinez, C. Xiao, K. A. Cychosz, K. Li, W. Wan, X. Zou and M. Thommes, ChemCatChem, 2014, 6, 3110–3115 CrossRef CAS.
- P. Van Der Voort, P. I. Ravikovitch, K. P. De Jong, M. Benjelloun, E. Van Bavel, A. H. Janssen, A. V. Neimark, B. M. Weckhuysen and E. F. Vansant, J. Phys. Chem. B, 2002, 106, 5873–5877 CrossRef CAS.
- K. A. Cychosz, X. Guo, W. Fan, R. Cimino, G. Y. Gor, M. Tsapatsis, A. V. Neimark and M. Thommes, Langmuir, 2012, 28, 12647–12654 CrossRef CAS PubMed.
- R. Cimino, K. A. Cychosz, M. Thommes and A. V. Neimark, Colloids Surf., A, 2013, 437, 76–89 CrossRef CAS.
- Y. Chen, P. Xu, H. Chen, Y. Li, W. Bu, Z. Shu, Y. Li, J. Zhang, L. Zhang, L. Pan, X. Cui, Z. Hua, J. Wang, L. Zhang and J. Shi, Adv. Mater., 2013, 25, 3100–3105 CrossRef CAS PubMed.
- P. Buskens, M. Burghoorn, M. C. D. Mourad and Z. Vroon, Langmuir, 2016, 32, 6781–6793 CrossRef CAS PubMed.
Footnotes |
| † Electronic supplementary information (ESI) available: Synthesis procedures for the SN templates, additional FE-SEM images of the SN templates, solid-state 29Si MAS NMR and FT-IR spectra of CS-SN44-1.25 and H-SN44-1.25, dynamic light scattering results, additional FE-SEM and TEM images of the hollow nanoparticles, and comparisons between argon and nitrogen sorption isotherms. See DOI: 10.1039/c6ra22926c |
| ‡ Present address: Department of Applied Chemistry, Waseda University, 3-4-1 Ohkubo, Shinjuku-ku, Tokyo 169-8555, Japan. |
| This journal is © The Royal Society of Chemistry 2016 |

