DOI:
10.1039/C6RA16804C
(Paper)
RSC Adv., 2016,
6, 90446-90454
Promising biomass-derived activated carbon and gold nanoparticle nanocomposites as a novel electrode material for electrochemical detection of rutin
Received
29th June 2016
, Accepted 16th September 2016
First published on 16th September 2016
Abstract
In this paper, six types of typical bio-wastes are used to prepare activated carbons (ACs) by high-temperature carbonization and activation with KOH. A novel electrochemical sensor for rutin was developed based on a peanut shell-derived activated carbon and gold nanoparticle composite modified glassy carbon electrode (P-AC/AuNPs/GCE). The as-synthesized ACs and composites were characterized by a variety of physicochemical techniques. The proposed sensor exhibits ideal electrochemical behavior for rutin with a wide linear range, low detection limit, and good selectivity. The desirable electrochemical performance enables the biomass-derived ACs and their composites to act as new sources of carbonaceous materials for electrochemical sensors.
1. Introduction
In recent decades, biomass-derived porous carbon materials are considered promising candidates to construct environment-friendly energy storage devices and ultrahigh performance sensors.1–6 The preparation of activated carbons (ACs) from bio-wastes is simple, eco-friendly, and cost-effective. In evidence, ACs prepared from various bio-wastes have been widely used in numerous applications, owing to its unique properties, such as ultra high surface area, modulated pore size, low toxicity, excellent chemical stability, electrical conductivity, and the presence of oxygen surface functional groups like heteroatoms.1–10 Nonetheless, the availability of literature reports on biomass-derived ACs for electrochemical sensor applications is scarce. Moreover, bio-wastes are renewable, abundant, and easily available, and there is no report available on the electrochemical performances of ACs and thier nanocomposites in sensing applications.
Rutin (3′,4′,5,7-tetrahydroxy-flavone-3-rutinoside), the glycoside between the flavonol quercetin and the disaccharide rutinose, is a common dietary flavonoid that is widely consumed from plant-derived beverages and foods as traditional and folkloric medicine worldwide.11,12 Rutin is believed to exhibit significant biological and pharmacological activities, including anti-oxidation, anti-inflammation, anti-diabetic, anti-adipogenic, neuroprotective, and hormone therapy.13–15 Rutin has been isolated from plants and used clinically as therapeutic medicine to reduce capillary permeability, alleviate pain, and lower blood pressure.16–18 Therefore, establishment of highly sensitive analytical techniques for the determination of rutin is of great significance in foods, clinics, and pharmaceuticals. Electrochemical method is an attractive alternative to traditional analytical techniques such as high-performance liquid chromatography,19 capillary electrophoresis,20 chemiluminescence,21 spectrophotometry22 and flow injection analysis23 for determination of rutin, because it features high sensitivity and selectivity, instrument simplicity, fast response, low cost, feasibility of miniaturization, and ease of use. Due to the presence of phenolic hydroxyl groups in rutin structure, rutin is an electroactive compound, which can be detected by electrochemical methods.24–26
In this work, we choose six types of typical bio-wastes, including peanut shell (P), bagasse (B), corncob powder (C), straw powder (S), grapefruit skin (G), and walnut shell (W), as the precursors to prepare ACs by high-temperature carbonization and activation with KOH. Activation by KOH is a well-known method for preparing activated carbons which presents several advantages compared to the other methods, such as lower temperature for pyrolysis, higher yield and high surface area, and well-developed microporous structure. Therefore, KOH activation is selected to increase surface area and improve electrochemical performance of activated carbon materials. The electrochemical properties of as-made ACs were estimated by cyclic voltammetry. Among them, peanut shell-derived activated carbon (P-AC) exhibits excellent electrochemical performance and is selected as a model to prepare electrochemical sensor with gold nanoparticles.27 The P-AC and gold nanoparticles composite modified glassy carbon electrode show excellent sensitivity and selectivity, reproducibility, and long-term stability for the determination of rutin.
2. Experimental
2.1. Materials and apparatus
Peanut shell (P), bagasse (B), corncob powder (C), straw powder (S), grapefruit skin (G), and walnut shell (W) were purchased from a local supermarket and then air-dried at room temperature. Rutin was obtained from Sigma-Aldrich. Chloroauric acid (HAuCl4·4H2O) was purchased from Sinopharm Chemical Reagent Co., Ltd. (Shanghai, China). All other chemicals were of analytical reagent grade and were used as received without further purification. Ultrapure water (≥18 MΩ cm) was used throughout the experiments.
The electrochemical measurements were performed on a CHI660D electrochemical workstation (Shanghai, China). The morphology and microstructure of the obtained products were investigated using a field emission scanning electron microscope (FEI Nova NanoSEM 450) with an attached energy-dispersive X-ray spectrometer (EDS). Crystallite structures were determined by a powder X-ray diffraction (D8 Advance, Bruker, Germany) equipped with graphite monochromatized Cu Kα radiation (λ = 0.15406 nm) operating at 40 kV and 40 mA from 10° to 70°. The chemical compositions of the six ACs samples were analyzed by Fourier transform infrared (FT-IR) spectra using a Nicolet IS10 spectrometer. The content of cellulose and lignin was determined by STA449F3 (NETZSCH). Nitrogen adsorption–desorption isotherm measurements were performed on a Micrometitics Gemini VII 2390 volumetric adsorption analyzer at 77 K. The Brunauer–Emmett–Teller (BET) method was utilized to calculate the specific surface area of each sample and the pore size distribution was derived from the adsorption branch of the corresponding isotherm using the Barrett–Joyner–Halenda (BJH) method. The total pore volume was estimated from the amount adsorbed at a relative pressure of P/P0 = 0.99.
2.2. Preparation of activated carbon
The ACs were prepared by using a general and simple KOH activation method. The sun-dried six biological wastes were washed and then dried in an oven at 100 °C. The pulverized wastes were pyrolyzed at 600 °C for 2 h in a muffle furnace to obtain carbonated products (denoted as X–C, X is corresponding to the P, B, C, S, G, and W). KOH activation of the X–C was as follows: briefly, desired amount of X–C was impregnated using KOH aqueous solution (the mass ratio of KOH/X–C was 3), followed by an evaporation process at 80 °C under vacuum atmosphere. The dried KOH/X–C mixture was heated at 800 °C for 1 h in the muffle furnace. After being cooled down to room temperature, the products were washed with 1 M HCl and ultra-pure water until the pH became neutral. Subsequently, as-obtained ACs (denoted as X-AC) were filtered, washed with ultra-pure water, and dried at 80 °C in ambient for 10 h to remove the moisture and thoroughly ground to yield the finest carbon powder.
2.3. Preparation of AuNPs
The gold nanoparticles (AuNPs) stabilized with citrate were prepared according to the procedure reported previously.28,29 Briefly, 100 mL of 0.01% HAuCl4 was heated to reflux while stirring. Rapid addition of 3 mL of 1% sodium citrate to the vortex of the solution resulted in a change in solution color from pale yellow to wine red. After the color change, the solution was refluxed for an additional 15 min, and allowed to cool to room temperature. The obtained AuNPs solution was stored at 4 °C in a dark.
2.4. Preparation of the P-AC/AuNPs/GCE
Prior to the electrode modification, the glassy carbon electrodes (GCE, 3 mm in diameter) were first treated with piranha solution (1 H2O2
:
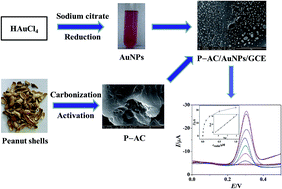
3 H2SO4, v/v) for 1 h, then polished with 0.3 and 0.05 μm alumina slurries, and finally ultrasonically cleaned by ultrapure water, ethanol, and ultrapure water for 2 min, respectively. The electrode was allowed to dry in air. The modified electrodes were prepared by a simple casting method. Typically, an aliquot of 8 μL P-AC suspension (1 mg mL−1) was dropped onto the GCE and dried under an infrared heat lamp. And then 8 μL of AuNPs solution was applied to the surface of P-AC/GCE, left to dry in air (denoted as P-AC/AuNPs/GCE). As a control, P-AC/GCE and AuNPs/GCE were also produced in similar fashion. Scheme 1 shows the schematic illustration for the fabrication of P-AC and AuNPs composite modified GCE.
 |
| Scheme 1 Schematic illustration for the fabrication of P-AC/AuNPs composite modified GCE. | |
2.5. Electrochemical measurement
All electrochemical measurements including cyclic voltammetry (CV) and differential pulse voltammetry (DPV) were carried out on a CHI660D electrochemical workstation. A standard three electrode cell was used for all electrochemical experiments with bare and modified GCE as working electrode, a platinum (Pt) wire as an auxiliary electrode, and an Ag/AgCl as a reference electrode, respectively. CV was performed in 0.1 M pH 6.0 PBS solution containing a certain amount of rutin within a potential range from −0.2 to 0.6 V at a scan rate of 0.1 V s−1. DPV was carried out in 0.1 M PBS (pH 6.0) from 0 to 0.6 V with a pulse amplitude of 4 mV and a pulse width of 0.1 s. All experiments were performed at room temperature.
3. Results and discussion
3.1. Structure and morphology of the six types X-ACs
Six types of typical bio-wastes, including peanut shell (P), bagasse (B), corncob powder (C), straw powder (S), grapefruit skin (G), and walnut shell (W), were selected as the precursors to prepare ACs by pyrolyzing at 600 °C and KOH activation at 800 °C, respectively. KOH activation has been widely used to increase surface area and improve electrochemical performance of various carbon materials.30,31 Fig. 1 shows the FE-SEM images of the surface morphologies of the as-prepared X-ACs. It can be seen that, on the six types of particle surfaces, the number of the macropores is few, indicating the nano-scale pores are dominant in the six samples. Among them, as seen from Fig. 1, the P-AC sample shows smooth morphology and uniform distribution of pore size.
 |
| Fig. 1 FE-SEM images of ACs derived from peanut shell (P), bagasse (B), corncob powder (C), straw powder (S), grapefruit skin (G), and walnut shell (W). | |
The structure of the as-prepared X-ACs was further investigated by XRD, FT-IR, and TGA analysis. Fig. 2A shows the XRD patterns of the as-prepared X-ACs. All XRD patterns of X-ACs show two broadened diffraction peaks centered at 23° and 43°, corresponding to the (002) and (100) diffractions of graphitic carbon with the amorphous character. Comparison with other five as-prepared X-ACs indicates that the (002) peak of P-AC is almost disappeared and (100) peak has a markedly increased intensity and is dramatically broadened, indicating the presence of a high density of pores.32 This result is consistent with the observation from FE-SEM. Fig. 2B shows FT-IR spectra of the as-prepared X-ACs. It is clear seen that all spectra are very similar. A broad band of O–H stretching vibration presents at around 3413 cm−1, and bands at 1653, 1441 and 1062 cm−1 are corresponded to COO− anion stretching, C
C vibrations in aromatic rings and C–O stretching of ester.2,33 These oxygen-containing functional groups, in the porous surfaces of carbon materials can make effects on the electrochemical performance. Thermogravimetric analysis (TGA) curves of the as-prepared six types X-ACs are shown in Fig. 2C. It can be seen that X-ACs degraded in two steps. The steps correspond to desorption of adsorbed-water at lower temperatures and in a narrow range of temperatures (<200 °C), and dehydration and decarboxylation at higher temperatures and in a wider range of temperatures. The major decomposition process occurs between 400 and 600 °C with a weight loss of approximately 60 wt% by means of two consecutive steps.
 |
| Fig. 2 (A) XRD patterns, (B) FT-IR spectra, and (C) TGA curves of the six types of X-ACs. | |
Fig. 3A exhibits the typical N2 adsorption–desorption isotherms of six types of X-ACs. The type IV nitrogen sorption isotherms for the samples suggest the existence of different pore sizes from micro-, meso- and macro-pores. Major adsorption of the samples occurs at a low relative pressure of less than 0.2, giving rise to an almost horizontal plateau at higher relative pressures. This result can be demonstrated by the pore size distribution calculated from the BJH method, as shown in Fig. 3B. Table 1 summarizes the specific surface area (SSA), pore volume and average pore size of six types of X-ACs. Among them, the P-AC sample shows the highest SSA, the largest pore volume and the smallest pore diameter, which allows the strong adsorption of the target molecular and leads to improved sensitivity.
 |
| Fig. 3 (A) Nitrogen adsorption–desorption isotherms and (B) pore size distributions for the six types of X-ACx. | |
Table 1 BET measurements for six types of X-ACs
Samples |
BET Surface area (m2 g−1) |
Pore volume (cm3 g−1) |
BJH pore size (nm) |
P-AC |
2484 |
1.31 |
2.68 |
W-AC |
1196 |
0.58 |
3.00 |
B-AC |
1063 |
0.54 |
2.88 |
G-AC |
863 |
0.47 |
2.91 |
C-AC |
426 |
0.37 |
4.42 |
S-AC |
350 |
0.91 |
18.06 |
3.2. Electrochemical performances of the six types X-ACs
Fig. 4 shows CV curves of the as-prepared six types X-ACs modified GCE in 0.1 M PBS (pH 6.0) in the presence of 1 μM rutin at a scan rate of 50 mV s−1. Interestingly, the remarkable redox peaks were all observed for six types of X-ACs modified GCE. The existence of redox peaks is due to the large number of oxygen-containing functional groups on the X-ACs surfaces, which plays a key role in electrochemical activity of X-ACs. This result indicates that the electrochemical performance of the X-ACs is remarkably enhanced owing to the KOH activation and oxygen-containing functional groups (such as carboxyl, hydroxyl, and quinone groups) present on the surface of X-ACs, which are typical for activated carbon materials.2 Moreover, compared with the X-ACs modified electrodes, P-AC/GCE exhibits much larger redox current for 1 μM rutin. Therefore, P-AC was selected as a model to construct the electrochemical sensor for the determination of rutin in this study.
 |
| Fig. 4 CVs obtained at six types of X-ACs modified GCE in 0.1 M PBS (pH 6.0) in the presence of 1 μM rutin at the scan rate of 50 mV s−1. | |
3.3. Electrochemical behavior of rutin on P-AC/AuNPs/GCE
The P-AC/AuNPs nanocomposite was prepared by mixing of P-AC and AuNPs solutions. Scheme 1 displays the schematic illustration for the formation of AuNPs on the surfaces of P-AC. Fig. 5 shows the FE-SEM image of P-AC/AuNPs nanocomposite. It can be seen that AuNPs were well-dispersed in the worm-like mesoporous structure of P-AC. AuNPs are not agglomerated and well-ordered on the carbon support. Here, we note that the size of AuNPs on the surface is not homogeneous and some particles are located inside the carbon material.
 |
| Fig. 5 FE-SEM image of P-AC/AuNPs nanocomposite. | |
Electrochemical behaviors of different modified electrodes were further investigated by cyclic voltammetry to evaluate the electrochemical performances of the modified electrodes. CV responses on different modified electrodes were recorded in 5.0 mM K3[Fe(CN)6] containing 0.1 M KCl and 0.1 M pH 6.0 PBS in the presence of 1 μM rutin, respectively. As shown in Fig. 6, on all the electrodes, a pair of redox peaks appeared, which indicated that the electrochemical reaction of rutin was realized. Rutin is an electroactive compound with four hydroxyl groups present in its molecular structure. The electrochemical reaction mechanism has been reported as a two-electron and two-proton redox process.34,35 On bare GCE, a pair of peaks appeared with the smallest redox peak currents. On AuNPs/GCE and P-AC/GCE, the redox peak currents increased, indicating that the electrochemical reaction of rutin could efficiently carried out due to the excellent conductivity, big porous structure, rapid electron transfer, and large surface area of AuNPs and P-AC. On P-AC/AuNPs/GCE, a pair of well-defined redox peak was observed with remarkable increase of peak currents, which could be attributed to synergistic effect between the as-synthesized P-AC and AuNPs. The results revealed that the P-AC/AuNPs on the electrode surface could act as an effective mediator to promote the electrochemical reaction of rutin, which could be a platform for sensitive detection of rutin.
 |
| Fig. 6 (A) CVs of different modified electrodes in 5.0 mM K3[Fe(CN)6] containing 0.1 M KCl and (B) CVs of different electrodes in 0.1 M PBS (pH 6.0) in the presence of 1 μM rutin at the scan rate of 50 mV s−1. | |
Fig. 7 displays the CVs of 1.0 μM rutin on the P-AC/AuNPs/GCE at different scan rates. It was found that the redox peak currents (Ip) increased gradually along with the scan rate from 50 to 500 mV s−1. The relationship of Ip with scan rate (v) was calculated with two linear regression equations as Ipa (μA) = −147.69v (V s−1) − 0.36 (R = 0.9904) and Ipc (μA) = 150.84v (V s−1) − 0.03 (R = 0.9911), which indicated a surface-controlled electrode process.
 |
| Fig. 7 (A) CVs of the P-AC/AuNPs/GCE in 0.1 M PBS (pH = 6.0) in the presence of 1 μM rutin at different scan rates from 0.01 to 0.50 V s−1. (B) The plot of the redox peak current (Ip) versus scan rate. | |
The influence of buffer pH on the CV peak current of 1 μM rutin was investigated in the pH range from 5.0 to 9.0 as shown in Fig. 8A. It can be seen that the maximum value of Ip appeared at the pH value of 6.0 and then decreased with the further increase of buffer pH, indicating the participating of proton in the electrode reaction. In the acidic buffer solution, more protons can be provided, which is benefit for the electrochemical reaction of rutin. Therefore, pH 6.0 was selected as the optimal pH for detection of rutin in this study. Fig. 8B shows the loading amount ratio of P-AC and AuNPs solution on the Ip in the range from 3
:
1 to 1
:
3. The maximum peak current appeared at loading amount ratio of 1
:
1 of P-AC/AuNPs volume ratio. Therefore, the loading amount of P-AC suspension (1 mg mL−1) and as-synthesized AuNPs solution was equal of 8 μL for sensor fabrication in this work.
 |
| Fig. 8 Effects of buffer pH value (A) and loading amount ratio of P-AC and AuNPs solution (B) on the amperometric response of the P-AC/AuNPs/GCE in 0.1 M PBS. | |
3.4. Calibration curve
Differential pulse voltammetry (DPV) was used for the determination of rutin on the obtained electrochemical sensor due to its high sensitivity and selectivity. Under the optimal conditions, the oxidation peak current of rutin was proportional to its concentration in the range from 5.0 nM to 1.0 μM (Fig. 9A). The inset of Fig. 9B shows the corresponding calibration plots of the peak current vs. rutin concentration. The linear regression equation was calculated as Ipa (μA) = 9.06
log
c (M) + 75.50 (R = 0.9985), with a sensitivity of 128.24 μA M−1 cm−2. The limit of detection (LOD) was found to be 2.0 nM and the limit of quantitation (LOQ) was found to be 6.7 nM which produce at the signal to noise ratio of 3 (S/N = 3) and 10 (S/N = 10), respectively, with the RSD of detected results to be 3.5%. The comparison of the analytical performance of P-AC/AuNPs/GCE with other electrochemical methods for rutin determination was summarized and listed in Table 2. It can be seen that the P-AC/AuNPs/GCE exhibited a comparable linear range and the detection limit due to the synergistic effect of P-AC and AuNPs. Furthermore, rutin can be effectively separated from its metabolite, which leads to a great potential application of the proposed method for biological and clinical analyses.
 |
| Fig. 9 (A) DPVs of rutin on P-AC/AuNPs/GCE in 0.1 M PBS (pH 6.0) with increasing concentration (from a to i): 0, 5 × 10⁻⁹, 1 × 10⁻⁸, 2 × 10⁻⁸, 5 × 10⁻⁸, 1 × 10⁻⁷, 2 × 10⁻⁷, 5 × 10⁻⁷ and 1 × 10⁻⁶ M. (B) The relationship of Ipa with the rutin concentration. The inset is the corresponding calibration plot of the Ipa vs. rutin concentration. | |
Table 2 Comparison of performance of electrochemical methods for the determination of rutin by using different modified electrodes
Electrode |
Linear range |
Detection limit |
Ref. |
Nitrogen-doped graphene/carbon ionic liquid electrode. Yttrium hexacyanoferrate nanoparticles/chemically reduced graphene oxide/carbon paste electrode. Poly(acridine orange)/graphene/carbon ionic liquid paste electrode. Graphene nanosheets. Activated silica gel/graphene. Poly(3,4-ethylenedioxythiophene)/graphene oxide. β-Cyclodextrin-gold@3,4,9,10-perylene tetracarboxylic acid functionalized single-walled carbon nanohorns. Platinum nanoparticle/reduced graphene oxide. |
NG/CILEa |
0.7 nM to 0.1 μM |
0.23 nM |
36 |
YHCFNPs/CRGO/CPEb |
2 nM to 4 μM |
0.82 nM |
35 |
PAO-GR/CILPEc |
30 nM to 800 μM |
8.3 nM |
37 |
GSd/GCE |
10 nM to 1.25 μM |
3.2 nM |
38 |
ASiG/Ge/GCE |
1 nM to 1.2 μM |
3.3 nM |
39 |
PEDOT/GOf/GCE |
4 nM to 60 μM |
1.25 nM |
40 |
β-CD-Au@PTCA-SWCNHsg/GCE |
10 nM to 10 μM |
4.4 nM |
41 |
PtNP/rGOh/GCE |
50 nM to 10 μM |
10 nM |
42 |
P-AC/AuNPs/GCE |
5 nM to 1 μM |
2 nM |
This work |
3.5. Stability, reproducibility and interference studies
The stability and reproducibility of the P-AC/AuNPs/GCE were investigated by the measurement of the response to 1.0 μM rutin. The relative standard deviation (RSD) of the oxidation peak current by 5 successive measurements was 1.9%. The fabrication reproducibility was estimated by using 6 modified electrodes that were prepared under the same conditions, and the RSD was 3.6%. When the electrodes were kept at room temperature for 2 week, the peak currents remained more than 94.8% of their initial values.
Under the optimal conditions, the interference study was performed by immersing the P-AC/AuNPs/GCE into a fixed amount of 1.0 μM rutin mixed with potential foreign species by DPV at room temperature as shown in Fig. 10. The results demonstrated that 10-fold of citric acid (CA), Mg2+, Na+, K+, Ca2+, Cl−, and glucose had no significant interference on the peak current of rutin according to the relative error <±5%, indicating the excellent selectivity of P-AC/AuNPs/GCE for rutin detection.
 |
| Fig. 10 Selectivity of P-AC/AuNPs/GCE. | |
3.6. Analysis of real samples
In order to evaluate the practicability of the proposed method, the compound rutin tablet samples were detected using the electrochemical sensor. The drug tablets were ground and dissolved in ethanol to obtain a stock solution. In order to fit into the linear range of the proposed method, moderate amount of the stock solution was diluted with 0.1 M PBS (pH 6.0). The dilution process can actually reduce the matrix effect in real samples. Table 3 shows the determination results and the recovery was calculated by the standard addition method to evaluate the accuracy of the sensor. It can be seen that the results were satisfactory with the recovery in the range of 97.3–104.0%, suggesting that this method could be efficiently applied to rutin detection with good accuracy. So the proposed method is suitable for the determination of rutin in commercial pharmaceutical samples high sensitivity and precision.
Table 3 Determination results of rutin in compound rutin tablets (n = 3)
Sample |
Added (μM) |
Found (μM) |
Recovery (%) |
RSD (%) |
1 |
0 |
0.05 ± 0.01 |
— |
— |
2 |
2 |
2.00 ± 0.01 |
97.3 ± 0.2 |
2.96 |
3 |
4 |
3.91 ± 0.02 |
96.5 ± 0.3 |
4.13 |
4 |
6 |
6.27 ± 0.03 |
104.0 ± 0.3 |
4.52 |
4. Conclusions
In summary, six types of biomass-derived ACs were synthesized through high-temperature carbonization followed by KOH activation method. The as-prepared ACs showed a noteworthy performance for the reported electrochemical sensor. The P-AC outperforms the other X-AC modified electrodes and AuNPs with excellent catalytic activities for the detection of rutin. The achieved electrochemical performance may be ascribed to the catalytic activity of the AuNPs with a strong substrate of high surface area P-AC materials. Notably, the reported sensor provides a remarkable performance in compound rutin tablet samples. In addition, the results possibly enable these ACs to act as a new biomass source of carbonaceous materials for high-performance electrochemical sensors.
Acknowledgements
The authors gratefully acknowledge the financial support from the National Natural Science Foundation of China (21565031, 21463028, and 21665027), YMU-DEAKIN International Associated Laboratory on Functional Materials, and partially supported by the open funding project of the State Key Laboratory of Chemo/Biosensing and Chemometrics (2013014), Hunan University, PR China.
References
- S. De, A. M. Balu, J. C. van der Waal and R. Luque, ChemCatChem, 2015, 7, 1608–1629 CrossRef CAS.
- C. Peng, X. B. Yan, R. T. Wang, J. W. Lang, Y. J. Ou and Q. J. Xue, Electrochim. Acta, 2013, 87, 401–408 CrossRef CAS.
- R. Madhu, V. Veeramani, S. M. Chen, A. Manikandan, A. Y. Lo and Y. L. Chueh, ACS Appl. Mater. Interfaces, 2015, 7, 15812–15820 CAS.
- R. Madhu, K. V. Sankar, S. M. Chen and R. K. Selvan, RSC Adv., 2014, 4, 1225–1233 RSC.
- V. Veeramani, R. Madhu, S. M. Chen, B. S. Lou, J. Palanisamy and V. S. Vasantha, Sci. Rep., 2015, 5, 10141 CrossRef PubMed.
- R. Madhu, V. Veeramani and S. M. Chen, Sci. Rep., 2014, 4, 4679 CrossRef PubMed.
- M. Sevilla and A. B. Fuertes, ACS Nano, 2014, 8, 5069–5078 CrossRef CAS PubMed.
- M. Sevilla and R. Mokaya, Energy Environ. Sci., 2014, 7, 1250–1280 CAS.
- D. B. Wang, Z. Geng, B. Li and C. M. Zhang, Electrochim. Acta, 2015, 173, 377–384 CrossRef CAS.
- R. Madhu, C. Karuppiah, S. M. Chen, P. Veerakumar and S. B. Liu, Anal. Methods, 2014, 6, 5274–5280 RSC.
- J. V. Formica and W. Regelson, Food Chem. Toxicol., 1995, 33, 1061–1080 CrossRef CAS PubMed.
- L. S. Chua, J. Ethnopharmacol., 2013, 150, 805–817 CrossRef CAS PubMed.
- R. Guo and P. Wei, Microchim. Acta, 2008, 161, 233–239 CrossRef CAS.
- R. M. Gené, C. Cartañá, T. Adzet, E. Marín, T. Parella and S. Cañigueral, Planta Med., 1996, 62, 232–235 CrossRef.
- S. Y. Park, S. H. Bok, S. M. Jeon, Y. B. Park, S. J. Lee, T. S. Jeong and M. S. Choi, Nutr. Res., 2002, 22, 283–295 CrossRef CAS.
- C. P. Yu, P. P. Wu, Y. C. Hou, S. P. Lin, S. Y. Tsai, C. T. Chen and P. D. L. Chao, J. Agric. Food Chem., 2011, 59, 4644–4648 CrossRef CAS PubMed.
- S. Moghbelinejad, M. Nassiri-Asl, T. N. Farivar, E. Abbasi, M. Sheikhi, M. Taghiloo, F. Farsad, A. Samimi and F. Hajiali, Toxicol. Lett., 2014, 1, 108–113 CrossRef PubMed.
- S. Pashikanti, D. R. de Alba, G. A. Boissonneault and D. Cervantes-Laurean, Free Radical Biol. Med., 2010, 3, 656–663 CrossRef PubMed.
- K. Ishii, T. Furuta and Y. Kasuya, J. Chromatogr. B: Biomed. Sci. Appl., 2001, 759, 161–168 CrossRef CAS.
- Q. J. Wang, F. Ding, H. Li, P. G. He and Y. Z. Fang, J. Pharm. Biomed. Anal., 2003, 30, 1507–1514 CrossRef CAS PubMed.
- Z. H. Song and L. Wang, J. Agric. Food Chem., 2001, 49, 5697–5701 CrossRef CAS PubMed.
- H. Xu, Y. Li, H. W. Tang, C. M. Liu and Q. S. Wu, Anal. Lett., 2010, 43, 893–904 CrossRef CAS.
- Z. Legnerová, D. Šatínský and P. Solich, Anal. Chim. Acta, 2003, 497, 165–174 CrossRef.
- J. W. Kang, X. Q. Lu, H. J. Zeng, H. D. Liu and B. Q. Lu, Anal. Lett., 2002, 35, 677–686 CrossRef CAS.
- J. Zhou, K. Zhang, J. Liu, G. Song and B. X. Ye, Anal. Methods, 2012, 4, 1350–1356 RSC.
- C. Mousty, S. Cosnier, M. Sanchez-Paniagua Lopez, E. Lopez-Cabarcos and B. Lopez-Ruiz, Electroanalysis, 2007, 19, 253–258 CrossRef CAS.
- K. Saha, S. S. Agasti, C. Kim, X. N. Li and V. M. Rotello, Chem. Rev., 2012, 112, 2739–2779 CrossRef CAS PubMed.
- K. C. Grabar, R. G. Freeman, M. B. Hommer and M. J. Natan, Anal. Chem., 1995, 67, 735–743 CrossRef CAS.
- D. T. Nguyen, D. J. Kim, M. G. So and K. S. Kim, Adv. Powder Technol., 2010, 21, 111–118 CrossRef CAS.
- M. A. Lillo-Ródenas, D. Cazorla-Amorós and A. Linares-Solano, Carbon, 2003, 41, 267–275 CrossRef.
- X. T. Zhang and W. X. Chen, Microporous Mesoporous Mater., 2015, 206, 194–201 CrossRef CAS.
- Y. W. Zhu, S. Murali, M. D. Stoller, K. J. Ganesh, W. W. Cai, P. J. Ferreira, A. Pirkle, R. M. Wallace, K. A. Cychosz, M. Thommes, D. Su, E. A. Stach and R. S. Ruoff, Science, 2011, 332, 1537–1541 CrossRef CAS PubMed.
- Y. K. Lv, L. H. Gan, M. X. Liu, W. Xiong, Z. J. Xu, D. Z. Zhu and D. S. Wright, J. Power Sources, 2012, 209, 152–157 CrossRef CAS.
- D. D. Miao, J. J. Li, R. Yang, J. J. Qu, L. B. Qu and P. B. Harrington, J. Electroanal. Chem., 2014, 732, 17–24 CrossRef CAS.
- S. L. Yang, G. Li, G. F. Wang, J. H. Zhao, Z. H. Qiao and L. B. Qu, Sens. Actuators, B, 2015, 206, 126–132 CrossRef CAS.
- W. Sun, L. F. Dong, Y. X. Lu, Y. Deng, J. H. Yu, X. H. Sun and Q. Q. Zhu, Sens. Actuators, B, 2014, 199, 36–41 CrossRef CAS.
- W. Sun, Y. H. Wang, S. X. Gong, Y. Cheng, F. Shi and Z. F. Sun, Electrochim. Acta, 2013, 109, 298–304 CrossRef CAS.
- X. F. Yang, J. H. Long and D. Sun, Electroanalysis, 2016, 28, 83–87 CrossRef CAS.
- J. F. Xia, Z. H. Wang, F. Cai, F. F. Zhang, M. Yang, W. J. Xiang, S. Bi and R. J. Gui, RSC Adv., 2015, 5, 39131–39137 RSC.
- K. X. Zhang, J. K. Xu, X. F. Zhu, L. M. Lu, X. M. Duan, D. F. Hu, L. Q. Dong, H. Sun, Y. S. Gao and Y. Wu, J. Electroanal. Chem., 2015, 739, 66–72 CrossRef CAS.
- X. Ran, L. Yang, J. Q. Zhang, G. G. Deng, Y. C. Li, X. G. Xie, H. Zhao and C. P. Li, Anal. Chim. Acta, 2015, 892, 85–94 CrossRef CAS PubMed.
- P. F. Pang, H. Z. Li, Y. P. Liu, Y. L. Zhang, L. L. Feng, H. B. Wang, Z. Wu and W. R. Yang, Anal. Methods, 2015, 7, 3581–3586 RSC.
|
This journal is © The Royal Society of Chemistry 2016 |
Click here to see how this site uses Cookies. View our privacy policy here.