Influence of siloxane on the transport of ZnO nanoparticles from different release pathways in saturated sand

Sung Hee Joo*a, Marc Knechtb, Chunming Suc, Seokju Seoa and Randy Lawrenceb
aDepartment of Civil, Architectural, and Environmental Engineering, University of Miami, 1251 Memorial Dr McArthur Engineering Building, Coral Gables, FL 33146-0630, USA. E-mail: s.joo1@miami.edu; Fax: +1-305-284-3492; Tel: +1-305-284-3489
bDepartment of Chemistry, University of Miami, 1301 Memorial Drive, Coral Gables, FL 33146, USA
cGround Water and Ecosystems Restoration Division, National Risk Management, Research Laboratory, Office of Research and Development, U.S. Environmental Protection Agency, 919 Kerr Research Drive, Ada, Oklahoma 74820, USA

Received 13th September 2016 , Accepted 12th October 2016

First published on 17th October 2016


Abstract

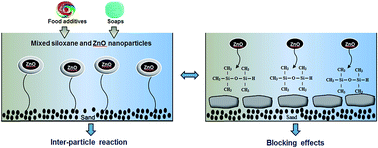
The production of nanomaterials (NMs) is expected to grow continuously, yet their transformation, transport, release mechanisms, and interactions with contaminants under environmental conditions remain poorly understood. Few studies have investigated the effects of contaminants on fate and transport of NMs, especially siloxanes that are widely found in products. It is hypothesized that the model contaminant, siloxane (e.g., 1,1,3,3-tetramethyldisiloxane (TMDS)) may influence the mechanisms and transport kinetics of NMs under different release pathways. Sand column experiments were carried out under two different scenarios: the release from a mixed TMDS and nano-ZnO suspension (A) and the release of nano-ZnO from sand contaminated with TMDS (B). Results show that interparticle reactions are dominant in (A) and particle–porous interactions are responsible for blocking effects governing in (B). Insights, especially the kinetics of nano-ZnO from co-transport by a contaminant and from porous media preloaded with a contaminant, and environmental factors affecting the release and retention of nano-ZnO in saturated sand are unveiled. These two dominant transport mechanisms (e.g., interparticle reactions and blocking effects) were derived. This study indicates that the release of ZnO NPs is influenced by the presence of TMDS; the extent of mobility and their transport pathways depend on the pre-existence of TMDS in porous media.

1. Introduction

Zinc oxide (ZnO) nanoparticles (nano-ZnO) are one of the most abundantly used inorganic nanoparticles (NPs) for a wide range of applications in various fields—including cosmetics industry, environmental engineering, and optics and electronic engineering—on account of their unique properties and diverse nanostructures.1–6 Because nano-ZnO effectively absorbs over a larger fraction of the solar spectrum, is transparent to visible light, and is antimicrobial,7,8 its use in cosmetics products continues to increase.9 Consequently, after their release into the natural environment, these nanoproducts can cause pollution issues since nanomaterials (NMs) can infiltrate into water streams and be transferred into the human body via the food chain. Despite this situation, regulations on nanoproducts have not yet been implemented.

As a result of increased concern about exposure to nano-ZnO, eco-toxicity studies of nano-ZnO have been conducted; their results show that nano-ZnO is toxic to the roots of plants and to organisms (e.g., bacteria and rodents), as well as to human cell lines.10–17 However, to quantitatively estimate the potential release of nano-ZnO for an evaluation of the range of environmental and health risks, the influence of various components present in natural systems should be studied so as to get a better understanding of the transport and fate of nano-ZnO in the natural environment. Accordingly, environmental factors—such as flow velocity, pH, ionic strength, and cation valence on the mechanisms controlling the transport and retention behavior of nano-ZnO in various packed porous media systems—have been attracting increasing interest from a number of researchers.18–21

While their findings provide valuable information on the transport properties and fate of nano-ZnO in porous media, it is unlikely that NMs are present by themselves without any influence by other contaminants in natural environmental systems. In other words, although the investigation of the interaction between nano-ZnO and other contaminants is required to understand the transport and fate of nano-ZnO in heterogeneous conditions, there has been a paucity of research on understanding the interaction of nano-ZnO and contaminants under environmental conditions. Likewise, coating materials on NPs in products and other ingredients may interact with each other, thus affecting the fate and transformation of NPs. In particular, cyclic and linear dimethylsiloxanes have been used in multiple ways in the cosmetics industry because of their high compressibility, high thermal stability, and low toxicity to human skin.22–24

Siloxane compounds, including 1,1,3,3-tetramethyldisiloxane (TMDS), pentamethyldisiloxane, hexamethyldisiloxane, octamethyldisiloxane, hexamethylcyclotrisiloxane, octamethylcyclotetrasiloxane, decamethylcyclopentasiloxane, and dodecamethylcyclohexasiloxane, can be found in consumer and biomedical products, textiles, personal care products, medical implants, water-repelling windshield coatings, food additives, some soaps, building sealants, and lubricants.25–28 Siloxanes are also applied in industrial processes and construction as NMs and are released when silicon-based chemicals are produced.29 Interestingly, in the food industry, siloxanes have been added to frying oils as an anti-foaming agent for the inhibition of oxidation.30 Due to their widespread production and applications in various fields, approximately 5 to 100 ng g−1 (w.w.) of siloxanes were detected in liver samples of marine fish such as eelpout, flounder, cod, sculpin, and dab.31 These contaminants can be transferred into the human body via the consumption of these fish. As a result, there is significant concern about the potential environmental and public health impacts of nano-ZnO and siloxanes in terms of the release of nano-ZnO and the ingredients from its related products into the environment.

As a consequence, fundamental research on the fate, transport, and the reaction mechanism of nano-ZnO upon interaction with siloxanes needs to be investigated. Potential impacts associated with the toxicity and physicochemical properties of siloxanes have been studied.24,32–34 Specifically, based on half maximal inhibitory concentrations (i.e., IC50 s) ranging from 209 to 2051 mg kg−1, the significant toxicity effects of siloxane were observed for Folsomia candida (springtail) and Hordeum vulgare (barley).32 However, no studies have investigated the effects of contaminants (e.g., siloxane) on the fate and transport of metal oxide nanoparticles (e.g., nano-ZnO) and their interaction mechanisms.

While all contaminants will be eventually released into the environmental media (soil, groundwater, or surface water), the interactions between NMs being used and their associated contaminants are not well understood; therefore, comprehensive studies need to be conducted for risk assessment. Among siloxane, the model contaminant TMDS was chosen, since it is widely used in cosmetics, lotions, water-repelling windshield coating, food additives, and some soaps; this widespread use makes it a perfect model contaminant to be applied in this research. Furthermore, TMDS has been used as a dispersant in consumer products, which could affect the longevity of NMs via changes at the oxide surface. However, few studies have investigated the effects of TMDS as a contaminant and dispersant on NMs.

Whereas the effects of environmental factors, dispersants, and organic molecules on the transport of NMs have been studied, there has never been any investigation of the transport mechanisms and kinetics between co-transport of contaminant-mixed NMs and the release of NMs from pre-contaminated porous media. Moreover, no studies have explored the transport mechanisms of NPs from the co-transport of contaminants and from pre-loaded contaminants in porous media. In this paper, we have investigated the effects of the contaminant siloxane (e.g., 1,1,3,3-tetramethyldisiloxane (TMDS)) on nano-ZnO, particularly the transport kinetics and mechanisms. Herein we aim to: (1) identify the effects of the siloxane TMDS on the surface properties of nano-ZnO, (2) investigate the transport kinetics of nano-ZnO in the presence and absence of TMDS, and (3) probe the transport mechanisms occurring in nano-ZnO attached to TMDS in saturated sand. To the best of our knowledge, no one has reported any transport mechanisms and kinetics of NPs that differ from the co-transport of siloxane-mixed NPs and pre-contaminated porous media with siloxane.

2. Materials and methods

2.1. Materials and preparation of nano-ZnO suspension

Commercial nano-ZnO (>97% purity, <50 nm ± 5 nm nominal size, average size: 44 nm, >10.8 m2 g−1 surface area, information from manufacturer) and TMDS (>97% purity) were purchased from Sigma-Aldrich (St. Louis, MO). The physical chemical properties of TMDS (chemical name: tetramethyldisiloxane; CAS no. 3277-26-7; mw. 134.32; [(CH3)2SiH]2O) include a density of 0.76 g mL−1 at 25 °C, refractive index of 1.3669, appearing clear and colorless, having no odor, and a boiling point of 70 °C (760 mmHg). The porous media of 50/70 mesh high-purity quartz sand (>99.7% SiO2, Sigma-Aldrich) has a specific gravity of 2.65 g cm−3 and an average porosity of 0.32. Prior to the column experiments, the sand was pretreated by soaking it in 12 M HCl, repeatedly rinsing with ultrapure water, and drying in an oven at 60 °C. A 50 mg L−1 NaNO3 solution (>99.0% purity, purchased from Fisher Scientific, Fair Lawn, NJ) was used as a tracer and introduced in a downward direction. The concentrations of the tracer (NO3) were determined by the chromotropic acid method35 using a DU® 720 UV/Vis spectrophotometer (Beckman Coulter, Brea, CA). A ZnO suspension (50 mg L−1) was prepared in ultrapure water (18.2 MΩ) produced with a three-stage Millipore Milli-Q plus 185 purification system (Millipore, Billerica, MA). Experiments involving the pH effects on the mobility of the nano-ZnO solutions were prepared both in the absence and presence of 1 mM Na2CO3 (IS: 3 mM).

2.2. Column experiments

Glass columns (1.1 cm ID × 10 cm length, empty bed volume of 9.5 cm3) with a configuration of end-caps and fittings were used. A total of 14 g of sand was uniformly packed into the vertical cylindrical glass columns, with 0.5 g of glass wool on the top and bottom to prevent sand elution. The sand was equilibrated for 10 min with ultrapure water at a 3.6 mL min−1 flow rate controlled by a peristaltic pump (model Easy-load® II, Cole-Parmer Instrument Co., USA) in a downward flow. All column experiments were run in duplicate (with a standard error of mean of ±10%). All nano-ZnO suspensions were run on a digital plate stirrer (model MSH-30D, WiseStir®, USA) with a small magnetic stir bar placed inside and running at a constant speed to ensure they were properly mixed throughout the experiments. Nano-ZnO suspensions were injected into the column in a downward mode. All the tested flow rates were calibrated with a pump (1–6 scales; 1 at a flow rate of 1.0 mL min−1, 2 at a flow rate of 2.0 mL min−1, and 3 at a flow rate of 3.6 mL min−1).

The column experiments were performed as a function of flow rate (set at 1.0, 2.0, or 3.6 mL min−1), pH (7 or 9), and TMDS concentration (3 or 30 mg L−1) in order to examine the effects of environmental conditions on the transport of nano-ZnO in the presence and absence of TMDS. The influence of TMDS on the nano-ZnO in porous media was investigated in two ways: one was to introduce the mixed nano-ZnO suspension and TMDS (e.g., 50 mg nano-ZnO added to 3 and 30 mg L−1 TMDS), and the other was to pre-contaminate sand with TMDS (e.g., 3 and 30 mg L−1 of TMDS solutions pre-flushed and contaminated on sand for 10 minutes) before introducing the nano-ZnO suspension (50 mg L−1) into the saturated sand. All suspensions were mixed with a magnetic stir bar for 1 hour at 25 °C.

2.3. Analyses

Samples from the column effluent were taken at the time intervals of 0, 0.25, 0.5, 1, 1.5, 2.0, 2.5, 3.0, 3.5, and 4.0 h in sterile centrifuge tubes. Physicochemical properties (e.g., zeta-potential and hydrodynamic diameter) were measured using a Zetasizer Nano ZS90 (Malvern Instruments, UK). The influent and effluent concentrations of nano-ZnO were analyzed using a DU® 720 UV/Vis spectrophotometer (DU® 720, Beckman Coulter, Pasadena, CA) without a filtration process. UV-Vis absorption spectra of nano-ZnO were conducted at room temperature using eight different concentrations of nano-ZnO in a range of 350–400 nm for the wavelength scan. The spectrum result reveals the absorption peak of nano-ZnO occurring at the wavelength of 375 nm (R2 = 0.998). The isoelectric point (IEP) of the nano-ZnO was determined by measuring the zeta-potential of 50 mg L−1 nano-ZnO suspensions at different pH values (ESI, Fig. S1). In this experiment, the working solution was adjusted to each pH of 3, 5, 7, 9, and 11 by adding 1 M of either HCl or NaOH; the solution was then monitored constantly with a pH meter (Orion™, 720A, USA), employing a glass electrode (Orion™, 8156BNUWP, USA).

The morphological characterizations of nano-ZnO were verified by transmission electron microscopy (TEM: model JEOL JEM-1400, Tokyo, Japan) using a Gatan SC 1000 ORIUS CCD camera (Warrendale, PA) operated at an accelerating voltage of 100 kV. The TEM sample was prepared by applying a drop of 50 mg L−1 nano-ZnO suspension sample dispersed in water onto the carbon side of carbon-coated, 400 mesh copper grids; this was allowed to dry at room temperature. The ImageJ program was used to determine the number and diameter of the particles and the distances between discrete particles and groups of agglomerated nano-ZnO from TEM micrographs. In conjunction with the TEM ImageJ program, the following equations36 were used to estimate the electrostatic double layer forces for the co-transport of TMDS mixed nano-ZnO. The average particle size and standard deviation were calculated by counting at least 200 particles observed in different areas of TEM images.

 
image file: c6ra22820h-t1.tif(1)
 
image file: c6ra22820h-t2.tif(2)
[ε0: the permittivity of vacuum; εr: the dielectric constant or relative permittivity of water; ζp1 and ζp2: the zeta potentials for ZnO-NP 1 and 2; zj: the ion valence, e: electron charge; nj0: the number for the concentration of ions in the bulk solution].

FT-IR analysis (Frontier, Perkin Elmer, Norwalk, CT) was employed to investigate the nature of interactions between TMDS and the nano-ZnO with different TMDS concentrations. The FT-IR samples were prepared after making 50 mg L−1 nano-ZnO with different concentrations (0, 3, 7, 15, and 30 mg L−1) of TMDS. Each suspension was well mixed with a magnetic stir bar for 1 hour at 25 °C to be consistent with the suspension condition used in column experiments. These samples were then placed in a ventilated hood so the water could evaporate in one day. Before each measurement, the crystal was cleaned thoroughly with acetone and allowed to dry in the air for 10 minutes. The instrument was blanked against ambient conditions before lyophilized nano-ZnO and TMDS samples were directly placed onto the crystal. Samples were scanned four times and the summations of those spectra were analyzed.

In the X-ray diffraction (XRD) analysis of nano-ZnO NPs, a subsample of pristine nano-ZnO powder solids (about 20 mg) was taken to fill up the cavity (7 mm diameter) of an elemental silicon slide sample holder. The sample in the cavity was pressed with a spatula to form a smooth surface. For the 50 mg L−1 nano-ZnO suspensions, 150 mL of mixed nano-ZnO (50 mg L−1) with different concentrations (3 and 30 mg L−1) of TMDS and effluents transported through the sand columns were filtered through a 45 mm diameter and 45 μm pore size Whatman membrane filter paper and dried. The filter paper was cut into quarters; a quarter was taped to a flat zero-background quartz slide. The silicon or quartz slide was scanned with a Rigaku Miniflex X-ray diffractometer at a scan rate of 0.5° 2θ min−1 and sampling width of 0.05° 2θ (Fe Kα radiation, λ = 1.9373 Ε; operated at 30 keV and 15 mA).

3. Results and discussion

3.1. Characterization of nano-ZnO in the presence and absence of TMDS

TEM analysis was carried out specifically to characterize the morphology and particle size of nano-ZnO in the presence and absence of TMDS. A schematic representation of the effect of electrosteric stabilization of TMDS on nano-ZnO is presented in Fig. 1. When TMDS was mixed with nano-ZnO, TMDS molecules were adsorbed on the nano-ZnO surface. As a result, the negative charges of TMDS that adsorbed nano-ZnO prevent nanoparticle agglomeration, thereby increasing the distance between the particles and decreasing the distance between agglomerated groups of nano-ZnO. This also resulted in the decreasing hydrodynamic particle size (nm) of nano-ZnO suspension in the presence of TMDS. As shown in Fig. S2, the hydrodynamic diameter sizes of nano-ZnO were decreased in the presence of TMDS (e.g., 512 → 370 nm: 3 mg L−1 TMDS; 512 → 345 nm: 30 mg L−1 TMDS). The average distance between the latter was significantly decreased from approximately 4.23 to approximately 1.73 μm when TMDS (30 mg L−1) was mixed with the 50 mg L−1 nano-ZnO suspension.
image file: c6ra22820h-f1.tif
Fig. 1 Schematic diagram of the effect of electrostatic stabilization of TMDS on nano-ZnO and TEM images showing the average distance between groups of agglomerated nano-ZnO in the presence and absence of TMDS.

Fig. 2 shows the TEM micrographs of nano-ZnO from 50 mg L−1 of nano-ZnO (a), 50 mg L−1 of nano-ZnO mixed with 3 mg L−1 of TMDS (c), and 30 mg L−1 of TMDS (e). As shown in the micrographs, the histograms of the particle diameter distributions of nano-ZnO were determined by TEM images fitted using Gaussian and Lorentzian functions. The distribution of nano-ZnO in the absence of TMDS shows that spherical nano-ZnO was agglomerated with an average particle size of 25.21 nm. In the size distribution of nano-ZnO when TMDS is present, the average particle size decreased from 25.21 (b) to 8.8 (d) and 5.2 nm (f), respectively. Furthermore, as shown in the TEM micrographs (c) and (e), nano-ZnO was highly dispersed. Consequently, the distance between nano-ZnO particles increased from 37.7 (a) to 47.6 (c) and 113.6 nm (e) in the presence of 3 and 30 mg L−1 TMDS, respectively. The TEM analysis results indicate that in the absence of TMDS, nano-ZnO tends to aggregate and form agglomeration rapidly, whereas the presence of TMDS inhibits interparticle reactions among nano-ZnO, thereby enhancing particle stabilization. A longer distance observed from TMDS mixed nano-ZnO, estimated with the ImageJ program, is indicative of the increased electrostatic double layer forces—in other words, the increased surface separation of ZnO–ZnO (Fig. 1).


image file: c6ra22820h-f2.tif
Fig. 2 Characterization of the particle size of nano-ZnO. TEM images of nano-ZnO deposited onto a TEM grid from (a) 50 mg L−1 of nano-ZnO, (c) 50 mg L−1 of nano-ZnO mixed with 3 mg L−1 of TMDS, and (e) 30 mg L−1 of TMDS (red arrow indicates distance between particles), (b, d and f) histograms of measured particle diameters of nano-ZnO calculated from TEM images fitted using Gaussian and Lorentzian functions.

3.2. Effects of environmental conditions on the transport of nano-ZnO

The mobility and removal of nano-ZnO on porous media can be influenced by contaminants. In particular, studies of the transport mechanisms of NMs from the co-transport of contaminant-loaded NPs in comparison to the pre-loading of contaminant on porous media are very limited. The logic of this study therefore aims to identify the effect of flow rate and the associated mechanisms governing such an effect in the absence of contaminants (in this case, the siloxane TMDS), followed by the transport mechanisms and kinetics in the presence of TMDS under the two different release scenarios at a fixed flow rate determined from the effect of flow rate study.

First, when the flow rate was increased from 1.0 to 3.6 mL min−1, an almost four times enhanced elution (C/C0) of nano-ZnO suspension occurred within 4 hours, as shown in Fig. 3. This phenomenon can be explained by the fact that, while smaller particles attach favorably to the collector surface (sand) due to Brownian diffusion,37 increasing the velocity results in the reduced interception of the surface38 and perhaps promoting favorable transport flow or formed micropores, thereby increasing the elution of NMs. However, such elution kinetics of NMs may also depend on the type and concentration, as these structures undergo physicochemical and biological transformations that also depend on physicochemical properties, solution chemistry, and biogeochemical and hydrodynamic conditions.39 The plateau value of 40% in the passage of the nano-ZnO was observed in 2 hours at the highest flow rate (3.6 mL min−1), which revealed a comparatively more rapid elution than at the other two flow rates (1 and 2 mL min−1). The elevated velocity may decrease the rate of attachment on the collector surface, thus increasing the transport rate of NMs.37 Whereas gradually increasing the elution of nano-ZnO suspension was observed at 2 mL min−1, little changes in the elution with significant deposition (90%) of nano-ZnO appeared at the lowest velocity, 1 mL min−1.


image file: c6ra22820h-f3.tif
Fig. 3 (a) Fractional surface coverage (θ) as a function of flow rates [1, 2, and 3.6 mL min−1]. (b) Effects of flow rates on the release kinetics of nano-ZnO [flow rate: 1, 2, and 3.6 mL min−1].

Studies have used several equations—including the Debye length,39 deposition coefficients,40 and collector surface coverage (θ)—to assess the stability, accumulation, fate, and transport phenomena of NMs and identify their transport mechanisms.41 The results of these nano-ZnO transport experiments indicate that blocking effects may have an influence at different flow rates. In other words, the blocking effects of smaller particle size and diffusion on the collector surface occur and the consequent accumulation of nano-ZnO may have arisen at lower flow rates where the aggregation and straining are maximized. The blocking effects were elaborated by estimating the collector surface coverage (θ) according to the following equation:42,43

 
image file: c6ra22820h-t3.tif(3)
[ap = the particle radius; ac = the collector radius; U = the fluid approach velocity; C/C0 = the column inlet NP concentration; L = the column length; ε = the porosity].

In Fig. 3a, the estimated surface coverage (θ) was around 0.028, 0.050, and 0.078 at 1, 2, and 3.6 mL min−1 velocity, indicating rapid elution at the highest velocity of nano-ZnO due to the blocking phenomenon. In this study, no buffer was used and pH remained at around 7 throughout the column experiments. The isoelectric point (IEP), namely the pH at which a particular molecule does not carry a net electrical charge, was found to be around 8.3 (without a buffer), which was consistent with other studies44–46 and 9.0 (with a buffer) using the titration of nano-ZnO solution over pH ranges (3–11) (ESI, Fig. S1). At these IEPs, the sizes of nano-ZnO were the largest at 680 and 782 nm (ESI, Fig. S1).

While ZnO particles negatively charged at pH 9 could offer favorable electrostatic repulsion interaction with the quartz sand compared to pH 7 (positively charged) (Fig. S1), experimental observations show the transport of ZnO particles is greater at pH 7 than at pH 9. This result indicates that velocity significantly influences the mobility of ZnO with increased transport, especially at a higher velocity (3 mL min−1). Since ZnO particles are known to exhibit greater solubility at lower pH levels,36 the dissolution effect may have influenced the mobility at pH 7 compared to that found at pH 9. At pH 9, the zinc ion (Zn2+) forms hydroxyl complexes on the particle surface, making the effect of dissolution on the transport negligible.47–49 In addition, the experiments carried out at pH 9 show no elution of nano-ZnO from the column, due to the surface charge near zero at pH 9 with increased aggregation formed in the column.

3.3. Effects of TMDS on the transport of nano-ZnO

The presence of contaminants can result in the transformation of the NMs via the interactions between the contaminants and NMs. This affects the removal and mobility of the NMs, depending on the physicochemical properties of the contaminants and the NMs. The effects of the contaminant (TMDS) on the nano-ZnO were studied in order to identify the removal and transport mechanisms of NMs in the presence of contaminants. As shown in Fig. 4, when a mixed nano-ZnO suspension and TMDS are introduced into the sand, the mobility of the nano-ZnO suspension in the presence of TMDS changed substantially. To this end, continuous elution of the nano-ZnO in the presence of TMDS occurred, reaching 60% passage of the nano-ZnO in 284 pore volumes (PV) at pH 7, but little difference was noted among the two different concentrations of TMDS (3 and 30 mg L−1). The estimated mass balance indicates that 71.81% of nano-ZnO was deposited on porous media at pH 7. In the presence of TMDS (30 mg L−1), the deposition of nano-ZNO was reduced to 56.33% at pH 7.
image file: c6ra22820h-f4.tif
Fig. 4 Release kinetics of nano-ZnO from co-transport of the mixed TMDS and nano-ZnO from sand (a), deposition and elusion kinetics of nano-ZnO from sand (b) [the vertical red line indicates the introduction of deionized (DI) water. TMDS: 0, 3, and 30 mg L−1; pH: 7 and 9; flow rate: 3.6 mL min−1].

At pH 9, significant deposition and retention of the nano-ZnO occurred regardless of the presence of TMDS, indicating that the mixture of TMDS with a nano-ZnO suspension did not affect the mobility of the nano-ZnO at pH 9. This is also indicative of a zeta potential value near zero (ESI, Fig. S1). A representative breakthrough curve was compared using conservative solute tracers (50 mg L−1 NaNO3). A steady state of elution was reached near 1.0 (C/C0) from the tracer, indicating that a nanoparticle (NP) interaction (nZnO–nZnO) caused significant deposition on the sand due to agglomeration, thereby reducing the mobility and elution of the nano-ZnO. A similar observation was also shown in other studies.19 The continuous elution of the nano-ZnO at pH 7 when the mixture of TMDS and nano-ZnO suspension was introduced into sand is indicative of interparticle reactions (reactions between particles) dominating over particle–porous interaction (interaction between particles and a porous medium) and/or blocking effects (e.g., surface blocking effects occurring on the adsorption of particles on porous media) in the current study.

According to the DLVO (Derjaguin, Landdau, Verwey, and Overbeek) theory, two double layers of the two particles can overlap, generating a repulsion force when particles approach each other. Particle–particle aggregation can occur when particles have sufficient energy to overcome the energy barrier using the repulsive force, forming larger particles.50,51 When the deposition of nanoparticles onto the surface of porous media is favorable due to a low energy barrier between particles and porous media, particle–porous interaction can occur instead of particle–particle interaction.41 Blocking effect is a result of a decrease in the deposition of particles because of a lack of available attachment sites on the surface of the collector.52

To explore and gain insights into the transport mechanisms of TMDS adsorbed on nano-ZnO, the elution kinetics of the NM were investigated on sand that was pre-saturated with TMDS at two different concentrations (e.g., 3 and 30 mg L−1). Interestingly, when the sand was pre-contaminated with TMDS, a lower elution was observed, plateauing sooner compared to the elution of the mixed TMDS and nano-ZnO suspension. In addition, a 10 times higher concentration of TMDS resulted in more mobility (Fig. 5). With the TMDS pre-contaminated sand, 79% of ZnO was deposited, which was around 7% more deposition than occurred in the absence of TMDS at pH 7. When comparing the two different concentrations of TMDS, the higher concentration of TMDS-saturated sand provided more elution and lower retention of the nano-ZnO. However, at pH 9, a significant deposition and retention of the nano-ZnO were observed, which was similar to the results at pH 9 shown in Fig. 4. These results suggest that the contaminants present on the porous media result in the diminished NP transport, which depends on the concentrations of the contaminant. In our study, a higher concentration of TMDS on porous media provided stability for the nano-ZnO, releasing more nano-ZnO particles.


image file: c6ra22820h-f5.tif
Fig. 5 Release kinetics of nano-ZnO from sand contaminated with TMDS (a), deposition and elusion kinetics of nano-ZnO from sand contaminated with TMDS (b) [the vertical red line is the point where deionized (DI) water was introduced. TMDS; 0, 3, and 30 mg L−1; pH: 7 and 9; flow rate: 3.6 mL min−1].

The influence of natural organic matter on the deposition of nano-ZnO on silica surfaces is different than TMDS. Pre-coating Suwannee River humic acid (SRHA) onto silica surfaces hinders ZnO nanoparticle deposition in both monovalent and divalent solutions. Steric repulsion is responsible for the decreased deposition of ZnO particles on SRHA-coated surfaces.20 Another study has reported that natural organic matter decreases attachment efficiency so as to facilitate nano-ZnO transport through sand columns precoated with humic acid at pH 7.5.53

The TMDS adsorbed on the surface of nano-ZnO increased particle stability, thereby enhancing the transport of the NM, possibly due to the inter-particle interaction (steric stabilization) through the adhesion of TMDS on the particle surface.54 The slight increase in zeta potential and decreased hydrodynamic diameters from the ZnO suspension (50 mg L−1) in the presence of TMDS (3 and 30 mg L−1) are indicative of an electrosteric stabilizing effect on the mobility of ZnO suspension. In contrast, at pH 9, the transport of ZnO is not influenced by TMDS, which could be due to the influence of TMDS on ZnO dissolution at lower pH levels (e.g., pH 7) compared to higher pH levels (e.g., pH 9).

These results are well supported by elution experiments wherein the column was flushed with deionized water in order to investigate the release of the retained nano-ZnO. As an example, the mobility of the nano-ZnO co-transported by TMDS increased significantly from 28.19% to 43.67%. Furthermore, deposited nano-ZnO was easily released during deionized water flushing due to the increased mobility of nano-ZnO particles by TMDS in comparison to ZnO in the absence of TMDS (Fig. 4b).

In contrast, when the sand was pre-saturated with TMDS, porous–particle interaction and/or blocking effects appeared as the governing mechanisms responsible for both the lower elution and higher deposition of nano-ZnO. As shown in Fig. 5b, the deposition (%) of nano-ZnO on sand increased from 72% to 79% when TMDS (30 mg L−1) was preloaded on sand, and the elusion (%) of nano-ZnO from sand decreased noticeably from 10.4% to 3.87%. These results indicate that when TMDS is preloaded, sites available for attachment become limited, which means a blocking phenomenon is likely to occur, thereby making particle–collector interaction favorable. These results are well-supported by the estimated surface coverage (θ) between nano-ZnO released from the mixture of TMDS and nano-ZnO in the sand (A), and nano-ZnO released from the sand that was pre-contaminated with TMDS (B). The estimated θ values were 0.062 and 0.060 (3 mg L−1 and 30 mg L−1 TMDS in (A)), and 0.099 and 0.090 (3 mg L−1 and 30 mg L−1 TMDS in (B)), while the θ of the control treatment (no buffer, only nano-ZnO released from the sand) was 0.078.

The reactions between the TMDS and nano-ZnO were further examined using FT-IR and XRD analyses. As shown in Fig. 6, the presence of TMDS influenced the physicochemical properties of nano-ZnO with a new stretching peak—appearing at 1300 cm−1—arising from the Si–CH3 bond.55 As the concentration of TMDS was increased, the peak corresponding functional groups of C[double bond, length as m-dash]O at 1700 cm−1 56 showed a slight shift with no stretching peaks appearing at the highest concentration of TMDS (30 mg L−1) (Fig. 6). This indicates that the TMDS molecule is adsorbed onto the nano-ZnO surface, giving rise to the modification of the material in the model environmental system. The C[double bond, length as m-dash]O shown in nano-ZnO and TMDS is likely due to atmospheric CO2. The XRD results shown in Fig. 7 indicate that the dominant presence of zincite (ZnO, pdf# 01-070-2551) appears in all nano-ZnO suspensions in the presence and absence of TMDS. There are trace amounts of quartz in the industrial nano-ZnO nanopowder and in the nano-ZnO samples collected after use in the batch and column tests. One quartz phase (pdf# 01-083-0540) showed a very small peak at 34.55° 2θ, and another quartz phase (pdf# 01-070-2537) showed two very small peaks at 28.35° 2θ and 36.30° 2θ. There was no sclarite (Zn7(CO3)2(OH)10) in the pristine nano-ZnO sample, but a peak at 14.6° 2θ attributable to sclarite was observed especially in the nano-ZnO sample collected after column experiments, indicating that in the column, part of the nano-ZnO was transformed to the hydroxycarbonate form. This can possibly be attributed to the dissolution of atmospheric CO2 into nano-ZnO suspension to form bicarbonate anions and subsequent transformation of nano-ZnO by bicarbonate during and/or after the sand column experiments.

CO2 + H2O = HCO3 + H+

7ZnO + 2HCO3 + 5H2O = Zn7(CO3)2(OH)10 + 2OH


image file: c6ra22820h-f6.tif
Fig. 6 FT-IR spectra of pasted form of nano-ZnO mixed with different concentrations of TMDS (0, 3, 7, 15, and 30 mg L−1).

image file: c6ra22820h-f7.tif
Fig. 7 XRD analyses (Fe Kα radiation, λ = 1.9373 Å) of nano-ZnO (black), 50 mg L−1 nano-ZnO suspension (red), nano-ZnO mixed with TMDS (3 mg L−1) (blue), nano-ZnO mixed with TMDS (30 mg L−1) (green), column effluent of nano-ZnO mixed with TMDS (3 mg L−1) (purple), and column effluent of nano-ZnO mixed with TMDS (30 mg L−1) (pink) [conditions: nano-ZnO (50 mg L−1); no buffer].

The sclarite formed in the effluent from at both 3 and 30 mg L−1 siloxane indicates some ZnO was transformed to this new solid phase.

4. Conclusions

As shown by several experimental results, siloxanes (TMDS in this study) contributed to stabilizing nano-ZnO, resulting in increased transport when mixed TMDS and ZnO suspensions are introduced into the column packed with sand. In contrast, nano-ZnO forms agglomerations rapidly in the absence of TMDS, as revealed in larger hydrodynamic diameter sizes (e.g., 512 nm) compared to those in the presence of TMDS (e.g., 345–370 nm). In regards to the effect of the flow rate (e.g., 1, 2, or 3.6 mL min−1) on the transport of ZnO, increased transport of nano-ZnO suspension (e.g., 4 times elution occurring in 4 h at 3.6 mL min−1, compared to elution at 1 mL min−1) was observed. This phenomenon is well explained by the blocking effects—that is, smaller particle size and diffusion on the collector surface cause the accumulation of nano-ZnO to arise more at lower flow rates and estimation with surface coverage (θ) (e.g., 0.028, 0.050, and 0.078 at 1, 2, and 3.6 mL min−1 velocity).

As hypothesized previously, results show that the transport of nano-ZnO was influenced by the presence of TMDS. This suggests the removal and transport mechanisms of NMs are affected by the presence of contaminants. While ZnO suspensions were eluted more when the TMDS mixed ZnO solution was transported into sand (e.g., 60% elution in 284 PV at pH 7) compared to those in the absence of TMDS, such enhanced elution was diminished when ZnO was mobilized into sand that was preloaded with TMDS. The contaminant, TMDS, was not affected at pH 9, due to the zeta potential value of nearly zero. These results explain interparticle reactions over particle–porous or surface blocking effects. In addition, the electrosteric effect is dominant at pH 7 from the co-transport of TMDS and ZnO. In contrast, ZnO elution from the preloaded TMDS sand suggests that porous–particle interaction and/or blocking effects are the primary transport mechanisms.

The interparticle reactions that act as a dominant mechanism when TMDS is co-transported are primarily caused by steric stabilization. The addition of dispersants on nanoparticles changes their surface properties. In this study, the absorbed polymeric molecules of TMDS may create steric repulsion. When ZnO–ZnO particles approach the adsorbed TMDS layers, an interaction among ZnO particles occurs. This can be described quantitatively as the Gibbs free energy—ΔG = ΔHTΔS, where ΔH is enthalpy change and ΔS is entropy change, and T is temperature (Kelvin).57 As adsorbed layers of TMDS are compressed on ZnO surfaces, fewer polymer segments of TMDS occupy the compressed state, thereby losing entropy. Such a loss of entropy increases the Gibbs energy, preventing aggregation and increasing interparticle reactions.

On the other hand, the blocking effect is primarily caused by limited available sites in the porous media, which hinders the transport of ZnO suspension. The polymer molecules of TMDS that are being occupied in silica sand prevent steric stabilization of colloidal ZnO, reducing dispersion forces among ZnO NPs. However, at a higher concentration of TMDS, the limited porous sites and excess TMDS molecules could offer favorable conditions for ZnO interparticle reactions, providing ZnO stabilization on porous media, thereby releasing nano-ZnO particles.

The effects of TMDS on ZnO NPs transport also implicate the potential toxicity of environmental organisms, in that the uptake of ZnO NPs may cause aquatic organisms to undergo transformation in heterogeneous environmental conditions where contaminants are present. The combined effects of TMDS–ZnO on environmental organisms occur via dissolution and aggregation mechanisms since uncoated ZnO dissolves faster than the slower dissolving rate of coated ZnO.58 In this case, the TMDS–ZnO transport may prevent the aggregation of ZnO NPs that also affects the toxicity of ZnO NPs and the transformation of organisms. Given the increasing concern about the release of product-driven nanomaterials—concern that is particularly due to the lack of regulations and the potential toxic effects on the environment and public health—a fundamental understanding of how these contaminants influence the environmental dynamics (release, transport, fate, toxicity, and transformation) of the NMs is essential in order to assess and regulate the NMs used in consumer products in terms of environmental safety and public health.

Our study indicates that the presence of TMDS, once accumulated in porous media, can retard the release of nano-ZnO, thereby causing a significant accumulation of nano-ZnO due to straining and blocking effects. The release of TMDS-mixed nano-ZnO enhances the transport of the nano-ZnO through inter-particle interactions. Evaluation and assessment of the NMs in heterogeneous environmental systems, especially the effects of contaminant mixed NPs co-transport and NP released from porous media preloaded with contaminant, have not been addressed. Therefore, these findings, together with other influencing parameters, should be considered in designing NM-driven products for environmental safety. Future studies are encouraged to investigate the effect of contaminants on the transformation of nanomaterials directly extracted from consumer products and to compare with those from industrial nanoparticles in terms of fate, transport, and the mechanisms released into different environmental media under environmental conditions.

Acknowledgements

This work was supported by Provost Research Award given to SHJ at the University of Miami. This work does not reflect EPA's policy.

References

  1. B. Nowack and T. D. Bucheli, Environ. Pollut., 2007, 150, 5–22 CrossRef CAS PubMed.
  2. N. Serpone, D. Dondi and A. Albini, Inorg. Chim. Acta, 2007, 360, 794–802 CrossRef CAS.
  3. L. Mu and R. L. Sprando, Pharm. Res., 2010, 27, 1746–1749 CrossRef CAS PubMed.
  4. Q. Wang, B. Geng and S. Wang, Environ. Sci. Technol., 2009, 43, 8968–8973 CrossRef CAS PubMed.
  5. J. W. Soares, J. E. Whitten, D. W. Oblas and D. M. Steeves, Langmuir, 2008, 24, 371–374 CrossRef CAS PubMed.
  6. S. Dutta, S. Chattopadhyay, A. Sarkar, M. Chakrabarti, D. Sanyal and D. Jana, Prog. Mater. Sci., 2009, 54, 89–136 CrossRef CAS.
  7. J. F. Hernández-Sierra, F. Ruiz, D. C. Cruz Pena, F. Martínez-Gutiérrez, A. E. Martínez, A. de Jesús Pozos Guillén, H. Tapia-Pérez and G. Martínez Castañón, Nanomedicine, 2008, 4, 237–240 Search PubMed.
  8. A. Moezzi, A. M. McDonagh and M. B. Cortie, Chem. Eng. J., 2012, 185–186, 1–22 CrossRef CAS.
  9. R. B. Reed, D. A. Ladner, C. P. Higgins, P. Westerhoff and J. F. Ranville, Environ. Toxicol. Chem., 2012, 31, 93–99 CrossRef CAS PubMed.
  10. G. Ghodake, Y. D. Seo and D. S. Lee, J. Hazard. Mater., 2011, 186, 952–955 CrossRef CAS PubMed.
  11. D. Lin and B. Xing, Environ. Pollut., 2007, 150, 243–250 CrossRef CAS PubMed.
  12. D. Lin and B. Xing, Environ. Sci. Technol., 2008, 42, 5580–5585 CrossRef CAS PubMed.
  13. L. Zhang, Y. Jiang, Y. Ding, M. Povey and D. York, J. Nanopart. Res., 2007, 9, 479–489 CrossRef CAS.
  14. L. K. Adams, D. Y. Lyon and P. J. J. Alvarez, Water Res., 2006, 40, 3527–3532 CrossRef CAS PubMed.
  15. R. Brayner, R. Ferrari-Iliou, N. Brivois, S. Djediat, M. F. Benedetti and F. Fiévet, Nano Lett., 2006, 6, 866–870 CrossRef CAS PubMed.
  16. T. J. Brunner, P. Wick, P. Manser, P. Spohn, R. N. Grass, L. K. Limbach, A. Bruinink and W. J. Stark, Environ. Sci. Technol., 2006, 40, 4374–4381 CrossRef CAS PubMed.
  17. T. Xia, M. Kovochich, M. Liong, L. Mädler, B. Gilbert, H. Shi, J. I. Yeh, J. I. Zink and A. E. Nel, ACS Nano, 2008, 2, 2121–2134 CrossRef CAS PubMed.
  18. T. Ben-Moshe, I. Dror and B. Berkowitz, Chemosphere, 2010, 81, 387–393 CrossRef CAS PubMed.
  19. X. Jiang, M. Tong, R. Lu and H. Kim, Colloids Surf., A, 2012, 401, 29–37 CrossRef CAS.
  20. X. Jiang, M. Tong, H. Li and K. Yang, J. Colloid Interface Sci., 2010, 350, 427–434 CrossRef CAS PubMed.
  21. A. R. Petosa, S. J. Brennan, F. Rajput and N. Tufenkji, Water Res., 2012, 46, 1273–1285 CrossRef CAS PubMed.
  22. Y. Horii and K. Kannan, Arch. Environ. Contam. Toxicol., 2008, 55, 701–710 CrossRef CAS PubMed.
  23. D. R. Ortega and A. Subrenat, Environ. Technol., 2009, 30, 1073–1083 CrossRef CAS PubMed.
  24. D. G. Wang, H. Steer, T. Tait, Z. Williams, G. Pacepavicius, T. Young, T. Ng, S. A. Smyth, L. Kinsman and M. Alaee, Chemosphere, 2013, 93, 766–773 CrossRef CAS PubMed.
  25. S. Saeed, S. F. Kao and G. J. Graening, in AWMA Symposium on Air Quality Measurement Methods and Technology, 2002, pp. 13–15 Search PubMed.
  26. Tetramethyldisiloxane, TMDSO Silane, https://wandachem.en.alibaba.com/product/442089781-212322265/Tetramethyldisiloxane_TMDSO_Silane.html, accessed on, July 15 2016 Search PubMed.
  27. R. Dewil, L. Appels and J. Baeyens, Energy Convers. Manage., 2006, 47, 1711–1722 CrossRef CAS.
  28. M. Schweigkofler and R. Niessner, J. Hazard. Mater., 2001, 83, 183–196 CrossRef CAS PubMed.
  29. G. Collodetti, J. P. Philippe, P. J. Gleize and M. Monteiro, Construct. Build. Mater., 2014, 54, 99–105 CrossRef.
  30. I. P. Freeman, F. B. Padley and W. L. Sheppard, AOCS-ISF World Congress, 1973, pp. 101–103 Search PubMed.
  31. L. Kaj, M. Schlabach, J. Andersson, A. P. Cousins, N. Schmidbauer, E. Brorström-Lundén, B. B. Mogensen, M. Dam, J.-P. Hirvi, A. S. Sigurdsson, O. Glesne, B. Hedlund and A. Lundgren, TemaNord, Nordic Council of Ministers, Copenhagen, 2005, p. 593, ISBN 92-893-1268-8 Search PubMed.
  32. J. Velicogna, E. Ritchie, J. Princz, M.-E. Lessard and R. Scroggins, Chemosphere, 2012, 87, 77–83 CrossRef CAS PubMed.
  33. A. Kupareva, P. Maki-Arvela, H. Grenman, K. Eranen and D. Y. Murzin, Ind. Eng. Chem. Res., 2013, 52, 10080–10088 CrossRef CAS.
  34. A. Kupareva, P. Mäki-Arvela, H. Grénman, K. Eränen and D. Y. Murzin, J. Chem. Technol. Biotechnol., 2015, 90, 34–43 CrossRef CAS.
  35. P. W. West and T. P. Ramachandran, Anal. Chim. Acta, 1966, 35, 317–324 CrossRef CAS.
  36. Y. Han, G. Hwang, D. Kim, S. A. Bradford, B. Lee, I. Eom, P. J. Kim, S. Q. Choi and H. Kim, Water Res., 2016, 90, 247–257 CrossRef CAS PubMed.
  37. H. F. Lecoanet and M. R. Wiesner, Environ. Sci. Technol., 2004, 38, 4377–4382 CrossRef CAS PubMed.
  38. R. Kretzschmar, W. P. Robarge and A. Amoozegar, Water Resour. Res., 1995, 31, 435–445 CrossRef CAS.
  39. J. Hammes, J. A. Gallego-Urrea and M. Hasseliöv, Water Res., 2013, 47, 5350–5361 CrossRef CAS PubMed.
  40. K. Yao, M. T. Habibian and C. R. O'Melia, Environ. Sci. Technol., 1971, 5, 1105–1112 CrossRef CAS.
  41. T. Rahman, J. George and H. J. Shipley, Sci. Total Environ., 2013, 463–464, 565–571 CrossRef CAS PubMed.
  42. I. Chowdhury, Y. Hong, R. J. Honda and S. L. Walker, J. Colloid Interface Sci., 2011, 360, 548–555 CrossRef CAS PubMed.
  43. Y. Wang, Y. Li, J. D. Fortner, J. B. Hughes, L. M. Abriola and K. D. Pennell, Environ. Sci. Technol., 2008, 42, 3588–3594 CrossRef CAS PubMed.
  44. A. K. Singh, Engineered Nanoparticles: Structure, Properties and Mechanisms of Toxicity, Elsevier Science & Technology Books, 2015, vol. 554 Search PubMed.
  45. H. C. Yatmaz, A. Akyol and M. Bayramoglu, Ind. Eng. Chem. Res., 2004, 43, 6035–6039 CrossRef CAS.
  46. A. R. Trancoso, F. Braunschweig, M. Obermann and R. Neves, Sci. Total Environ., 2009, 407, 3004–3016 CrossRef CAS PubMed.
  47. S. Yamabi and H. Imai, J. Mater. Chem., 2002, 12, 3773–3778 RSC.
  48. S. W. Bian, I. A. Mudunkotuwa, T. Rupasinghe and V. H. Grassian, Langmuir, 2011, 27, 6059–6068 CrossRef CAS PubMed.
  49. E. A. Meulenkamp, J. Phys. Chem. B, 1998, 102, 7764–7769 CrossRef CAS.
  50. J. M. Pettibone, D. M. Cwiertny, M. Scherer and V. H. Grassian, Langmuir, 2008, 24, 6659–6667 CrossRef CAS PubMed.
  51. I. A. Mudunkotuwa and V. H. Grassian, J. Am. Chem. Soc., 2010, 132, 14986–14994 CrossRef CAS PubMed.
  52. L. Song and M. Elimelech, Colloids Surf., A, 1993, 73, 49–63 CrossRef CAS.
  53. E. H. Jones and C. Su, J. Hazard. Mater., 2014, 275, 79–88 CrossRef CAS PubMed.
  54. E. Verwey and J. Overbeek, Theory of the Stability of Lyophobic Colloids. Elsevier, Amsterdam, 1948 Search PubMed.
  55. P. J. Launer, Silicon Compd. Regist. Rev., 1987, pp. 100–103 Search PubMed.
  56. R. K. Khanna and M. H. Moore, Spectrochim. Acta, Part A, 1999, 55, 961–967 CrossRef.
  57. J. Israelachvili, Intermolecular and Surfaces Forces, Academic Press, 2nd edn, 1991 Search PubMed.
  58. S. H. Joo and D. Zhao, J. Hazard. Mater., 2016 DOI:0.1016/J.jhazmat.2016.02.068.

Footnote

Electronic supplementary information (ESI) available. See DOI: 10.1039/c6ra22820h

This journal is © The Royal Society of Chemistry 2016