Modeling and experimental study on the solubility and mass transfer of CO2 into aqueous DEA solution using a stirrer bubble column

Hassan Pashaeia, Ahad Ghaemi*b and Masoud Nasiri*a
aDepartment of Chemical, Petroleum and Gas Engineering, Semnan University, Semnan, Iran. E-mail: mnasiri@semnan.ac.ir
bDepartment of Chemical Engineering, Iran University of Science and Technology, Tehran, Iran. E-mail: aghaemi@iust.ac.ir

Received 9th September 2016 , Accepted 27th October 2016

First published on 27th October 2016


Abstract

In this research, the chemical absorption rate and solubility of carbon dioxide into DEA aqueous solutions were investigated in a stirrer bubble column. Experiments envelopment the molarity of DEA, CO2 partial pressures and stirrer speed are 0.2–2.0 M, 300–450 kPa and 0–600 rpm, respectively. The DEA and CO2 concentration and gas–liquid flow rate effects on the mass transfer performance were measured in terms of CO2 capture efficiency, loading, mass transfer flux and mass transfer coefficient. A thermodynamic model, according to the Pitzer's GE model is provided for the equilibrium solubility of CO2 in DEA aqueous solutions. The results have shown that the CO2 loading in range of 0.16–0.40 and mass transfer rate in range of 0.36 × 10⁻⁵ to 0.97 × 10⁻⁵ kmol m−2 s−1 increases with DEA concentration and CO2 partial pressure. Also the results indicate that the quantity of kl increases with addition of DEA concentration, liquid and gas flow rate. Film parameter increases with increasing of DEA concentration and decreases with increasing of CO2 partial pressure. Absorption percent of CO2 was varied in range of 30–57%. The maximum absorption rate of CO2 at partial pressure of 45 kPa has been obtaining 1.8 g min−1 when the DEA concentration is 2.0 M.

1. Introduction

Bubble column reactors are used in a wide range of industrial processes because of their simple design, very complex hydrodynamic behavior, selectivity for the desired product1 and excellent heat and mass transfer properties, especially in the control of mass transfer processes in the liquid phase.2 Stirrer bubble column reactors are used in a diversity of chemical processes, such as Fischer–Tropsch synthesis, oxidation, fermentation and alkylation reactions, effluent treatment and coal liquefaction.3 In the bubble columns, the gas phase exists as a dispersed bubble phase in a liquid phase; thus, the mixing behavior of the liquid phase is mainly affected by the agitating action of rising bubbles.4 Dispersed gas in bubble columns is known to be inherently unsteady and the gas phase moves in one of the homogeneous or heterogeneous regimes.5 Dispersion of gas bubbles in liquids is the fundament of many mass transfer operations in chemical engineering practice.6 The proficiency of stirrer bubble column reactors appertain on the physical bubble characteristic such as gas holdup, bubble size, bubble rise velocity, bubble–bubble interactions and mixing rate. Also the design parameters and the economy of bubble columns are gas–liquid specific interfacial zone, mass transfer coefficient, bubble size distribution, flow regime and coalescence of bubbles.7

Increasing greenhouse gas emissions, especially carbon dioxide, have become a challenging subject in recent decades. CO2 basically to be available in the flue gas of the fossil-fuel fired powerhouse and sour natural gas flows.8 Various technologies including absorption, adsorption, distillation, membranes, separation and biological are available for removing acid gases.9–11 One of the common technologies for CO2 capture is the chemical absorptions or chemical solvents methods.12 High efficiency, low cost, and mature technology are advantages of chemical absorption method as compared to the other methods.13 The most popular chemical solvents for capture of acid gaseous are aqueous alkanolamines, such as diethanolamine (DEA), monoethanolamine (MEA), methyl diethanolamine (MDEA), diisopropanolamine (DIPA), diglycolamine (DGA).14–16 However, in contrast to their wide usage, these solvents have various disadvantages such as oxidative degradation, high volatility and regeneration energy of the primary and secondary amines, and low reaction rate of tertiary amines. Therefore, applying reactive solvents with great absorption capacity and low regeneration energy is very significant for CO2 capture.17,18

Mass transfer flux is one of the most important subjects in the reactive absorption processes. The absorption of CO2 in aqueous solution couples physical and chemical absorption where both kinetics and thermodynamic equilibrium can play considerable impress in illustrating the gas loading.19 However the chemical absorption has a high CO2 recovery capacity and it is suitable for atmospheric pressure. But some problems such as degradation, high energy regeneration, corrosion problem and side are there.20 Several models are available for evaluate the CO2 solubility in alkanolamines aqueous solutions.21 A Pitzer's GE model was used to estimate the species concentrations. According to this model an activity coefficient is based on Debye–Hückel theory22 where the activity coefficients are calculated by the equation of Guggenheim, Kent and Eisenberg23 and Chen and Evans model.24

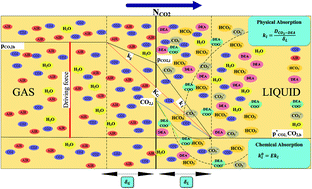
Reactive absorption of CO2 in a thin layer can be explained as combination of chemical reaction and diffusion. In the film model, both gas and liquid phases can be districted into two different stagnant bulk and film regions. Fig. 1 shows the film resistance of CO2 mass transfer from the gas phase into the liquid phase. CO2 molecules will be partially transferred from the vapor to the liquid phase, wherever it is changed to various ionic and molecular species. The mass transfer is confined via resistances in the gas and liquid films. The resistances in both phases are specified by the diffusion coefficients and the film thickness. It is thought which at the interface equilibrium available between gas phase and liquid phase. A detailed description of the common dimensionless numbers in mass transfer of reactive absorption is given in Table 1.


image file: c6ra22589f-f1.tif
Fig. 1 CO2 mass transfer into the liquid phase with chemical reaction based on the film model.
Table 1 The common dimensional numbers in CO2 chemical absorption
Dimensionless parameter Parameter name Definition
image file: c6ra22589f-t1.tif CO2 loading The ratio of total CO2 moles absorbed to total amine moles
image file: c6ra22589f-t2.tif Film parameter Maximum possible conversion in the film per maximum diffusional transport through the film
image file: c6ra22589f-t3.tif Enhancement factor The ratio of the mass flux with chemical reaction to the mass flux without chemical reaction
image file: c6ra22589f-t4.tif CO2 mole fraction CO2 partial pressure to total pressure ratio


This work attempts to improve the study of CO2 capture using DEA solution in a stirrer bubble reactor continuously due to the influence of the chemical structure of the liquid solution upon reaction mechanism, physical properties and mass transfer and hydrodynamic of the stirrer bubble columns. Also mass transfer flux and kinetics of CO2 absorption into DEA solution will be discussed. The mass transfer performance was obtained by doing experiments and modeling in an atmospheric pressure and constant level via process parameters including DEA concentration, liquid and gas flow rate, stirrer speed and partial pressure of CO2.

The secondary objective of this work is to provide additional equilibrium data for CO2 absorption in DEA aqueous solution. In this regard, effort to inquire the profiles of some of the species in the system as a function of CO2 loading was evaluated. A thermodynamic evaluate with the modified Pitzer's model has been carried out for systems combined of acidic gases and aqueous solution of DEA. The condition of vapor–liquid equilibrium is applied to calculate the total pressure and the composition of the gas phase by extended Raoult's and Henry's laws.

2. Theory

2.1. Reactive absorption mechanism

Absorption followed by reaction in the liquid phase often used to get more complete removal of a solute from a gas mixture. At first, component physically absorbed and then reaction with other components at bulk and film layer occurred. When the liquid film resistance is prevailing a quick chemical reaction in the liquid can allow to an increase in the mass transfer rate. The rapid reaction consumes much of the CO2 very close to the gas–liquid interface, which causes the gradient for CO2 steeper and enhances the mass transfer process in the liquid phase. The apparent value proportion of mass transfer coefficient to that for physical absorption defines an enhancement factor E, which ranges from 1.0 to 1000 or more. When absorption is accompanied by a very slow reaction, in this case reaction in the liquid phase in addition to being mass transfer has not increased, but also decreased the amount of mass transfer.26

2.2. Two film theory

The easiest and oldest model which has been proposed for the statement of mass transport processes is the so-called film theory. To illustrate the process, a gas phase is brought in contact with a liquid phase.27 According to this theory a stagnant film of thickness δL is supposed to exist at liquid and gas interface as sketched in Fig. 1. Mass transfer occurs by a steady molecular diffusion through the film. This theory predicts mass transfer rate on the basis of first order dependency. The absorption rate is determined by molecular diffusion in the surface layers. Although the diffusional and turbulence transport will apparently vary on continuous basis with depth below the surface. Therefore it is useful to take as a model a completely stagnant layer having an effective thickness δL, overlying liquid of uniform composition. In the film theory, mass transfer coefficient kl and kg are commensurate to the diffusion coefficient DCO2–DEA and inversely proportional to the film thickness. kl denotes the coefficient of mass transfer for liquid side and equals:
 
image file: c6ra22589f-t5.tif(1)

Similarly, the following equation can be obtained for the mass transfer coefficient in the gas phase:

 
image file: c6ra22589f-t6.tif(2)

The mass transfer coefficient depends on the diffusion coefficient computed by the film theory. However, a number of theoretical problems in the field of chemical absorption and desorption involve such mathematical problems as to allow their solution only for the simple film model.

2.3. Surface renewal theory

Danckwerts proposed the surface renewal theory which is an extension of the penetration theory. It is based on the assumption that the liquid elements do not stay on the same time at the phase interface surface.28
 
image file: c6ra22589f-t7.tif(3)
where NCO2 is CO2 absorption rate, kl is the liquid-side mass transfer coefficient. The model has been applied in the present work because it is considered the more realistic theory29 to analyze absorption processes since it includes the main part of the phenomena involved in these kinds of processes. The enhancement factor of chemical reaction to the surface renewal theory, for the absorption of CO2 is obtained as follow:
 
image file: c6ra22589f-t8.tif(4)
while:
 
image file: c6ra22589f-t9.tif(5)
and:
 
image file: c6ra22589f-t10.tif(6)

Film parameter, M, were calculated as follow:

 
image file: c6ra22589f-t11.tif(7)

3. Experimental study

3.1. Materials

All aqueous DEA solutions used in this work were prepared with degassed distilled water and DEA. DEA was prepared from Sigma-Aldrich with a purity of ≥99%. The gas phase consists of CO2 and air was used in the bubble column. CO2 gas cylinder was of commercial grade with a minimum purity of 99.9% that was supplied by Hor Mehr Tab Gas. Air was supplied from air compressor with the specifications Mahak, AP-301, 300 L capacity. The gases were mixed and passed through pre-calibrated rotameters and a temperature controlled water bath equipped with an electric heater.

3.2. Experimental setup

The absorption experiments were carried out using the experimental setup as shown in Fig. 2. The stirrer column consists of 140 mm i.d in diameter and 0.5 m in height. In order to visualize the flow, the column is made up of transparent glass. The compressed air from the compressor and CO2 gas mixed together in a mix tank and then spared in to the bubble column through a sparger. The sparger plate (75 mm) by six holes (1 mm diameter) is made up of stainless steel to make small bubbles at the bottom of the stirrer bubble column during the absorption process. Some physical properties and operation conditions of stirrer bubble column are given in Table 2. The absorbent temperature is kept constant at temperature 295.15 K. Gas sensor Testo 327-1 model was used to analyze the gas mixture. The physical properties and operation conditions are summarized in Table 3.
image file: c6ra22589f-f2.tif
Fig. 2 Experimental setup for CO2 absorption.
Table 2 Physical properties and operation conditions of CO2 absorption in the stirrer bubble column
Index Value Index Value
Diameter of test section (mm) 140 Partial pressure 0.3–0.45
Height of test section (mm) 500 R (m3 Pa K−1 mol−1) 8.314
Shape Cylindrical DCO2–H2O (m2 s−1) 1.79 × 10⁻⁹
Number of holes in sparger (number) 6 QCO2 (L min−1) 1–2.2
Diameter of sparger (mm) 75 QAir (L min−1) 2.8–5
Diameter of hole sparger (mm) 1 ρAir (kg m−3) 1.22
Mixer type Turbine ρCO2 (kg m−3) 1.98
Disc diameter (mm) 80 ρDEA (kg m−3) 1970
DEA (M) 0.2–2.0 ρH2O (kg m−3) 997.2
Volume of solution (L) 6 σ, surface tension (N m−1) 0.0667
Rotational speed (rpm) 200, 400, 600 μH2O, viscosity of water (Pa s) 0. 85 × 10−3
Pressure (kPa) 80 μAir, viscosity of air (Pa s) 1.983 × 10⁻⁵


Table 3 Operation conditions of the bubble column at dB = 2.009 cm and 295.15 K
Con. (M) μDEA × 10−3 (Pa s)34 DCO2–DEA (m2 s−1) εG S (m2) ΔV × 104 (m3) a (m2 m−3) Stirrer speed (rpm) yCO2-in ΔG (g min−1)
2.0 21.440 0.13 × 10⁻⁹ 0.061 0.078 2.60 19.50 0.30 1.102
200 0.35 1.109
400 0.40 1.112
1.4 10.340 0.24 × 10⁻⁹ 0.064 0.082 2.75 20.67 0.30 0.998
200 0.35 1.013
400 0.40 1.020
0.7 3.240 0.57 × 10⁻⁹ 0.067 0.085 2.86 21.45 0.30 0.822
200 0.35 0.829
400 0.40 0.837
0.2 1.255 1.31 × 10⁻⁹ 0.068 0.088 2.93 21.97 0.30 0.706
200 0.35 0.715
400 0.40 0.721


3.3. Experiments

In all experiments the volume of liquid has been set constant and equal to 6 liter, 39 cm height above the sparger. The gas flow of CO2 and air, 5 L min−1, were measured by two calibrated rotameters separately, and then entered the bottom of the bubble column continuously. A sparger produces bubbles that get in contact with the liquid phase and rise to the top. As the bubbles ascent, interface diffusion takes place. Eventually, equilibrium point is achieved for the specified gas–liquid flow rates. The absorbed gas flows out of the bubble column from the top. Once the gas flow rate becomes stable, the stirrer rotates at the assigned rotational speed. The change of speed is controlled accurately by a dimmer that reaches the desired speed in a sudden manner. The gas superficial velocity and dimensionless number of Reynolds is 14.15 m s−1 and 3573 respectively. The inlet CO2 to the bubble column was measured by a flow meter. The absorption rate was calculated as the difference between inflow and outflow of CO2 concentration by CO2 gas sensor. Due to the pressure and temperature is constant, can be acquired the adsorbed number of moles in the sample from the PQin/RT and also, all absorbed moles of carbon dioxide obtained from different inlet and outlet of CO2 moles. Gas holdup and diameter of bubbles are obtained from the following semi-empirical equations:30,31
 
image file: c6ra22589f-t12.tif(8)
 
dB = 1.543 × uG−0.12 × D−0.3, assumption ds = dB (9)

The gas–liquid interfacial area can be calculated using the Sauter mean diameter ds and the gas holdup:32

 
image file: c6ra22589f-t13.tif(10)
where dB and ds are means bubble size distribution and Sauter diameter of the bubble size distribution respectively. The diffusion coefficient of carbon dioxide in DEA solution obtained from the following equation:33
 
image file: c6ra22589f-t14.tif(11)
 
image file: c6ra22589f-t15.tif(12)

In addition, the percentage of CO2 removal efficiency was computed with the following equation:

 
image file: c6ra22589f-t16.tif(13)

Table 3 shows the bubble characteristics based on the above equations.

The gaseous CO2 molecules diffuse from the gas film to the gas–liquid interface. The gaseous CO2 in the gas–liquid interface dissolves agreeing the Henry's law. The dissolved CO2 is significantly consumed near the interface according to reaction with the amine. The slope of the CO2 concentration profile defines the mass transfer coefficients. To calculate the mass transfer flux in chemical absorption, the consequence of chemical reactions on the mass transfer is done using enhancement factor (E). The enhancement factor is given in eqn (14)30 defined as the ratio of the mass flux CO2 through the interface with chemical reaction and driving force image file: c6ra22589f-t17.tif to the mass flux through the interface without chemical reaction. However with the same driving force can be acquired from the calculated concentration profiles. Enhancement factor shows that it is function of components concentration and reaction type in process could be bigger or equal to one. Enhancement factor is usually acquired by laboratory result or theoretical evaluation via models that have shortening assumptions. This factor increases via increasing the reactions rate. For slow reactions its amount is one.35

 
image file: c6ra22589f-t18.tif(14)
where NCO2 is CO2 mass transfer flux that can be achieved from division the number of moles adsorbed on the contact surface bubbles, kl is mass transfer coefficient in liquid side and image file: c6ra22589f-t19.tif are total free CO2 concentrations at the interface and liquid bulk, respectively.

4. VLE thermodynamic modeling

4.1. Chemical equilibrium in the liquid phase

When CO2 is absorbed in DEA solutions, many chemical reactions happen in the liquid phase. The model used to predict the carbon dioxide solubility brings up the following equilibriums for the chemical species in the liquid phase.

Dissociation of the protonated DEA:

 
image file: c6ra22589f-t20.tif(15)

Formation of carbonate (primary and secondary amines):

 
image file: c6ra22589f-t21.tif(16)

Dissociation of CO2:

 
image file: c6ra22589f-t22.tif(17)

Dissociation of bicarbonate ion:

 
image file: c6ra22589f-t23.tif(18)

Ionization of water:

 
image file: c6ra22589f-t24.tif(19)

The condition for chemical equilibrium for a chemical reaction x is:

 
image file: c6ra22589f-t25.tif(20)
where (i) is refers to the reaction number. Thus, the corresponding thermodynamic equilibrium constant expressions can be written.
 
image file: c6ra22589f-t26.tif(21)
 
image file: c6ra22589f-t27.tif(22)
 
image file: c6ra22589f-t28.tif(23)
 
image file: c6ra22589f-t29.tif(24)
 
image file: c6ra22589f-t30.tif(25)
where γi is the activity coefficient of each species. The thermodynamic equilibrium constants, Kx(T) for all the chemical reactions are expressed in the form:
 
image file: c6ra22589f-t31.tif(26)

Constants for the calculation of the various Kx as a function of temperature as well as their sources for all of the reactions (21)–(25) are given in Table 4.

Table 4 Chemical equilibrium constant for the chemical reaction x, expressed on the molality scale
Parameter C B A Ref.
K1 6.7769 −3071.1 −48.759 36
K2 325.3375 105[thin space (1/6-em)]892.2 −2221.140 25
K3 −36.7816 −12[thin space (1/6-em)]092.1 235.482 37
K4 −35.4819 −12[thin space (1/6-em)]431.7 220.067 37
K5 −22.4773 −13[thin space (1/6-em)]445.9 140.932 37


Moreover the above equilibrium equations, overall DEA and CO2 concentrations (mol kg−1) an also charge balance must be acquiescence. In the balance equations for DEA and CO2 in the liquid phase, eqn (27) and (28), C0DEA denotes the stoichiometric DEA concentration and α indicates the CO2 loading, represented as total moles of CO2 absorbed both physically and chemically per DEA moles.

Amine mass balance:

 
C0DEA = (CDEA + CDEAH+ + CDEACOO) (27)

CO2 mass balance:

 
αCO2C0DEA = (CCO2 + CHCO3 + CCO32− + CDEACOO) (28)

Electroneutrality:

 
CH+ + CDEAH22+ = COH + CHCO3 + 2CCO32− + CDEACOO (29)

Solving this set of 8 independent equations (eqn (21)–(25) and (27)–(29)) for a given temperature, DEA overall concentration, and CO2 loading consequence in the real liquid phase equilibrium composition, statement as the molality of each species (mol kg−1), needed for solving the equations.

4.2. Vapor–liquid equilibrium

In the gas phase, the DEA vapor pressure is very little, so DEA in the gas phase could be neglected. The vapor–liquid equilibrium (VLE) condition is used to compute the total pressure and the gas phase composition. The extended Raoult's law is applied to express the VLE for water (eqn (30)), and the extended Henry's law is used to express the equilibrium for CO2 (eqn (31)).
 
image file: c6ra22589f-t32.tif(30)
 
image file: c6ra22589f-t33.tif(31)

Assuming that the DEA in the gas phase is negligible, therefore the ratio of φsatw/φw will be unit. The VLE calculation requires the knowledge of the Henry's constants for the CO2 solubility in water. The vapor pressure psatw and the molar volume Vw of pure water, pure component second virial coefficient according Table 7, the mixed second virial coefficients BCO2 were calculated due to the correlations of Hayden and O'Connell.38 The partial molar volumes image file: c6ra22589f-t34.tif of CO2 dissolved at infinite dilution in water were calculated as recommended by eqn (33). The Henry's constant for CO2 are expressed in the following form:39

 
image file: c6ra22589f-t35.tif(32)

Values of the Henry's constant are taken from the literature as given in Table 5.

 
image file: c6ra22589f-t36.tif(33)

Table 5 Henry's constant for the DEA, CO2 and H2O system37
A B C D
94.4914 −6789.04 −0.010454 −11.4519


The water vapor pressure is calculated from the following equation:

 
image file: c6ra22589f-t37.tif(34)
 
image file: c6ra22589f-t38.tif(35)
where Tc and pc are 647.096 K and 22.064 MPa, respectively. The constants of eqn (34) are presented in Table 6.

Table 6 Constants of eqn (34) (ref. 40)
a1 a2 a3 a4 a5 a6
−7.8595 1.8441 −11.7866 22.6807 −15.9619 1.8012


Fugacity coefficient of CO2 in the gas phase can be calculated as the virial equation of state:39

 
image file: c6ra22589f-t39.tif(36)
 
image file: c6ra22589f-t40.tif(37)

4.3. Pitzer's GE model for activity coefficients

Several models are presented to characterize the VLE of CO2 in aqueous amines solutions in the literature. Among them, Kent and Eisenberg23 and the Deshmukh and Mather21 models are frequently used. However the former one does not take into account the activity coefficients in solution and the latter is limited to low concentration because the activity coefficients are calculated with Guggenheim's equation. Activity coefficients of both molecular and ionic species were calculated using a modified Pitzer model for the excess Gibbs energy of aqueous electrolyte solutions:41
 
image file: c6ra22589f-t41.tif(38)
where f1(I) is a modified Debye–Hückel term depending on ionic strength (I), temperature, and solvent properties, λij(I) is the ionic strength dependent second virial coefficient:
 
image file: c6ra22589f-t42.tif(39)
 
image file: c6ra22589f-t43.tif(40)
where x = 2(I)1/2. To estimate the activity coefficients of the solute species follows from the appropriate derivative of GE, the equation proposed by Guggenheim42 which is an extension of Debye–Hückel22 theory is used:
 
image file: c6ra22589f-t44.tif(41)

Here, the first term indicative the solvent electrostatic effects on the solute species at infinite dilution; the remaining term takes into account short-range van der Waals forces and βij is the interaction parameter for two solute species. The quantity Aφ is related to the dielectric constant of the solvent that a function of temperature as proposed by Lewis et al.43 and B equals to 1.2 as suggested by Pitzer.44 The ionic strength, I, of the solution was calculated using the following equation:

 
image file: c6ra22589f-t45.tif(42)

The quantity Aφ is the Debye–Hückel parameter for the osmotic coefficient. It is related to the dielectric constant of the solvent and the taken as a function of temperature:43

 
Aφ = −1.306568 + 0.01328238 × T − (0.355080 × 10⁻⁴) × T2 + 0.338197 × 10⁻⁷) × T3 (43)

The activity of water is determined from Gibbs–Duhem equation as follows:

 
image file: c6ra22589f-t46.tif(44)
where, Mw is 0.018 kg mol−1. The Pitzer's model has been used to estimate the species concentrations in the liquid bulk and solubility data. The set of eqn (21)–(25) and (31) are solved together with the electric charge balance (29) and the mass balance for the amine (27) to determine the concentrations of all components, provided all the equilibrium constants K1K5, the Henry's constant for CO2, the activity coefficients of all the different species, the activity of water which can be calculated using Gibbs–Duhem equation, the total concentration of amine and the partial pressure of CO2 are known. Once the concentrations of all species are calculated, the mass balance equation for CO2 (28) permits the calculation of CO2 loading.

Interaction parameters, βij, between the different ionic and molecular species in the system are represented by Pitzer and Mayorga45 in the following form:

 
βij = β(0)ij = aij + bij × T (K) and β(1)ij = 0.018 + 3.06 × β(0)ij (45)

Parameters aij, bij are summarized in Table 7. In this system, eight species are available in the liquid phase: CO2, CO32−, HCO3, DEACOO, DEAH+, DEA, H+ and OH. Due to the very low concentration of H+ and OH with respect to the other species, their interactions with all other species were ignored. Therefore the corresponding interaction parameters were set to zero. All ternary interaction parameters between species were also set to zero. To additionally reduce the number of parameters, all binary interaction parameters involving species with the same sign of charge were ignored. Only the parameters which were found to have a significant effect on the liquid phase distribution of the species were optimized based on the experimental data. The values of interaction parameters are given in Table 7. A sensitivity study showed that all other possible interaction parameters that appear in the expressions for the activity coefficients (eqn (41) and (45)) can be neglected without reducing the accuracy of the VLE representation of this system.

Table 7 Species interaction parameters in Pitzer's GE equation for DEA–CO2–H2O system46
Ions/molecules interactions (L mol−1) aij (L mol−1) bij (L K mol−1)
DEAH+–DEA 0.801 × 10⁻³ −0.150 × 10⁻³
DEAH+–CO2 0.398 −0.199 × 10⁻⁸
DEAH+–DEACOO 4.700 −0.116 × 10⁻¹
DEAH+–HCO3 0.377 −0.678 × 10⁻⁶
DEA–DEA 0.703 −0.316 × 10⁻⁷
DEA–CO2 0.805 × 10⁻⁵ −0.130 × 10⁻⁶
DEA–DEACOO 1.919 −0.491 × 10⁻²
DEA–HCO3 4.521 −0.129 × 10⁻¹
CO2–DEACOO 0.184 × 10⁻⁵ −0.651 × 10⁻⁷
CO2–HCO3 0.661 × 10⁻³ −0.679 × 10⁻³


The CO2 loading (α) was computed using eqn (46). The quantity of absorbed CO2 was specified using the inlet and outlet gas flow rate by integration.47

 
image file: c6ra22589f-t47.tif(46)

4.4. Mass transfer regime in chemical absorption

The influence of a reaction on the absorption rate can be expressed by a dimensionless ratio Hatta number or film parameter and enhancement factor. Extent of reaction can also be identified by the relative rates of diffusion and reaction. M is film parameter which is used to see the effect of chemical reactions in mass transfer flux.48 Film parameter is maximum possible conversion in the film per maximum diffusional transport through the film. In order to compute the film parameter, all reactions of CO2 should be considered. Reactions of DEA with CO2 contain hydrolysis of monocarbamate DEA, as a second order reaction rate mechanism.41
 
image file: c6ra22589f-t48.tif(47)
where the total reaction rate kapp is supposed thoroughly being specified by the following equation.
 
image file: c6ra22589f-t49.tif(48)

Depending on the value of M and the ratio between M and E, three absorption regimes can be distinguished. For M < 0.3 and E = 1, the reaction is too slow and the rate of reaction is faster than diffusional transfer of solute to liquid phase. This transfer of solute is rate controlling step. Mass transfer coefficient and absorption flux will depend on liquid flow rate.49 If 3 < ME, the reaction will be fast, diffusion and chemical reactions are proceeding parallel. The liquid phase retention time is not of considerable importance because all reaction takes place in reaction film. When 3 < EM and E = E applies for instantaneous reaction regime. The reaction is too fast in case of irreversible reaction, the reactants cannot co-exist in film.50

4.5. Chemical reactions

The CO2 reaction with alkanolamines is of enormous significance. In aqueous solution of DEA, the absorption of CO2 can be investigated as an incorporation of various reactions32,51,52 inclusive CO2–OH, CO2–DEA and CO2–DEACOO.
 
CO2 + OH ↔ HCO3 (49)
where:
 
rCO2–OH = kOHCOHCCO2 (50)

The bicarbonate formation reaction rate constant in eqn (49) is apparent by Pinsent et al.53

 
image file: c6ra22589f-t50.tif(51)

Two mechanisms Zwitterion and single-step termolecular are presented in the literature to describe the chemical interactions available between primary or secondary amines and CO2. Zwitterion mechanism was presented for the first time by Caplow54 and reintroduced by Danckwerts.55 The zwitterion mechanism inclusive of two steps: firstly, the reaction between carbon atom of the CO2 molecule and the free electronic of amine proceeds through the produce of intermediate called zwitterions:

 
image file: c6ra22589f-t51.tif(52)

Second step, the deprotonated of the zwitterion complex by any base B present in the solution, such as hydroxyl ion, water or an amine-functionality, to generate a combine called carbamate.

 
image file: c6ra22589f-t52.tif(53)

In the zwitterion deprotonation, the portion of each basis depends on its concentration, basicity and steric hindrance. In aqueous solutions, the corresponding reactions are as follows:

 
image file: c6ra22589f-t53.tif(54)
 
image file: c6ra22589f-t54.tif(55)
 
image file: c6ra22589f-t55.tif(56)

The overall forward reaction rate can be derived using the quasi-steady-state condition to the intermediate zwitterion concentration:56

 
image file: c6ra22589f-t56.tif(57)

Versteeg and van Swaaij57 concluded that portion of hydroxyl ion in aqueous DEA solution to the remove protonation of the zwitterions can be ignored as far it's very low concentration. So that eqn (57) reduces to:

 
image file: c6ra22589f-t57.tif(58)

In a general form:

 
image file: c6ra22589f-t58.tif(59)
where the kinetic constant ∑kbCB demonstrator the contribution to the proton removal of the zwitterion by any base such as CO32−, HCO3, H2O, OH or DEA, as also by compound of bases. For the absorption of CO2 into aqueous DEA solution, the overall reaction rate can be expressed as follows:
 
rCO2 = rCO2–DEA + rCO2–OH = kappCCO2 (60)

Thus:

 
image file: c6ra22589f-t59.tif(61)

The contributions of the CO2 reactions with hydroxyl ion to the remove proton in the overall reaction rate is supposed to be negligible.58 The apparent kinetic rate constant (kapp) can be specified as:

 
kapp = kov + kOHCOH (62)
where kapp is the apparent rate of the reaction calculated as follows:
 
image file: c6ra22589f-t60.tif(63)

The kinetic constants of CO2 into DEA solutions are provided in Table 8.

Table 8 Literature data on the reaction between CO2 and DEA
Constant Unit Value Ref.
image file: c6ra22589f-t61.tif L2 mol−2 s−1 1101 59
image file: c6ra22589f-t62.tif L2 mol−2 s−1 1.71 57
k2 L mol−1 s−1 3977 59
kOH L mol−1 s−1 6698 53


In the solution of the equations, the Newton's iteration technique was employed for determination of the activity and concentration of species in the CO2–DEA–H2O systems. The method can be extended to complex functions and to systems of equations. Newton's method is an algorithm for finding the roots of differentiable functions that uses iterated local linearization of a function to approximate its roots.

5. Results and discussion

5.1. CO2–DEA–H2O solubility

The solubility of CO2 in 0.2–2.0 M DEA aqueous solutions were obtained at fixed temperature of 295.15 K at partial pressures of CO2 ranging from 1 to 10 kPa. In applying the Pitzer's model, the values of K1K5 that are reported in the literature (Table 4) were used to analyze the data. As indicated earlier only ten interaction parameters in the CO2–DEA–H2O system have been found to be significant. These parameters are given in Table 7. The equilibrium constant Kx was computed at different temperatures and fitted according to eqn (26) to give the various constants as shown in Table 4. The interaction coefficients were obtained using reliable solubility data from literature for the model, able to cover large temperature, pressure, and amine composition ranges. The partial pressure of CO2, in the vapor phase was as a result simply derived as the difference between the total measured pressure and the vapor pressure of the CO2-free, aqueous DEA solution. A comparison of solubility of CO2 in DEA solution is shows in Fig. 3. All data repeated three times and the average is reported. Fig. 3 shows that near 0. 3 loading the solution of 2 M have a higher CO2 partial pressure than the 1.4 M DEA data, which is higher than the 0.7 M and 0.2 M DEA CO2 partial pressure. In other hand, with increasing DEA concentration in the solution, CO2 loading decreases at a given temperature. This means that DEA has a positive effect on CO2 solubility.
image file: c6ra22589f-f3.tif
Fig. 3 Effect of CO2 partial pressure on the solubility of DEA solution at 295.15 K.

5.2. Species activity and concentration

The concentration profiles of the different species in the CO2–DEA–H2O system and their activity coefficient using the modified Pitzer model were shown respectively in Fig. 4 and 5. Since H+, OH, and DEAH+ concentrations are very less than the concentrations of all other species, the respective curves were not demonstrated. The free DEA concentration decreases quickly by increasing loading, while this reduction is accompanied by a steady increase in the concentrations of protonated DEA as well as that of HCO3. It was found that at low partial pressure and loading, further of CO2 absorbed into the solution is in the form of carbamate by a small value in the form of bicarbonate. When the loading increases, the trend is reversed where the attendance of bicarbonate is considerable. Open the whole range of CO2 loading, free CO2 is only present in trace amounts and it only appears in the solution at high loadings regularly above 0.7. The formation of carbamate from DEA is rapid and the equilibrium is arrived quickly. It shows that at low pressure, CO2 is rather absorbed into DEA. When the concentration of CO2 stoichiometric is less than that of DEA, CO2 is actually entirely chemically dissolved and mainly converted preferentially into DEA carbamate, DEA dicarbamate, and protonated DEA species. In addition, the carbamate concentration is very low, which is compatible by the treatment of the sterically prevented amines.
image file: c6ra22589f-f4.tif
Fig. 4 species concentrations on the liquid phase at 0.7 M DEA aqueous solution at yCO2-in = 0.3, obtained using the modified Pitzer model.

image file: c6ra22589f-f5.tif
Fig. 5 Species activity coefficients in the H2O–CO2–DEA system at 0.7 M DEA solution and yCO2-in = 0.3, using the modified Pitzer model.

Also, Fig. 6 illustrate the influence of free DEA in various concentrations of amine on CO2 mass transfer flux. It is obvious that mass transfer flux extremely belongs on the free DEA existing in the solution. Also increase in the amine concentration conduce enhance in free DEA and this afford mass transfer flux to increase.


image file: c6ra22589f-f6.tif
Fig. 6 The effect of free DEA concentration (calculated from the presented model) on CO2 mass transfer flux (experimental data) at CO2 volume fraction 0.3–0.45 (% v/v).

5.3. Absorption rate

Fig. 7 shows the effect of different partial pressure on CO2 removal efficiency at various DEA concentrations. It can be seen that the performance of 2.0 M of DEA solution was better than another one. With the increase in the DEA concentration, from 0.2 to 2.0 M, the capture of CO2 enhanced from 30 to 56%. This is because at higher DEA concentration, higher value of free amine molecules was disposal to react with CO2 in the liquid phase. As well as reduction of CO2 loading capacity in the liquid phase which reduces the resistance in the liquid film. Where the CO2 capture in DEA solution is controlled by the resistance in the liquid phase, the mass transfer efficiency was increased in the process. Hence, the increase in liquid concentration has a considerable influence on the mass transfer performance.
image file: c6ra22589f-f7.tif
Fig. 7 Effect of different DEA concentrations on CO2 removal efficiency.

To survey the absorption system in the stirrer bubble column, the evaluation in the absorption rate of DEA solution were conducted out in two cases; with and without stirrer working for the test section. Fig. 8 shows CO2 absorption rate into DEA solution versus absorption time at 295.15 K and atmospheric pressure. It shows the absorption rates at different DEA aqueous solution from 0.2 to 2.0 M. It can be seen that in the beginning, there is a high rate of absorption which is dependent of DEA concentration. This is due to the consumption of the convenience existing dissolved alkalinity. After that, the number of active sites available in solution for CO2 perch there was less and causes the decrease of driving force. By decreasing the driving force the absorption rate reduce until the reaction has arrived a respectively steady level and also absorption rates for all solution are lower than 2.0 kmol m−2 s−1. It is clearly implied that the speed of stirrer enhance the absorption performance in all dissolved. It is also found that the absorption performance at high concentration of DEA with stirrer is better than that without stirrer.


image file: c6ra22589f-f8.tif
Fig. 8 Effect of stirrer speed on absorption rate at different DEA solution: (A) 0.2 M, (B) 0.7 M, (C) 1.4 M and (D) 2.0 M.

Fig. 9 indicates the evolution of pH profile at the continuous mode examine. It is revealed that all the solutions have similar initial pH values (∼10.6). In the beginning, all the dissolved carbon dioxide gas instantly reacts with hydroxide ions (OH) and is conversion to carbonate (CO32−) and pH drops very fast. Therefore, only small traces of dissolved carbon dioxide gas placed near the bubbles are apperceived while due to the utilization of initial total DEA the bicarbonate (HCO3) concentration is little. With increasing of solution conversion, the concentrations of DEAH+ and HCO3 rise, this can be described via a base catalyst mechanism. At the lower conversion, the carbamate is formed rapidly and then decreases slowly at the higher conversion. When the pH value becomes low sufficient, the DEA conversion to HCO3 becomes higher and postpone the formation of DEACOO. Therefore due to conversion of DEA to DEA carbamate and protonated DEA, the concentration of free DEA becomes low but the value of DEA is still important for absorption of CO2.


image file: c6ra22589f-f9.tif
Fig. 9 pH profile of 4 different concentrations of DEA solutions at gas and liquid flow rate 5.0 L min−1 and 5.0 L h−1 respectively and yCO2-in = 0.3.

Fig. 10 shows the effect of CO2 loading on mass transfer flux at 295.15 K. As it can be seen by increasing the CO2 partial pressure, mass transfer flux of CO2 increases and this is obvious because the increase in the partial pressure of CO2 in gas phase leads to increase in the driving force of mass transfer. In a constant pressure ratio, increase in loading leads to decrease in mass transfer flux which is because of decrease in driving force of mass transfer. Also Fig. 10 shows that when the concentration is increased at constant temperature and interfacial CO2 partial pressure, the flux has been augmented, as well. This enhancement is commonly ascribed to the presence of more free and active DEA in the solution to react by CO2.


image file: c6ra22589f-f10.tif
Fig. 10 Mass transfer fluxes of CO2 at different partial pressures with gas flow rate of 5.0 L min−1 and liquid flow rate of 5.0 L h−1.

In order to study the performance of difference DEA solutions in parameters of loading capacity, the CO2 solubility, the constants mass flow and the relative between model predictions and experimental data was evaluated at ambient temperature and atmospheric pressure as listed in Tables 9–11. It is observed that at the same CO2 partial pressure, the CO2 loading increased with increasing DEA concentration in the solution. Also in Table 9, highest CO2 mass transfer rates were achieved in 2.0 M DEA solution over the entire range of CO2 loadings.

Table 9 Experimental data and calculation results of CO2 absorption into aqueous DEA solutions, at 80 kPa, 295.15 K and HCO2,H2O = 131.136 × 10² (kPa kg kmol−1)
Con. (M) yCO2,in COH × 104 (M) NCO2 × 105 (kmol m−2 s) CDEA (M) CDEACOO (M) pCO2,b (kPa) pCO2,i (kPa)

image file: c6ra22589f-t63.tif

(kPa)

image file: c6ra22589f-t64.tif

(M)

image file: c6ra22589f-t65.tif

(M)
2.0 0.30 45.7 5.89 1.141 0.123 0.151 0.114 0.065 0.444 0.513
2.0 0.35 46.0 7.12 1.139 0.123 0.139 0.136 0.081 0.482 0.513
2.0 0.40 46.7 8.28 1.13 0.124 0.164 0.160 0.092 0.504 0.522
2.0 0.45 48.1 9.69 1.159 0.121 0.190 0.185 0.095 0.511 0.518
1.4 0.30 18.9 5.18 0.868 0.077 1.96 1.90 0.852 0.294 0.353
1.4 0.35 19.4 6.35 0.867 0.077 2.34 2.27 0.996 0.319 0.355
1.4 0.40 19.5 7.42 0.866 0.077 2.73 2.65 1.089 0.340 0.356
1.4 0.45 20.3 8.69 0.867 0.077 3.12 3.03 1.155 0.339 0.357
0.7 0.30 0.4 4.27 0.470 0.019 2.18 2.12 0.431 0.050 0.353
0.7 0.35 0.4 5.05 0.467 0.020 2.57 2.49 0.503 0.053 0.355
0.7 0.40 0.4 5.99 0.468 0.020 2.97 2.88 0.533 0.054 0.356
0.7 0.45 0.4 6.90 0.461 0.020 3.36 3.26 0.563 0.055 0.357
0.2 0.30 0.1 3.63 0.142 0.001 2.33 2.26 0.144 0.054 0.092
0.2 0.35 0.2 4.38 0.147 0.001 2.74 2.65 0.168 0.057 0.097
0.2 0.40 0.2 5.12 0.144 0.001 3.13 3.03 0.171 0.058 0.099
0.2 0.45 0.3 6.62 0.142 0.001 3.53 3.42 0.174 0.058 0.094


Table 10 Experimental data and calculation results for DEA solution at 295.15 K
Con. (M)

image file: c6ra22589f-t66.tif

kg × 105 δl × 105 δg × 105 kapp KG × 107 kl × 105 kl × 109 rCO2
2.0 0.30 196.33 1.10 0.0070 1168 1.13 1.19 1.20 4.06
2.0 0.35 237.33 0.91 0.0057 1165 1.23 1.43 1.29 4.59
2.0 0.40 207.00 0.76 0.0067 1153 1.15 1.71 1.22 5.22
2.0 0.45 193.80 0.67 0.0070 1201 1.02 1.93 1.08 6.05
1.4 0.30 0.49 2.22 4.855 727 4.68 1.08 4.90 3.36
1.4 0.35 0.50 1.65 4.815 727 4.72 1.46 4.98 3.78
1.4 0.40 0.47 1.35 5.049 725 4.52 1.78 4.75 4.27
1.4 0.45 0.46 1.15 5.178 727 4.42 2.08 4.63 4.86
0.7 0.30 7.12 8.05 0.800 248 7.12 0.71 2.53 1.49
0.7 0.35 6.31 6.79 0.902 245 6.32 0.84 2.54 1.73
0.7 0.40 6.65 5.73 0.867 245 6.65 0.99 2.55 1.73
0.7 0.45 6.90 4.97 0.825 240 6.90 1.15 2.56 2.16
0.2 0.30 5.18 1.39 2.527 34 5.18 9.40 1.72 0.23
0.2 0.35 4.86 1.20 2.694 34 4.86 10.91 1.76 0.27
0.2 0.40 5.117 1.06 2.560 33 5.12 12.36 1.79 0.31
0.2 0.45 6.021 0.71 2.175 33 6.02 18.55 2.04 0.34


Table 11 Dimensionless numbers results of CO2 reactive absorption in DEA solution
Con. (M)

image file: c6ra22589f-t67.tif

image file: c6ra22589f-t68.tif

α δg/δl M EFM ESR
2.0 0.30 0.11 0.23 0.006 33 133.0 5.8
2.0 0.35 0.12 0.28 0.006 27 118.4 5.3
2.0 0.40 0.14 0.32 0.008 23 93.1 4.9
2.0 0.45 0.15 0.38 0.01 21 73.3 4.6
1.4 0.30 0.13 0.21 2.209 39 6.0 6.3
1.4 0.35 0.14 0.26 3.006 29 4.5 5.4
1.4 0.40 0.16 0.30 3.923 23 3.5 4.9
1.4 0.45 0.18 0.36 4.333 20 2.9 4.6
0.7 0.30 0.16 0.18 0.099 53 4.7 7.4
0.7 0.35 0.19 0.21 0.132 45 4.0 6.7
0.7 0.40 0.21 0.25 0.151 38 3.4 6.2
0.7 0.45 0.24 0.29 0.164 32 2.9 5.8
0.2 0.30 0.18 0.16 1.698 2 0.2 1.8
0.2 0.35 0.21 0.19 2.242 2 0.2 1.7
0.2 0.40 0.24 0.26 2.415 2 0.2 1.6
0.2 0.45 0.27 0.29 3.100 2 0.1 1.5


Fig. 11 shows the variation in enhancement factor with film parameter in various DEA concentrations. From this figure can be consummate that, by increasing the concentration of DEA, the slope of enhancement factor alterations increases and this means that the absorption process occur faster in higher concentrations. Moreover, in lower concentrations, enhancement factor decreases and as this factor is commensurate to mass transfer flux. Also by increasing the concentration, mass transfer flux increases; this is obvious because absorption driving force is increase.


image file: c6ra22589f-f11.tif
Fig. 11 The effect of film parameter on enhancement factor at various DEA concentrations at CO2 volume fraction 0.3–0.45 (% v/v) and gas and liquid flow rate 5.0 L min−1 and 5.0 L h−1 respectively.

Diversity of the film parameter with CO2 loading is described at three different concentrations in Fig. 12. The consequence represent that in constant of DEA concentration, solution with less loading has great film parameter. Also the result shows that the film parameter was decreased by increasing of DEA concentration in the constant loading.


image file: c6ra22589f-f12.tif
Fig. 12 Variation of film parameter with loading at different DEA concentrations, CO2 volume fraction 0.3–0.45 (% v/v), gas flow rate 5.0 L min−1, liquid flow rate 5.0 L h−1.

The effect of CO2 partial pressure on the reaction rate was considered in Fig. 13. It can be derived that, by increasing the concentration of DEA, the numerous of activate site increases and it because of the reaction rate increase. Also, in DEA constant concentration, solution with less CO2 partial pressure has low activate molecules, it because of reaction rate to decrease.


image file: c6ra22589f-f13.tif
Fig. 13 Effect of the presence of CO2 on the overall reaction rate, gas flow rate 5.0 L min−1 and liquid flow rate 5.0 L h−1.

6. Conclusion

The mass transfer performances, solubility and absorption rate of CO2 into aqueous DEA solution have been investigated experimentally and theoretically using a stirrer bubble column. In the experiments, the increase in stirring speed consequence in increasing the mass transfer rate, indicative the diffusive mass transfer regime. The reaction between CO2 and free DEA in aqueous solutions was described with zwitterion mechanism. A mathematical model is provided based on the Pitzer's GE model has been studied to evaluate the solubility of CO2 and carbamate concentration for the absorption of CO2 in DEA aqueous solution. The activity coefficients were obtained using modified Pitzer's thermodynamic model and experimental data for CO2–DEA–H2O system. The experimental analysis of the film parameters are near to the quantity regarding to the fast reaction and the rate of reaction is faster than diffusional transfer of solute. The absorption rates of CO2 into DEA aqueous solution increases by increasing the stirrer speed. It was also observed that the effect of stirrer in high concentration of DEA is more than dilute solution.

Appendix A

The adsorbed number of moles in the column can be acquired from the following equation:
 
image file: c6ra22589f-t69.tif(A.1)

The absorption rate is calculated by the following equation:

 
GCO2,in = yCO2,in × Gin and GAir,in = GinGCO2,in and GAir,in = GAir,out (A.2)
where Gin, GCO2-in and GCO2-out represent absorption rate, initial and final mass of the solution, respectively. Also:
 
yAir,out = 1 − yCO2,out (A.3)
 
image file: c6ra22589f-t70.tif(A.4)

All models of absorbed CO2 are calculated as follow:

 
ΔG = GCO2,inGCO2,out (A.5)

Appendix B

Two film theory

The mass balance in the film area was obtained as follow:
 
NAzS|zNAzS|zzrASΔz = 0 (B.1)
where rA is the rate of CO2 reaction in the film area.
 
image file: c6ra22589f-t71.tif(B.2)
 
image file: c6ra22589f-t72.tif(B.3)

From combining the eqn (B.2) and (B.3) for physical adsorption:

 
image file: c6ra22589f-t73.tif(B.4)

While the boundary limits are:

 
z = 0, CCO2 = CO2,i (B.5)
 
z = δL, CCO2 = CO2,b (B.6)

Integrating and applying boundary conditions yields.

 
image file: c6ra22589f-t74.tif(B.7)

The mass transfer flux will then be:

 
image file: c6ra22589f-t75.tif(B.8)

kl denotes the coefficient of mass transfer for liquid side and equals:

 
image file: c6ra22589f-t76.tif(B.9)

Similarly, the following equation can be obtained for the mass transfer coefficient in the gas phase:

 
image file: c6ra22589f-t77.tif(B.10)

Eqn (B.11) describes the mass transfer flux equations which can be written using the variety mass transfer coefficients.

 
image file: c6ra22589f-t78.tif(B.11)
where, pCO2,b is the operational partial pressure of CO2 in the bubble column, which was calculated by the logarithmic average:
 
image file: c6ra22589f-t79.tif(B.12)

pCO2,i is equilibrium CO2 partial pressure that is measured by classification both absorption and desorption data near equilibrium. The CO2 partial pressure at the gas–liquid interface is calculated by:

 
pCO2,i = (ppsat(w+DEA))yBM (B.13)
where:
 
image file: c6ra22589f-t80.tif(B.14)

The flux in eqn (B.11) is constant and combining these equations results a series resistance relationship among the mass transfer coefficients. In the mass transfer process between the gas and the liquid phase, the total resistance to mass transfer was modeled as the sum of gas film and liquid film resistance:

 
image file: c6ra22589f-t81.tif(B.15)

kl can also be expressed as:

 
image file: c6ra22589f-t82.tif(B.16)

Appendix C

Surface renewal theory

The following equations between the various parameters are established:
 
image file: c6ra22589f-t83.tif(C.1)
 
image file: c6ra22589f-t84.tif(C.2)
 
image file: c6ra22589f-t85.tif(C.3)

From combining the eqn (C.2) and (C.3) for physical adsorption:

 
image file: c6ra22589f-t86.tif(C.4)

Boundary conditions include:

 
z = 0, CCO2 = CO2,i (C.5)
 
z = ∞, CCO2 = 0 (C.6)

The initial condition is defined as follows:

 
t = 0, CCO2 = 0 (C.7)

Take Laplace from eqn (C.1):

 
image file: c6ra22589f-t87.tif(C.8)
 
image file: c6ra22589f-t88.tif(C.9)
 
image file: c6ra22589f-t89.tif(C.10)

By combining the above equations:

 
image file: c6ra22589f-t90.tif(C.11)

General solution of the equation will be as follows:

 
image file: c6ra22589f-t91.tif(C.12)

Take Laplace the boundary conditions:

 
image file: c6ra22589f-t92.tif(C.13)
 
image file: c6ra22589f-t93.tif(C.14)

By substituting eqn (C.11) in (C.9):

 
image file: c6ra22589f-t94.tif(C.15)

From the initial condition as will be following:

 
image file: c6ra22589f-t95.tif(C.16)
 
image file: c6ra22589f-t96.tif(C.17)

According to the Danckwerts assumptions:

 
image file: c6ra22589f-t97.tif(C.18)

By substituting the eqn (C.15) in to the eqn (C.17):

 
image file: c6ra22589f-t98.tif(C.19)
 
image file: c6ra22589f-t99.tif(C.20)

By substituting film parameter in above equation will be:

 
image file: c6ra22589f-t100.tif(C.21)

By writing Fick's law at the interface:

 
image file: c6ra22589f-t101.tif(C.22)
 
image file: c6ra22589f-t102.tif(C.23)

The enhancement factor can be calculated from the surface renewal theory:

 
image file: c6ra22589f-t103.tif(C.24)

While

 
image file: c6ra22589f-t104.tif(C.25)

And:

 
image file: c6ra22589f-t105.tif(C.26)

Nomenclature

aSpecific gas–liquid area, m2 m−3
awActivity of water
BCO2Constant of virial eqn, cm3 mol−1
CCO2Total CO2 concentration, M
CDEATotal DEA concentration, M
CCO2,bFree CO2 concentrations at the liquid bulk, M
image file: c6ra22589f-t106.tifTotal CO2 concentrations at the bulk, M
CCO2,iFree CO2 concentrations at the interface, M
image file: c6ra22589f-t107.tifTotal CO2 concentrations at the interface, M
dBDiameter of bubbles, cm
d0Diameter of sparger holes, mm
dsSauter diameter of the bubble, cm
DEADiethanolamine
DCO2–DEACO2 diffusion coefficient in DEA, m2 s−1
DCO2–H2OCO2 diffusion coefficient in water, m2 s−1
EEnhancement factor
EFMTwo film theory enhancement factor
ESRSurface renewal enhancement factor
GinGas molar flow rate, mol s−1
HCO2,H2OHenry's constant, atm mol−1 kg−1
kappApparent rate constant, s−1
kgGas film physical mass transfer coefficient, m s−1
KGTotal gas phase mass transfer coefficient, kmol m−2 s−1 Pa−1
klLiquid film mass transfer coefficient, kmol m−2 s−1 Pa−1
klLiquid side mass transfer coefficient, m s−1
k0lLiquid film physical mass transfer coefficient, m s−1
kobsObserved kinetic rate constant
Kx(T)Equilibrium constant, m s−1
miMolality of species, mol kg−1
MMolarity, mol L−1
MiMolarity of species, mol L−1
MwMolecular weight of water, kg mol−1
NCO2Mass transfer flux, kmol m−2 s−1
PTotal system pressure, kPa
pCO2,outOutlet CO2 partial pressure, kPa
pCO2Partial pressure of CO2, kPa
pCO2,bGas bulk partial pressure of CO2, kPa
pcCritical pressure, MPa
image file: c6ra22589f-t108.tifEquilibrium CO2 partial pressure of the bulk solution, kPa
pCO2,iInterface partial pressure of CO2, kPa
psatwSaturated vapor pressure of water, kPa
QinGas flow rate, L s−1
rCO2Rate of reaction, mol L−1 s−1
Re0Reynolds number
SContact surface, m2
tTime, s
TTemperature, K
TcCritical temperature, K
uGsuperficial velocity, m s−1
yCO2-inMole fraction of inlet CO2
ziCharge of ion i

Greek letters

αCO2CO2 loading, mole CO2 per mole amine
γiActivity coefficient of component i
ρLDensity of liquid, kg m−3
ρgDensity of gas, kg m−3
σSurface tension of liquid, N m−1
μDEADEA solution viscosity, Pa s
β0,1i,jBinary interaction parameters between species i and j in the Pitzer's equation, L mol−1
εGGas holdup
γiActivity coefficient of species
λij(I)Second virial coefficient in Pitzer's equation
TijkTernary interaction parameter in Pitzer's equation
φsatwSaturated fugacity coefficient of water
φwFugacity coefficient of water
ΔGAbsorption rate, g min−1
ΔVDifferences in fluid volume, m3

References

  1. V. V. Buwa and V. V. Ranade, Dynamics of gas–liquid flow in a rectangular bubble column: experiments and single/multi-group CFD simulations, Chem. Eng. Sci., 2002, 57(22), 4715–4736 CrossRef CAS.
  2. G. Vázquez, M. A. Cancela, C. Riverol, E. Alvarez and J. M. Navaza, Application of the Danckwerts method in a bubble column: Effects of surfactants on mass transfer coefficient and interfacial area, Chem. Eng. J., 2000, 78(1), 13–19 CrossRef.
  3. J. Sanyal, S. Vasquez, S. Roy and M. P. Dudukovic, Numerical simulation of gas–liquid dynamics in cylindrical bubble column reactors, Chem. Eng. Sci., 1999, 54(21), 5071–5083 CrossRef CAS.
  4. G. Yang and L. Fan, Axial liquid mixing in high-pressure bubble columns, AIChE J., 2003, 49(8), 1995–2008 CrossRef CAS.
  5. J. Joshi, Computational flow modelling and design of bubble column reactors, Chem. Eng. Sci., 2001, 56(21), 5893–5933 CrossRef CAS.
  6. J. M. Vasconcelos, S. P. Orvalho and S. S. Alves, Gas–liquid mass transfer to single bubbles: effect of surface contamination, AIChE J., 2002, 48(6), 1145–1154 CrossRef CAS.
  7. Z. Wei-rong, S. Hui-xiang and W. Da-hui, Modeling of mass transfer characteristics of bubble column reactor with surfactant present, J. Zhejiang Univ., Sci., 2004, 5(6), 714–720 CrossRef.
  8. N. Sipöcz, F. A. Tobiesen and M. Assadi, The use of artificial neural network models for CO2 capture plants, Appl. Energy, 2011, 88(7), 2368–2376 CrossRef.
  9. J. D. Figueroa, et al., Advances in CO2 capture technology—the US Department of Energy's Carbon Sequestration Program, Int. J. Greenhouse Gas Control, 2008, 2(1), 9–20 CrossRef CAS.
  10. A. Ahmad, et al., CO2 removal using membrane gas absorption, Int. J. Greenhouse Gas Control, 2010, 4(3), 495–498 CrossRef CAS.
  11. M. Hamzehie, et al., Developing a feed forward multilayer neural network model for prediction of CO2 solubility in blended aqueous amine solutions, J. Nat. Gas Sci. Eng., 2014, 21, 19–25 CrossRef CAS.
  12. Z. Niu, et al., Experimental studies and rate-based process simulations of CO2 absorption with aqueous ammonia solutions, Ind. Eng. Chem. Res., 2012, 51(14), 5309–5319 CrossRef CAS.
  13. X. Zhao, et al., Comparison of several packings for CO2 chemical absorption in a packed column, Int. J. Greenhouse Gas Control, 2011, 5(5), 1163–1169 CrossRef CAS.
  14. P. D. Vaidya and E. Y. Kenig, CO2-Alkanolamine Reaction Kinetics: A Review of Recent Studies, Chem. Eng. Technol., 2007, 30(11), 1467–1474 CrossRef CAS.
  15. M. Afkhamipour and M. Mofarahi, Comparison of rate-based and equilibrium-stage models of a packed column for post-combustion CO2 capture using 2-amino-2-methyl-1-propanol (AMP) solution, Int. J. Greenhouse Gas Control, 2013, 15, 186–199 CrossRef CAS.
  16. R. Sidi-Boumedine, et al., Experimental determination of carbon dioxide solubility data in aqueous alkanolamine solutions, Fluid Phase Equilib., 2004, 218(1), 85–94 CrossRef CAS.
  17. S. Norouzbahari, S. Shahhosseini and A. Ghaemi, Modeling of CO2 loading in aqueous solutions of piperazine: application of an enhanced artificial neural network algorithm, J. Nat. Gas Sci. Eng., 2015, 24, 18–25 CrossRef CAS.
  18. T. N. G. Borhani, et al., CO2 capture with potassium carbonate solutions: A state-of-the-art review, Int. J. Greenhouse Gas Control, 2015, 41, 142–162 CrossRef CAS.
  19. H. Kierzkowska-Pawlak, Carbon dioxide removal from flue gases by absorption/desorption in aqueous diethanolamine solutions, J. Air Waste Manage. Assoc., 2010, 60(8), 925–931 CAS.
  20. S. Mortazavi-Manesh, M. Satyro and R. A. Marriott, Modelling carbon dioxide solubility in ionic liquids, Can. J. Chem. Eng., 2013, 91(4), 783–789 CrossRef CAS.
  21. R. Deshmukh and A. Mather, A mathematical model for equilibrium solubility of hydrogen sulfide and carbon dioxide in aqueous alkanolamine solutions, Chem. Eng. Sci., 1981, 36(2), 355–362 CrossRef CAS.
  22. E. Hückel and P. Debye, The theory of electrolytes: I. lowering of freezing point and related phenomena, Phys. Z, 1923, 24, 185–206 Search PubMed.
  23. R. L. Kent and B. Eisenberg, Better data for amine treating, Hydrocarbon Process., 1976, 55(2), 87–90 CAS.
  24. C. C. Chen and L. B. Evans, A local composition model for the excess Gibbs energy of aqueous electrolyte systems, AIChE J., 1986, 32(3), 444–454 CrossRef CAS.
  25. M. Haji-Sulaiman and M. Aroua, Equilibrium of CO2 in aqueous diethanolamine (DEA) and amino methyl propanol (AMP) solutions, Chem. Eng. Commun., 1995, 140(1), 157–171 CrossRef.
  26. W. L. McCabe, J. C. Smith and P. Harriott, Unit operations of chemical engineering, McGraw-Hill, New York, 1993, vol. 5 Search PubMed.
  27. G. F. Froment, K. B. Bischoff and J. De Wilde, Chemical reactor analysis and design, Wiley, New York, 1990, vol. 2 Search PubMed.
  28. P. Danckwerts, Significance of liquid-film coefficients in gas absorption, Ind. Eng. Chem., 1951, 43(6), 1460–1467 CrossRef CAS.
  29. V. E. Elk, et al., Modelling of gas-liquid reactors-implementation of the penetration model in dynamic modelling of gas-liquid processes with the presence of a liquid bulk, Chem. Eng. J., 2000, 2000(76), 223–237 CrossRef.
  30. M. Edali, R. Idem and A. Aboudheir, 1D and 2D absorption-rate/kinetic modeling and simulation of carbon dioxide absorption into mixed aqueous solutions of MDEA and PZ in a laminar jet apparatus, Int. J. Greenhouse Gas Control, 2010, 4(2), 143–151 CrossRef CAS.
  31. F. Yamashita, Simulation of gas holdup in a bubble column with a draft tube for gas dispersion into an annulus, Chemical Engineering Transactions, 2011, 24, 1393–1398 Search PubMed.
  32. X. Jia, et al., Effect of surfactant type on interfacial area and liquid mass transfer for CO2 absorption in a bubble column, Chin. J. Chem. Eng., 2015, 23(3), 476–481 CrossRef CAS.
  33. G. F. Versteeg and W. Van Swaalj, Solubility and diffusivity of acid gases (carbon dioxide, nitrous oxide) in aqueous alkanolamine solutions, J. Chem. Eng. Data, 1988, 33(1), 29–34 CrossRef CAS.
  34. T. T. Teng, et al., Viscosity of aqueous solutions of N-methyldiethanolamine and of diethanolamine, J. Chem. Eng. Data, 1994, 39(2), 290–293 CrossRef CAS.
  35. J. Liu, et al., Study on mass transfer and kinetics of CO2 absorption into aqueous ammonia and piperazine blended solutions, Chem. Eng. Sci., 2012, 75, 298–308 CrossRef CAS.
  36. D. D. Perrin, Dissociation constants of organic bases in aqueous solution: supplement 1972, Butterworths, 1972 Search PubMed.
  37. T. Edwards, et al., Vapor-liquid equilibria in multicomponent aqueous solutions of volatile weak electrolytes, AIChE J., 1978, 24(6), 966–976 CrossRef CAS.
  38. J. G. Hayden and J. P. O'Connell, A generalized method for predicting second virial coefficients, Ind. Eng. Chem. Process Des. Dev., 1975, 14(3), 209–216 CAS.
  39. B. Rumpf and G. Maurer, An experimental and theoretical investigation on the solubility of carbon dioxide in aqueous solutions of strong electrolytes, Berichte der Bunsengesellschaft fuer physikalische chemie, 1993, 97(1), 85–97 CrossRef CAS.
  40. A. Saul and W. Wagner, International equations for the saturation properties of ordinary water substance, J. Phys. Chem. Ref. Data, 1987, 16(4), 893–901 CrossRef CAS.
  41. F. Bougie and M. C. Iliuta, CO2 absorption in aqueous piperazine solutions: experimental study and modeling, J. Chem. Eng. Data, 2011, 56(4), 1547–1554 CrossRef CAS.
  42. E. L. Guggenheim, The specific thermodynamic properties of aqueous solutions of strong electrolytes, The London, Edinburgh, and Dublin Philosophical Magazine and Journal of Science, 1935, 19(127), 588–643 CrossRef CAS.
  43. G. Lewis and M. Randall, Thermodynamics, ed. K. S. Pitzer and L. Brewer, McGraw-Hill, New York, 1961 Search PubMed.
  44. K. S. Pitzer and J. J. Kim, Thermodynamics of electrolytes. IV. Activity and osmotic coefficients for mixed electrolytes, J. Am. Chem. Soc., 1974, 96(18), 5701–5707 CrossRef CAS.
  45. K. S. Pitzer, Thermodynamics of electrolytes. I. Theoretical basis and general equations, J. Phys. Chem., 1973, 77(2), 268–277 CrossRef CAS.
  46. A. Benamor and M. Aroua, Modeling of CO2 solubility and carbamate concentration in DEA, MDEA and their mixtures using the Deshmukh–Mather model, Fluid Phase Equilib., 2005, 231(2), 150–162 CrossRef CAS.
  47. I. Folgueira, et al., Carbon dioxide absorption behavior in 2-(ethylamino) ethanol aqueous solutions, Fuel Process. Technol., 2015, 131, 14–20 CrossRef CAS.
  48. A. Ghaemi, et al., Kinetics and absorption rate of CO2 into partially carbonated ammonia solutions, Chem. Eng. Commun., 2011, 198(10), 1169–1181 CrossRef CAS.
  49. U. E. Aronu, A. Hartono and H. F. Svendsen, Density, viscosity, and N 2 O solubility of aqueous amino acid salt and amine amino acid salt solutions, J. Chem. Thermodyn., 2012, 45(1), 90–99 CrossRef CAS.
  50. O. Levenspiel, Chemical reaction engineering, Ind. Eng. Chem. Res., 1999, 38(11), 4140–4143 CrossRef CAS.
  51. P. Derks, et al., Kinetics of absorption of carbon dioxide in aqueous piperazine solutions, Chem. Eng. Sci., 2006, 61(20), 6837–6854 CrossRef CAS.
  52. W.-C. Sun, C.-B. Yong and M.-H. Li, Kinetics of the absorption of carbon dioxide into mixed aqueous solutions of 2-amino-2-methyl-l-propanol and piperazine, Chem. Eng. Sci., 2005, 60(2), 503–516 CrossRef CAS.
  53. B. Pinsent, L. Pearson and F. Roughton, The kinetics of combination of carbon dioxide with hydroxide ions, Trans. Faraday Soc., 1956, 52, 1512–1520 RSC.
  54. M. Caplow, Kinetics of carbamate formation and breakdown, J. Am. Chem. Soc., 1968, 90(24), 6795–6803 CrossRef CAS.
  55. P. Danckwerts, The reaction of CO2 with ethanolamines, Chem. Eng. Sci., 1979, 34(4), 443–446 CrossRef CAS.
  56. P. Blauwhoff, G. Versteeg and W. Van Swaaij, A study on the reaction between CO2 and alkanolamines in aqueous solutions, Chem. Eng. Sci., 1983, 38(9), 1411–1429 CrossRef CAS.
  57. G. Versteeg, L. Van Dijck and W. Van Swaaij, On the kinetics between CO2 and alkanolamines both in aqueous and non-aqueous solutions. An overview, Chem. Eng. Commun., 1996, 144(1), 113–158 CrossRef CAS.
  58. P. N. Sutar, et al., Secondary amines for CO2 capture: a kinetic investigation using N-ethylmonoethanolamine, Chem. Eng. J., 2012, 207, 718–724 CrossRef.
  59. E. B. Rinker, S. S. Ashour and O. C. Sandall, Kinetics and modeling of carbon dioxide absorption into aqueous solutions of diethanolamine, Ind. Eng. Chem. Res., 1996, 35(4), 1107–1114 CrossRef CAS.

This journal is © The Royal Society of Chemistry 2016
Click here to see how this site uses Cookies. View our privacy policy here.