
Microbial community dynamics in an anaerobic biofilm reactor treating heavy oil refinery wastewater†
Honghong Donga,
Hao Donge,
Zhongzhi Zhang*a,
Shanshan Suna,
Wei Wanga,
Ming Ke*a,
Zhaozheng Songa,
Zhenjia Zhangb,
Jianfeng Wangc and
Wei-Min Wud
aState Key Laboratory of Heavy Oil Processing, China University of Petroleum, Beijing, 102249, P. R. China. E-mail: bjzzzhang@163.com; keming@cup.edu.cn; Fax: +86-10-89734284; Tel: +86-10-89734284
bSchool of Environmental Science and Engineering, Shanghai Jiao Tong University, Shanghai 200240, P. R. China
cCore Genomic Facility, Beijing Institute of Genomics, Chinese Academy of Science, Beijing, 100101, P. R. China
dDepartment of Civil and Environmental Engineering, William & Cloy Codiga Resource Recovery Research Center, Center for Sustainable Development & Global Competitiveness, Stanford University, Stanford, California CA 94305-4020, USA
eCollege of Chemistry and Environmental Engineering, Yangtze University, Jingzhou 434023, P. R. China
First published on 4th November 2016
Abstract
We have established an anaerobic biofilm reactor (AnBR) for treating heavy oil refinery wastewater at the field scale for the first time. The AnBR showed a good performance with a chemical oxygen demand (COD) removal efficiency of 60% after 11 days at a Hydraulic Retention Time (HRT) of 72 h. A relatively stable performance was maintained for 79 days at 35 ± 1 °C when the HRT was shortened to 60 h (the average removal efficiency of COD increased to 80.42%). The diversity and dynamics of microbial communities were investigated in detail. A total of 797![[thin space (1/6-em)]](https://www.rsc.org/images/entities/char_2009.gif) 732 high-quality sequences were obtained after trimming, assembling paired-end reads, and quality screening of raw reads by Illumina MiSeq sequencing of the two bacterial 16S hypervariable regions V3 and V4. The results showed that the biofilm bacterial species diversity increased from the start-up stage to steady-state stage, whereas the diversity of the archaeal species of the biofilm decreased. During steady state, biofilm collected from the middle of the AnBR was dominant bacterial genera, Acinetobacter and Pseudomonas, that played a vital role in hydrocarbon-degradation. Methanosaeta, which is regarded as a major acetoclastic methanogen, was the predominant archaeal genus from the same biofilm location. The results of rapid start-up (11 days) and high COD removal efficiency (80.42%) of the AnBR were attributed to the highly efficient biofilm. This study demonstrated the potential application of the AnBR as an alternative for high-efficiency anaerobic treatment of heavy oil refinery wastewater.
732 high-quality sequences were obtained after trimming, assembling paired-end reads, and quality screening of raw reads by Illumina MiSeq sequencing of the two bacterial 16S hypervariable regions V3 and V4. The results showed that the biofilm bacterial species diversity increased from the start-up stage to steady-state stage, whereas the diversity of the archaeal species of the biofilm decreased. During steady state, biofilm collected from the middle of the AnBR was dominant bacterial genera, Acinetobacter and Pseudomonas, that played a vital role in hydrocarbon-degradation. Methanosaeta, which is regarded as a major acetoclastic methanogen, was the predominant archaeal genus from the same biofilm location. The results of rapid start-up (11 days) and high COD removal efficiency (80.42%) of the AnBR were attributed to the highly efficient biofilm. This study demonstrated the potential application of the AnBR as an alternative for high-efficiency anaerobic treatment of heavy oil refinery wastewater.
1. Introduction
Heavy oil refinery wastewater contains a variety of polar organics, complex dissolved recalcitrant organic compounds, and a high concentration of toxic macromolecular components, which have poor biodegradability and low solubility. This kind of wastewater causes a significant fluctuation in water quality, which is often classified as intractable industrial wastewater and requires purification by biodegradation.1,2 Furthermore, the cost of water usage in heavy oil refineries has increased rapidly due to the expansion of oil refinery industries and the shortage of water resources. In addition, the upgraded standard for heavy oil wastewater discharge and the increasing strictness of national and local environment management will force the enterprises to decrease the wastewaters discharge.Anaerobic treatment technology has been widely applied in processing of refinery wastewater because of reduced energy consumption and operating cost. Compared with other technologies, anaerobic treatment technology exhibits low sludge production, strong resistance to impact load, and excellent organic removal efficiency.3,4
The anaerobic biofilm reactor (AnBR) has been proven a valuable and promising system in achieving high organic removal efficiency with high resistance to hydraulic or organic overload.5–7 However, with the increasing biofilm thickness and suspended solid concentration in the refinery wastewater, the AnBR is prone to be clogged with solid fillers, resulting in a lower treatment performance.8 The AnBR requires a long start-up time, although this time allows active biofilm development on the carrier thus meeting the nominal organic loading rate (OLR) with a satisfactory treatment performance.8,9 Generally speaking, the start-up period of anaerobic process is time-consuming and takes two to nine months before achieving a steady state when a high removal efficiency is reached.10 A long start-up time is unfavorable for economic competitiveness of the anaerobic process. These drawbacks severely limit the application of the AnBR in heavy oil refinery wastewater treatment.
Recently, high-throughput sequencing with low cost and unparalleled coverage has been extensively used to investigate microbial communities.11 However, almost no studies have been reported about the application of the AnBR to treat the heavy oil refinery wastewater, let alone the microbial analysis, particularly using high-throughput sequencing methods, of the AnBR in processing heavy oil refinery wastewater.
In this study, a highly efficient AnBR has been developed to process the heavy oil refinery wastewater for the first time, using soft filter media consisting of hydroformylated polyvinyl alcohol fibers with high porosity and large specific surface area. The aim was to seek an alternative AnBR for the treatment of heavy oil refinery wastewater. The AnBR used in this study can not only effectively solved the issue of clogging, but also accelerated the start-up period of the anaerobic process by adding anaerobic sludge and highly efficient bacteria during the heavy oil refinery wastewater treatment. The microorganisms in the AnBR were the main contributors to the degradation and removal of pollutants. In order to better understand the distribution of functional microbial populations in the AnBR, the microbial communities of influent water (IW), effluent water (EW), and the biofilm of the AnBR under different operational parameters were analyzed by employing a barcoded Illumina paired-end sequencing method targeting the 16S V3–V4 regions. Functional microbial population diversity and succession in the AnBR were systematically investigated from the start-up stage to steady-state stage throughout the processing of heavy oil refinery wastewater. By choosing this type of AnBR, the problems of clogging and long start-up period can be overcome, which result in less operating cost and a more efficient process.
2. Materials and methods
2.1 Reactor system, inoculum, start-up, and operation of anaerobic biofilm equipment
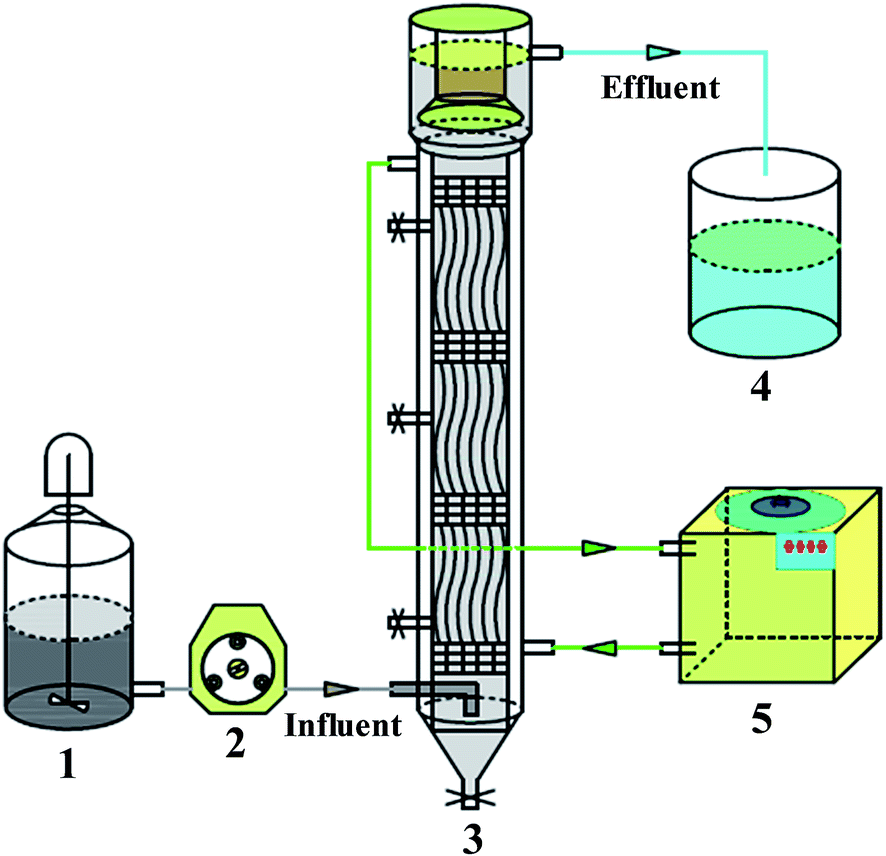 | ||
| Fig. 1 A simple schematic diagram of the field-scale AnBR used in this study. Raw water storage (1); peristaltic pump (2); AnBR (3); discharge water storage (4); thermostatic water bath (5). | ||
| Parameter | Concentration (mg L−1) | Parameter | Concentration (mg L−1) |
|---|---|---|---|
| COD | 422 + 3.4 | Na+ | 92.03 + 2.3 |
| BOD5 | 74 + 2.6 | Mg2+ | 33.33 + 1.2 |
| NH3–N | 31.8 + 1.5 | Al3+ | 0.26 + 0.1 |
| SS | 15.1 + 1.8 | Si | 13.30 + 1.1 |
| Oil | 17.8 + 2.3 | S2− | 31.39 + 1.3 |
| Total nitrogen | 32.6 + 1.8 | Cl− | 23.74 + 3.1 |
| Total phosphorus | 0.88 + 0.11 | K+ | 7.88 + 0.28 |
| TOC | 156 + 3.2 | Ca2+ | 97.44 + 3.8 |
| pH | 7.46–8.26 | Fe2+, Fe3+ | 0.53 + 0.21 |
| Total salts | 800–1200 | Br− | 0.18 + 0.1 |
2.2 Assessment of microbial degradation of heavy oil refinery wastewater
Two g oily sludge were added to a 250 mL serum bottle containing 100 mL medium and 10.0 g L−1 heavy oil. This mixture was incubated for two days in a bath oscillator (with a rotation rate of 150 rpm and temperature of 35 °C). After that, 1 mL of the mixture was transferred into a fresh medium. This process was repeated three times; then, 0.5 mL diluted mixture of the last transfer was isolated via the steak plate method using the basal medium containing 2.0 g L−1 heavy oil and 2% agar. The plates were incubated at 35 °C for 24 h. Three strains of petroleum hydrocarbon-degrading bacteria were selected from the plates, and isolates were purified by re-streaking individual colonies onto fresh agar plates. Then, three strains were identified.
2.3 Analytical methods
The influent and effluent samples were collected daily and analyzed to determine the COD12 and pH immediately. Total volatile fatty acids (VFAs) in the influent and treated wastewater (effluent) were measured by acidified ethylene glycol colorimetric method.12 The detailed instructions of the total VFAs determined were as the following: firstly, under the condition of heating, the sample contained volatile fatty acid reacted with acid glycol to produce generate ester. Then, the ester reacted with carboxamide to form hydroxamic acid. On the premise of high iron reagent, hydroxamic acid was able to convert into a hydroxamic acid–iron complex compound with brownish red color. Finally, the initial content of volatile fatty acid was determined by the color depth of brownish red. Mixed liquor suspended solids (MLSS), mixed liquor volatile suspended solids (MLVSS), and sludge volume index (SVI) of anaerobic sludge were measured according to the standard methods.12 The pH values of the samples were determined via pH-meter (Model Crison 20 Basic).2.4 Microbial structure analysis
000 rpm, and followed by supernatant decantation. For the water samples, approximately 100 mL treated wastewater of each sample was filtered through a Millipore membrane filter with the average pore diameter of 0.22 μm. The filter membrane was cut by a pair of sterile scissors and mixed with 45 mL PBT buffer (consisting of 0.003% Tween 20, 17 mmol L−1 KH2PO4, and 72 mmol L−1 K2HPO4). Next, the water filter was processed by following two steps: vortex-shock interference for 15 min and ultrasound for 20 min. The treated sample was transferred to a new tube and the two step procedure was repeated. Finally, the sample was centrifuged for 30 min at 10000 rpm and 4 °C. Precipitates were collected twice and transferred to a 2 mL centrifuge tube for further centrifugation (10 min with a speed of 10000 rpm).3. Results and discussion
3.1 Performance comparison of wastewater treatment by three bacteria
In this study, three bacterial strains isolated from oily sludge, identified as Rhodococcus ruber, Pseudomonas aeruginosa and Bacillus subtilis were used. These detected functional bacteria are Rhodococcus ruber (denoted as DL1), Pseudomonas aeruginosa (denoted as DL2), and Bacillus subtilis (denoted as DL3), respectively; all of which were used for the degradation test. In addition, BOD5, COD, and B/C ratio were used to evaluate the degradative activities of these bacteria. As shown in Fig. 2a, BOD5 from DL2 increased sharply with the time, indicating that the DL2 strain showed the most effective treatment of refractory wastewater among the three bacterial cultures isolates. The B/C ratio of the original EW from air flotation increased from 0.13 to 0.55, and the COD removal efficiency increased from 21.8% in the control test to 68.88% after five days of degradation by adding the DL2 strain. Among the three strains tested, DL2 exhibited the highest B/C ratio and COD removal efficiency (Fig. 2b), which were higher than that of heavy oil-produced water treatment by using P. aeruginosa as bioaugmentation.17 A previous study reported that the n-alkane can be utilized by P. aeruginosa.18 Pseudomonas as a bacterial-based bioaugmentation was mostly used in anaerobic conditions.17,19 From the previous conclusions, the DL2 strain can be regarded as the bacteria that can most efficiently improve the biodegradability of refractory wastewater in this study. | ||
| Fig. 2 The changes of BOD concentration over time for different strains (a) and the variations of B/C ratio and COD removal efficiency for different bacterial strains (b). WW, WW + DL1, WW + DL2, and WW + DL3 denote wastewater, wastewater + R. ruber, wastewater + P. aeruginosa, and wastewater + B. subtilis, respectively; DL1, DL2, and DL3 represent R. ruber, P. aeruginosa, and B. subtilis, respectively; the control represents wastewater without the addition of bacteria. | ||
3.2 Evaluation of the performance of the AnBR
Generally speaking, the HRT plays a vital role in supply and demand between microorganisms and substrate. A short HRT may cause sludge washout, super acidulation, and low COD removal efficiency.1 The HRT of the start-up period was adjusted to 72 h, and the variation of COD in the start-up phase was illustrated in Fig. 3a. The COD content of the IW from the AnBR was clearly observed, i.e., between 401.5 mg L−1 and 785.2 mg L−1. Although the AnBR was inoculated for 24 h and a large number of microorganisms were attached to the biofilm at the start-up phase, a portion of sludge still flowed out with the EW. In addition, dissolved materials were carried by the sludge water, resulting in a high COD level in EW. As the anaerobic microorganisms became established, the biofilm developed and the excess sludge was expelled, the COD content in EW decreased and the removal rate of COD increased gradually (Fig. 3a). Thus, the COD removal efficiency reached approximately 60% and the effluent COD concentration decreased to 150 mg L−1 (Fig. 3a). On the basis of the COD removal efficiency in the start-up phase, we can conclude that the AnBR was successfully initiated and the anaerobic microorganisms thrived. In a previous study, the start-up time of the upflow anaerobic sludge blanket (UASB) bioreactor was 120 days with the HRT of 3 days and OLR of 0.4 kg per m3 per day when processing petroleum refinery effluent.20 Another study showed that, at a start-up time of 75 days with the OLR of 0.6 kg per m3 per day, the COD removal rate was 61% during the treatment of petroleum refinery wastewater.1 Compared with these previously reports, this study has significantly shortened the start-up period of heavy oil refinery wastewater treatment. To achieve the desired processing effects, the HRT was adjusted to 60 h and the water flow rate was tuned to 3.75 mL min−1 (Fig. 3b). In Fig. 3b, the effluent COD concentration decreased to 100 mg L−1 and the average COD removal rate increased to 80.42%. In addition, the COD content from EW in the AnBR was stable, indicating that the microorganisms on the biofilm had a certain resistance to water impact, in spite of the fluctuation of COD in the IW. | ||
| Fig. 3 The changes of COD content and removal efficiency for the effluent and influent over time in AnBR during the start-up phase (a) and stable phase (b); the variations of pH value for the effluent and influent over time in AnBR during start-up and stable phases (c); the changes of VFA content for the effluent and influent over time in AnBR during stable phase (d). | ||
An appropriate pH range was needed for bacteria to degrade organic compounds in the reactor. Severe pH value fluctuations would lead to the death of microorganisms.1 The variation of pH in the whole start-up phase was exhibited in Fig. 3c. The pH range of IW was maintained between 7.59 and 7.83, which was suitable for the growth of anaerobic microorganisms examined here. Meanwhile, the effluent pH was approximately 7.50, which indicated that the system was efficiently self-buffered and the operation was stable, which was consistent with the report of Wang et al.1 As displayed in Fig. 3c, the pH of EW in the anaerobic reactor was well maintained between 7.45 and 7.88 during the entire operation phase, suggesting that the anaerobic microorganisms were preserved in a good condition for growth. VFAs have been used quite frequently as a key performance indicator of anaerobic digestion. The change of VFAs with time in the operation phase was exhibited in Fig. 3d. A certain amount of VFAs was accumulated in the IW of the AnBR (Fig. 3d). Total VFAs included short-chain fatty acids from C2 to C6 (acetic, propionic, butyric, etc.) and long chain fatty acids such as butyric, iso-butyric, valeric and iso-valeric, which both existed in the influent water. Long chain VFAs can be degraded to short-chain VFAs and H2/CO2 in hydrolysis-acidogenesis phase, then to methane gas from acetate or H2/CO2 (methanogenesis). The content of VFAs in effluent water from the AnBR was maintained at less than 30 mg L−1, indicating that both short-chain VFAs and long chain VFAs were degraded and the anaerobic system did not become acidic, which corresponded well with the result of high COD removal efficiency and appropriate pH value (7.45 to 7.88) in EW.
3.3 Analysis of microbial community
Among the Proteobacteria, the Betaproteobacteria plays a critical role in the degradation of organic matter in sewage treatment plants,22 particularly for the propionate-, butyrate-, and acetate-utilizing microbial communities.23 This group of bacteria accounted for 72.09% of the IW-day11 sample (Fig. S2†). Within this group, the ASSO-13 order (Fig. S3†) and Rhodocyclaceae family (Fig. S4†) accounted for 35.88% and 32.75% of the IW-day11 sample, respectively. However, these populations accounted for a small proportion in biofilm samples (i.e., MF and BF), indicating that these microorganisms cannot easily attach to the surface of the biocarrier. The Gammaproteobacteria class accounted for 84.42% in the MF-day90 sample, 81.85% in the IW-day90 sample, and 74.51% in the EW-day90 sample (Fig. S2†), respectively. Among them, the Pseudomonadales order was a large proportion in the MF-day90, IW-day90, and EW-day90 samples during the stable condition (Fig. S3†). At the genus level, the Acinetobacter and Pseudomonas accounted for 41.79% and 41.47% in the MF-day90 sample, 51.19% and 28.67% in the IW-day90 sample, and 39.70% and 30.71% in the EW-day90 sample, respectively (Fig. 5a). Although the Acinetobacter is generally regarded as strictly aerobic, it also is observed in different anaerobic or oxygen-limited environments, including soils, sediments, and anaerobic or anoxic processes. The important role Acinetobacter played in anaerobic environments was its involvement in the oxidation of organic matter through anaerobic respiration.24,25 Pseudomonas was the major component in the MF sample of the stable phase. The Pseudomonas is a hydrocarbon-degrading bacterium, i.e., the versatile aromatic degrader of polycyclic aromatic hydrocarbons and heterocyclic aromatics, including indole, quinolone, and carbazole.26,27
The second most abundant phylum group was Chlorobi (Fig. S1†). In the start-up phase, the predominant Chlorobaculum (Fig. 5a) of the Chlorobi phylum and the strictly anaerobic photosynthetic bacterium28 were detected in MF (72.54% in the MF-day11 sample) and effluent samples (55.17% in the EW-day11 sample). These organisms would potentially confer protection against oxygen by the oxygen reduction products, which was known as the substrates.28
Bacteroidetes phylum (Fig. S1†) identified in this study exhibited a high hydrolytic activity in the anaerobic reactor and was responsible for the generation of VFAs (i.e., acetate, propionate, and butyrate) which resulted in the decrease of the pH in the anaerobic reactor.29 VFAs were produced throughout acidogenesis. However, a high concentration of VFAs can significantly affect the performance of the AnBR. Bacteroidetes was represented by the Bacteroidales order (Fig. S3†) and can tolerate high volatile fatty acids and low pH.30 The dominant Bacteroidales order was detected only in the BF-day11 sample (24.47%), which guaranteed that acidification did not occur in the AnBR and the system started up successfully. The genus Blvii28 (Fig. 5a), a fermentation bacterium that can transform carbohydrates to hydrogen,1 accounted for 6.74% in the BF-day11 sample.
Firmicutes (Fig. S1†) plays a vital role in hydrolysis and acidogenesis, which produce cellulases, lipases, proteases, and other extracellular enzymes31 during the process of anaerobic digestion. In addition, a significantly higher abundance of the Clostridiales order observed in the BF-day90 sample (Fig. S3†) participated in the fermentation of organic matter and contributed to the hydrolysis and acidogenesis of organic compounds in the anaerobic reactor.25 Tissierella soehngenia was reported to optimally grow under mesophilic conditions and could produce acetate, butyrate, and isovalerate at the optimal pH value of 8.3.32 It accounted for 8.10% in the BF-day90 sample (Fig. 5a).
Methanobacteria belonging to Euryarchaeota was the second most abundant class (Fig. S6†). Among Methanobacteria, the Methanobacteriales order accounted for 40.1% in the MF-day11 sample, 20.8% in the MF-day90 sample, 21.2% in the BF-day11 sample, and 13.4% in the BF-day90 sample (Fig. S7†), respectively. Methanobacteriales was represented by the WSA2 family (Fig. S8†) and Methanobacterium genus (Fig. 5c). Throughout the experiment, WSA2 was the dominant group, which has been reported in several anaerobic digestion systems.42 It represents methanogens capable of growing on H2/CO2. Methanobacterium is a CO2-reducing methanogen.22 It was abundant in the MF-day90 (10.10%) and EW-day90 (16.96%) samples (Fig. 5c).
The highest bacterial diversity in the BF and highest relative abundance of functional bacteria in the MF likely contributed to the high efficiency of AnBR at the steady-state stage. As shown in Fig. S9a† and 4a, BF-day90 has the highest Shannon index of 8.179, and it has the longest distance from MF-day90, which indicates that the difference in position and/or nutrient/carbon types and concentrations along the flow path could have a remarkable effect on the bacterial diversity of the steady-state stage. However, most functional bacterial species were present in the MF-day90 sample, such as Pseudomonas (41.47%) and Acinetobacter (41.79%), which were mainly responsible for the degradation of refractory organics of the AnBR. This finding was consistent with the low COD concentration and the high removal efficiency of COD (Fig. 3b) in the effluent.
 | ||
| Fig. 4 The PCoA of bacteria in the anaerobic reactor (a) and the PCoA of archaea in the anaerobic reactor (b). PCoA in (a) and (b) represents the OTUs vs. the sequences in each sample. MF-day11, BF-day11, IW-day11, and EW-day11 represent the MF, BF, IW, and EW samples from the start-up phase of AnBR for 11 days and the HRT of 72 h, respectively. MF-day90, BF-day90, IW-day90, and EW-day90 represent the MF, BF, IW, and EW samples from the stable phase of AnBR for 79 days and the HRT of 60 h, respectively. Numbers in parentheses in the legends are the Shannon indices of each sample. | ||
MF had a high archaeal diversity and high relative abundance of functional archaea, which were likely responsible for the rapid start-up and high efficiency of the AnBR. Taking the start-up stage as an example, MF-day11 had the highest archaeal Shannon index (4.734), indicating that the highest diversity was present in the MF at the start-up stage (Fig. S9b†). In addition, Methanosaeta, Methanomethylovorans, and WSA2 were the dominant groups in the MF (particularly MF-day11) samples (Fig. 5d). All of the above conclusions indicated that the AnBR could achieve a rapid start-up.
 | ||
| Fig. 5 Phylogenetic analysis of bacterial populations in eight samples at the genus level (a); relative abundance of four functional bacteria during the experiment (b); phylogenetic analysis of archaeal populations in eight samples at the genus level (c); relative abundance of the seven functional bacterial species during the experiment (d). MF-day11, BF-day11, IW-day11, and EW-day11 represent the MF, BF, IW, and EW samples from the start-up phase of AnBR for 11 days and the HRT of 72 h, respectively. MF-day90, BF-day90, IW-day90, and EW-day90 represent the MF, BF, IW, and EW samples from the stable phase of AnBR for 90 days and the HRT of 60 h, respectively. The color scale ranges from 0% to 72.54% in relative abundance. | ||
At the steady-state stage, the archaeal Shannon index of MF-day90 (4.357) was higher than that of BF-day90 (3.647) (Fig. S9b†), and it had the longest distance from BF-day90 (Fig. 4b), which indicated that the difference in position and/or nutrient/carbon types and concentrations along the flow path could have a remarkable effect on the archaeal diversity of the steady-state stage. In addition, functional archaea, such as Methanosaeta, WSA2, Methanomethylovorans, and Methanobacterium, were dominant in the MF-day90 sample (Fig. 5d), which were responsible for the high efficiency of the AnBR at the steady-state stage. In other words, the high archaeal diversity, as well as high relative abundance of functional archaea in the MF sample, was partly responsible for the high efficiency at the steady-state stage of the AnBR.
The archaeal diversity of the biofilm decreased from the start-up to stable periods, and the dominant archaea of the system was shifted to strongly functional species and enriched with acetoclastic methanogens at steady-states with the modulation of operating conditions. Fig. 4b showed a cluster of the MF-day11, BF-day11, IW-day11, and EW-day11 group samples, which was more compacted than that of MF-day90, BF-day90, IW-day90, and EW-day90 samples, implying that the archaeal communities of influent, effluent, and biofilm samples between the start-up and stable stages significantly differ from each other. For archaea, the Shannon indices of the biofilm samples (4.734 in the MF-day11 sample and 4.366 in the BF-day11 sample) in the start-up stage were higher than those (4.357 in the MF-day90 sample and 3.647 in the BF-day90 sample) in the stable stage (Fig. S9b†) and the higher diversity was usually correlated with the rapid start-up of the AnBR. The possible reason for the decrease in archaeal diversity could be the limited substrate availability. Several species disappeared during the shorter HRT (60 h) in the stable stage, which led to the decrease in diversity of the microbial community. This result was contrary to the conclusion of Ma et al.44
The shift in the dominance of the methanogen phylotype from methylotrophic methanogens to acetoclastic methanogens was also analyzed. A marked increase in the relative abundance of Methanosaeta in the MF sample indicated that this acetate-utilizing methanogen was driven by methanogenesis (Fig. 5d). Generally, Methanosaeta was dominant in the stable period, whereas the acetate levels were low, as this genus has high affinity for acetate.46,47 Meanwhile, Methanosaeta had been isolated from the effluent sample. Although the filter possibly provided the supporting matrices for the attached growth of the Methanosaeta species,48 they would be inevitably washed out of the reactor because of their slow growth.25 The predominant Methanosaeta was the acetoclastic methanogen, which would exclusively utilize acetate,49 indicating that the acetoclastic methanogenesis pathway was likely the main route. The results were consistent with those of Jo et al.25 who reported that the reactor environment (COD removal ratio > 85% and residual VFA content < 400 mg L−1) was favorable for the development of a Methanosaeta-dominated community. For hydrogenotrophic methanogens, the Methanobacterium22 in the MF sample and Methanomicrobiales in the BF sample slightly increased, respectively (Fig. 5d). Moreover, Methanolinea, which usually dominates in mesophilic temperature anaerobic systems (Bandara et al., 2012), slightly increased from MF-day11 and BF-day11 to MF-day90 and BF-day11, whereas WSA2 decreased (Fig. 5d). However, the relative abundance of hydrogenotrophic methanogens was less than that of the acetoclastic methanogens (Fig. 5d) because the hydrogenotrophic route in anaerobic bioreactors was commonly under psychrophilic conditions.37 By comparison, several microorganisms were observed to decline proportionally. For example, the Methanomassiliicoccaceae, and Methanomethylovorans as a methylotrophic methanogen,40 decreased because of the physiological properties of the organism (i.e., substrate use and low growth rate). Methylotrophic archaea were also reported to form a stable community along with the acetoclastic and hydrogenotrophic methanogens.38
The results and discussion indicated that the rapid start-up and high COD removal efficiency of the AnBR are likely to be dependent on the filter biofilm carrier, the functional species, and the existence and change of microbial community on the filter biofilm carrier. Such an integrated biofilm system guaranteed a rapid start-up and stable and effective AnBR.
4. Conclusions
This study showed that our AnBR was a highly efficient reactor system for treating heavy oil refinery wastewater with a short start-up time. The start-up time was shortened significantly by using an inoculum of anaerobic sludge containing a hydrocarbon-degrading bacterial isolate to the AnBR. The AnBR was successfully started up after 11 days, with the HRT of 72 h and the COD removal efficiency of approximately 60%. Moreover, the average COD removal efficiency was increased up to 80.42% after continuously running AnBR at HRT of 60 h for 79 days at 35 ± 1 °C. The rapid start-up (11 days) and high COD removal efficiency (80.42%) of the anaerobic reactor were likely dependent on the biofilm, the functional species, and the change of microbial community on the filter biofilm carrier. The study demonstrated that the AnBR shows a great potential for treating the heavy oil refinery wastewater.Acknowledgements
This research was financially supported by the National Natural Science Foundation of China (No. 51474223, 41403068, and 51634008). The authors appreciate the suggestions of Dr Chuanlun Zhang of Tongji University and Dr Susan Pfiffner of University of Tennessee in the revision of the manuscript.References
- Y. Wang, Q. Wang, M. Li, Y. Yang, W. He, G. Yan and S. Guo, Biochem. Eng. J., 2016, 105, 44–51 CrossRef CAS.
- C. Wu, Y. Zhou, P. Wang and S. Guo, Bioresour. Technol., 2015, 194, 256–262 CrossRef CAS PubMed.
- G. Lettinga, S. Rebac and G. Zeeman, Trends Biotechnol., 2001, 19, 363–370 CrossRef CAS PubMed.
- H. Lin, W. Peng, M. Zhang, J. Chen, H. Hong and Y. Zhang, Desalination, 2013, 314, 169–188 CrossRef CAS.
- M. Alves, J. M. Vieira, R. Á. Pereira, M. Pereira and M. Mota, Water Res., 2001, 35, 255–263 CrossRef CAS PubMed.
- R. Cresson, H. Carrère, J. P. Delgenès and N. Bernet, Biochem. Eng. J., 2006, 30, 55–62 CrossRef CAS.
- A. Haridas, S. Suresh, K. Chitra and V. Manilal, Water Res., 2005, 39, 993–1004 CrossRef CAS PubMed.
- R. Escudie, R. Cresson, J.-P. Delgenes and N. Bernet, Water Res., 2011, 45, 1–10 CrossRef CAS PubMed.
- A. Puñal, M. Trevisan, A. Rozzi and J. M. Lema, Water Res., 2000, 34, 2614–2619 CrossRef.
- A. M. Lauwers, W. Heinen, L. G. Gorris and C. van der Drift, Appl. Microbiol. Biotechnol., 1990, 33, 352–358 CrossRef CAS PubMed.
- J. G. Caporaso, C. L. Lauber, W. A. Walters, D. Berg-Lyons, J. Huntley, N. Fierer, S. M. Owens, J. Betley, L. Fraser, M. Bauer, N. Gormley, J. A. Gilbert, G. Smith and R. Knight, ISME J., 2012, 6, 1621–1624 CrossRef CAS PubMed.
- W. E. Federation and A. P. H. Association, Standard methods for the examination of water and wastewater, American Public Health Association (APHA), Washington, DC, USA, 2005.
- T. Magoč and S. L. Salzberg, Bioinformatics, 2011, 27, 2957–2963 CrossRef PubMed.
- J. G. Caporaso, J. Kuczynski, J. Stombaugh, K. Bittinger, F. D. Bushman, E. K. Costello, N. Fierer, A. G. Pena, J. K. Goodrich and J. I. Gordon, Nat. Methods, 2010, 7, 335–336 CrossRef CAS PubMed.
- R. C. Edgar, Bioinformatics, 2010, 26, 2460–2461 CrossRef CAS PubMed.
- J. R. Cole, Q. Wang, E. Cardenas, J. Fish, B. Chai, R. J. Farris, A. Kulam-Syed-Mohideen, D. M. McGarrell, T. Marsh and G. M. Garrity, Nucleic Acids Res., 2009, 37, D141–D145 CrossRef CAS PubMed.
- M. Zhang, J. Wang, Z. Zhang, Z. Song, B. Zhang, G. Zhang and W. M. Wu, Environ. Sci. Pollut. Res., 2016, 23, 4919–4930 CrossRef CAS PubMed.
- A. Wentzel, T. E. Ellingsen, H.-K. Kotlar, S. B. Zotchev and M. Throne-Holst, Appl. Microbiol. Biotechnol., 2007, 76, 1209–1221 CrossRef CAS PubMed.
- M. Carballa, L. Regueiro and J. M. Lema, Curr. Opin. Biotechnol., 2015, 33, 103–111 CrossRef CAS PubMed.
- S. O. Rastegar, S. M. Mousavi, S. A. Shojaosadati and S. Sheibani, J. Hazard. Mater., 2011, 197, 26–32 CrossRef CAS PubMed.
- S. Tabassum, Y. Wang, X. J. Zhang and Z. J. Zhang, RSC Adv., 2015, 5, 88692–88702 RSC.
- X. C. Liu, Y. Zhang, M. Yang, Z. Y. Wang and W. Z. Lv, J. Environ. Sci., 2007, 19, 60–66 CrossRef CAS.
- H. D. Ariesyady, T. Ito and S. Okabe, Water Res., 2007, 41, 1554–1568 CrossRef CAS PubMed.
- G. Baek, J. Kim and C. Lee, Bioresour. Technol., 2014, 166, 596–601 CrossRef CAS PubMed.
- Y. Jo, J. Kim, S. Hwang and C. Lee, Bioresour. Technol., 2015, 193, 53–61 CrossRef CAS PubMed.
- H. Dong, Z. Z. Zhang, Y. L. He, Y. J. Luo, W. J. Xia, S. S. Sun, G. Q. Zhang, Z. Y. Zhang and D. L. Gao, RSC Adv., 2015, 5, 91869–91877 RSC.
- M. E. Guazzaroni, F. A. Herbst, I. Lores, J. Tamames, A. I. Pelaez, N. Lopez-Cortes, M. Alcaide, M. V. Del Pozo, J. M. Vieites, M. von Bergen, J. L. Gallego, R. Bargiela, A. Lopez-Lopez, D. H. Pieper, R. Rossello-Mora, J. Sanchez, J. Seifert and M. Ferrer, ISME J., 2013, 7, 122–136 CrossRef CAS PubMed.
- M. Kudryashev, A. Aktoudianaki, D. Dedoglou, H. Stahlberg and G. Tsiotis, Biochim. Biophys. Acta, Bioenerg., 2014, 1837, 1635–1642 CrossRef CAS PubMed.
- J. Cardinali-Rezende, L. F. Colturato, T. D. Colturato, E. Chartone-Souza, A. M. Nascimento and J. L. Sanz, Bioresour. Technol., 2012, 119, 373–383 CrossRef CAS PubMed.
- X. Goux, M. Calusinska, S. Lemaigre, M. Marynowska, M. Klocke, T. Udelhoven, E. Benizri and P. Delfosse, Biotechnol. Biofuels, 2015, 8, 1–18 CrossRef CAS PubMed.
- L. Levén, A. R. Eriksson and A. Schnürer, FEMS Microbiol. Ecol., 2007, 59, 683–693 CrossRef PubMed.
- P. Vos, G. Garrity, D. Jones, N. R. Krieg, W. Ludwig, F. A. Rainey, K. H. Schleifer and W. Whitman, Bergey's Manual of Systematic Bacteriology, vol. 3. The Firmicutes, Springer, New York, 2nd edn, 2009 Search PubMed.
- M. C. Nelson, M. Morrison and Z. Yu, Bioresour. Technol., 2011, 102, 3730–3739 CrossRef CAS PubMed.
- T.-T. Mao, R. Yin and H. Deng, CATENA, 2015, 133, 233–240 CrossRef CAS.
- S. G. Shin, S. Lee, C. Lee, K. Hwang and S. Hwang, Water Res., 2010, 101, 9461–9470 CAS.
- C. Lee, J. Kim, K. Hwang, V. O'Flaherty and S. Hwang, Bioresour. Technol., 2009, 43, 157–165 CAS.
- S. Chelliapan, T. Wilby, A. Yuzir and P. J. Sallis, Desalination, 2011, 271, 257–264 CrossRef CAS.
- W. M. Bandara, T. Kindaichi, H. Satoh, M. Sasakawa, Y. Nakahara, M. Takahashi and S. Okabe, Water Res., 2012, 46, 5756–5764 CrossRef CAS PubMed.
- B. P. Lomans, R. Maas, R. Luderer, H. J. O. den Camp, A. Pol, C. van der Drift and G. D. Vogels, Appl. Environ. Microbiol., 1999, 65, 3641–3650 CAS.
- A. M. Ziganshin, J. Liebetrau, J. Pröter and S. Kleinsteuber, Appl. Microbiol. Biotechnol., 2013, 97, 5161–5174 CrossRef CAS PubMed.
- S. S. Paul, S. M. Deb, A. Dey, S. P. S. Somvanshi, D. Singh, R. Rathore and J. Stiverson, Anaerobe, 2015, 35, 3–10 CrossRef CAS PubMed.
- D. Riviere, V. Desvignes, E. Pelletier, S. Chaussonnerie, S. Guermazi, J. Weissenbach, T. Li, P. Camacho and A. Sghir, ISME J., 2009, 3, 700–714 CrossRef PubMed.
- P. G. Encina and M. Hidalgo, Process Biochem., 2005, 40, 2509–2516 CrossRef CAS.
- J. Ma, B. Zhao, C. Frear, Q. Zhao, L. Yu, X. Li and S. Chen, Bioresour. Technol., 2013, 137, 41–50 CrossRef CAS PubMed.
- M. Carballa, M. Smits, C. Etchebehere, N. Boon and W. Verstraete, Appl. Microbiol. Biotechnol., 2011, 89, 303–314 CrossRef CAS PubMed.
- K. D. McMahon, P. G. Stroot, R. I. Mackie and L. Raskin, Water Res., 2001, 35, 1817–1827 CrossRef CAS PubMed.
- G. Collins, A. Woods, S. McHugh, M. W. Carton and V. O'Flaherty, FEMS Microbiol. Ecol., 2003, 46, 159–170 CrossRef CAS PubMed.
- S. McHugh, M. Carton, T. Mahony and V. O'Flaherty, FEMS Microbiol. Lett., 2003, 219, 297–304 CrossRef CAS PubMed.
- J. De Vrieze, S. Gildemyn, J. B. A. Arends, I. Vanwonterghem, K. Verbeken, N. Boon, W. Verstraete, G. W. Tyson, T. Hennebel and K. Rabaey, Water Res., 2014, 54, 211–221 CrossRef CAS PubMed.
Footnote |
| † Electronic supplementary information (ESI) available: Additional analytical results including Tables S1 and S2, and Fig. S1–S8 were added. See DOI: 10.1039/c6ra22469e |
| This journal is © The Royal Society of Chemistry 2016 |