DOI:
10.1039/C6RA22349D
(Paper)
RSC Adv., 2016,
6, 94539-94546
Facile synthesis of Er3+/Yb3+-codoped NaYF4 nanoparticles: a promising multifunctional upconverting luminescent material for versatile applications†
Received
7th September 2016
, Accepted 28th September 2016
First published on 28th September 2016
Abstract
The Er3+/Yb3+-codoped NaYF4 upconverting nanoparticles were prepared by a facile hydrothermal method. Under the excitation of 980 nm, the obtained compounds exhibited the featured emissions of Er3+ ions. The optical thermometric performance of the Er3+/Yb3+-codoped NaYF4 nanoparticles based on the thermally coupled 2H11/2 and 4S3/2 levels of Er3+ ions in the temperature range of 93–673 K was investigated by the fluorescence intensity ratio technique. The maximum sensitivity was approximately 0.0029 K−1, indicating that both low- and high-temperature detection can be synchronously achieved in Er3+/Yb3+-codoped NaYF4 upconverting nanoparticles. Furthermore, the temperature-dependent emitting color was discussed and it was changed from yellow to red with raising the temperature from 93 to 673 K. In addition, the internal heating properties of the developed nanoparticles caused by laser excitation power were also analyzed. It is found that the temperature of nanoparticles was elevated from 255.03 to 372.03 K with the increment of pump power from 84 to 585 mW. These characteristics suggest that the Er3+/Yb3+-codoped NaYF4 upconverting nanoparticles are a promising candidate for optical temperature sensors and safety signs as well as optical heaters.
1. Introduction
Over the last decades, trivalent lanthanide ions activated upconverting materials in which the near-infrared excitation photons can be converted into visible emissions via a multi-photon process have attracted considerable interest because of their versatile applications in cell imaging, cancer therapy, remote optical thermometry, solid-state lighting, and so on.1–5 Nowadays, erbium (Er3+), as a vital constituent part in lanthanide ions, is intensively studied as the activator for upconverting materials in virtue of its special emissions arising from the intra-4f transitions.6,7 In general, Er3+-based luminescent materials exhibit two emitting peaks in the green and red regions which are attributed to the (2H11/2, 4S3/2) → 4I15/2 and 4F9/2 → 4I15/2 transitions, respectively.8,9 Nevertheless, owing to the low absorption of the Er3+ ions in the infrared region, the Er3+ ions single-doped materials usually exhibit dissatisfactory luminescent efficiencies which restrict their applications. Thus, much effort should be made to improve the luminescent efficiency. Fortunately, ytterbium (Yb3+) reveals a strong broad absorption in the infrared region and the energy which is captured from incident photons by Yb3+ ions can be easily transferred to Er3+ ions, leading to excellent upconversion (UC) luminescent properties in Er3+/Yb3+-codoped materials.10–13 As a result, the applications of the Er3+ ions doped upconverting materials could be extended.
Temperature is a basic and vital parameter in various fields of medical science, industry and daily life, so its detection and monitoring with high accuracy as well as high sensitivity are required. Up to now, the conventional thermometers which are based on the principle of liquid or metal expansion have been widely used in our daily life. However, these traditional thermometers can not satisfy the requirement of medicine and biology, especially, for detecting the temperature distribution of the living cells. Recently, the non-contact optical temperature sensor which is based on the lanthanide ions doped upconverting luminescent materials utilizing the fluorescence intensity ratio (FIR) technique was developed for real-time detection because of its features of high-spatial resolution, high sensitivity and fast response.14–16 As for the FIR technique, it utilizes the variation of electron transition from two close lying levels (thermally coupled levels) of the lanthanide ions with the elevated temperature. Meanwhile, the energy gap between these two close lying levels should be in the range from 200 to 2000 cm−1 to prevent the overlap of two UC emission bands and to allow the upper excited level to possess a minimum population.17–19 Currently, the temperature sensing properties of the Er3+-based upconverting materials have been extensively investigated owing to its featured green UC emissions from the thermally coupled levels (2H11/2, 4S3/2) to the ground state (4I15/2) as well as the appropriate energy separation.20,21 According to previous reports,22–24 one knows that most of the Er3+-based optical temperature sensors can only be operated in either high temperature or low temperature circumstance, demonstrating that the low- and high-temperature monitoring can not be synchronously carried out in these optical thermal probes. To solve this problem, developing a temperature sensor which can be operated in a broad temperature range including low and high temperatures is required.
In this work, we chose the sodium yttrium fluoride (NaYF4) as the luminescent host because of its low phonon energy (around 362 cm−1) which helps to decrease the possibility of the non-radiative (NR) transition and to enhance the UC luminescent efficiency,25,26 and the Er3+/Yb3+-codoped NaYF4 nanoparticles were fabricated by means of a hydrothermal route. The phase composition, microstructure and room-temperature UC emission performance of the prepared nanoparticles were analyzed. Meanwhile, on the basis of FIR technique, the temperature-dependent UC emission spectra were recorded to investigate the temperature sensing properties. In addition, to explore the potential application of the obtained nanoparticles as an optical heater, the internal heating performance which is induced by the laser excitation power was detailedly studied by analyzing the pump power-dependent UC emission spectra.
2. Experimental
2.1 Synthesis of Er3+/Yb3+-codoped NaYF4 nanoparticles
The hydrothermal method was applied to synthesize the Er3+/Yb3+-codoped NaYF4 (abbreviated as: NaYF4:Er3+/Yb3+; here, the concentrations of Er3+ and Yb3+ were 2 and 20 mol%, respectively) nanoparticles.1 The raw materials, such as sodium fluoride (NaF; 99%), yttrium(III) nitrate hexahydrate (Y(NO3)3·6H2O; 99.8%), erbium(III) nitrate pentahydrate (Er(NO3)3·5H2O; 99.9%), ytterbium(III) nitrate pentahydrate (Yb(NO3)3·5H2O; 99.9%) and oleic alcohol, were purchased from Sigma-Aldrich. In a typical route, 0.6 g NaOH was first weighted and dissolved in 3 mL de-ionized (DI) water. Meanwhile, 10 mL oleic alcohol and 20 mL ethanol was added into the above mixture. Then the mixed solution was vigorously agitated until it became transparent. Subsequently, 1.56 mmol Y(NO3)3·6H2O (0.5 M), 0.04 mmol Er(NO3)3·5H2O (0.5 M), 0.4 mmol Yb(NO3)3·5H2O (0.5 M) and 8 mmol NaF (1 M) were slowly dropped into the former solution. The homogenous gelatinous mixture was then transferred into a 100 mL stainless steel autoclave after 30 min agitation. After that, the system was sealed and heated at 200 °C for 10 h. The final product was washed by DI water and ethanol for several times, and dried at 80 °C for 6 h in the air.
2.2 Characterization
The X-ray diffraction (XRD) measurement was carried out by using a X-ray diffractometer (Bruker D8 Advance) with Cu Kα radiation (λ = 1.54046 Å) to identify the crystal structure of synthesized nanoparticles. The particle size and microstructure properties of the obtained products were examined by using a field-emission scanning electron microscope (FE-SEM) (LEO SUPPA 55, Carl Zeiss) and transmission electron microscope (TEM) (JEM-2100F, JEOL) equipped with energy dispersive X-ray spectrum (EDS). For the UC emission measurement, a 980 nm diode laser was employed as the incident light source and the UC emission spectrum was recorded by using a spectrofluorometer (FS5). Under the excitation of 980 nm with the pump power of 84 mW, the temperature-dependent UC emission spectra were measured by FS5 and the temperature from 93 to 673 K was adjusted via a temperature controlled system (Linkam HFS600E-PB2).
3. Results and discussion
3.1 Phase composition and morphology properties
In order to explore the phase composition of the fabricated upconverting nanoparticles, the XRD pattern of the NaYF4:Er3+/Yb3+ nanoparticles was measured. As presented in Fig. S1,† the XRD pattern revealed that most of the diffraction peaks were well indexed to the hexagonal phase of the NaYF4 (JCPDS#16-0334), while there also existed several weak diffraction peaks corresponding to the cubic phase of NaYF4 (JCPDS#06-0342). The unit cell structures of the NaYF4 with hexagonal and cubic phases are shown in Fig. 1(b) and (c), respectively. To better analyze the crystal structure of the obtained nanoparticles, the Rietveld refinement was carried out by utilizing a General Structure Analysis System (GSAS) software and the corresponding profile is displayed in Fig. 1. The lattice parameters and the reliability factors are summarized in Table S1.† The reliability factors of refinement were Rp = 9.38%, Rwp = 12.58% and χ2 = 0.891, demonstrating that the quality of the refinement was receivable. Furthermore, on the basis of the XRD refinement, the NaYF4:Er3+/Yb3+ nanoparticles possessed the lattice parameters of a = b = 5.932823 (Å), c = 3.482378 (Å) and unit cell volume V = 106.152 (Å3), as shown in Table S1,† which were slightly smaller than that of the pure hexagonal NaYF4 (a = b = 5.96 Å, c = 3.53 Å and V = 125.39 Å3) because the larger-sized Y3+ (0.9 Å) ions were replaced by the smaller-sized Er3+ (0.89 Å) and Yb3+ (0.868 Å) ions.
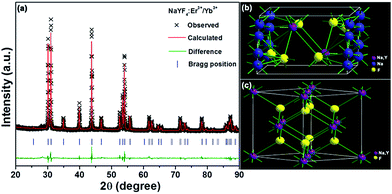 |
| | Fig. 1 (a) Rietveld XRD refinement for the NaYF4:Er3+/Yb3+ nanoparticles. (b and c) Schematic presentation of the hexagonal and cubic structure of NaYF4, respectively. | |
The FE-SEM and TEM analyses were employed to observe the microstructure and particle size of the resultant samples. The FE-SEM image, as shown in Fig. 2(a), confirmed that the as-prepared compounds consisted of uniformly hexagonal nanoprisms. The average diameter of these hexagonal nanoprisms was determined to be about 419 nm and the length was approximately 370 nm. The TEM image (Fig. 2(b)) further revealed the uniform nanoparticles with the shape of hexagonal prism matched well with the aforementioned FE-SEM result. As demonstrated in Fig. 2(c), the high-resolution TEM (HR-TEM) image presented clear lattice fringes and the interplanar spacing was estimated to be around 2.91 Å which is close to the d-spacing value of (101) plane of hexagonal NaYF4. The selected area electron diffraction (SAED) pattern suggested that the obtained nanoparticles were of single crystalline in nature (see Fig. 2(d)). The elemental mappings revealed that the constituent elements (Na, Y, F, Er and Yb) were homogeneously distributed in the region of the nanoparticles, as depicted in Fig. 3(a). Fig. 3(b) shows the EDS spectrum of the NaYF4:Er3+/Yb3+ nanoparticles. The presence of the pattern peaks of Na, Y, F, Er and Yb in the EDS spectrum indicated the formation of the Er3+/Yb3+-codoped NaYF4 nanoparticles.
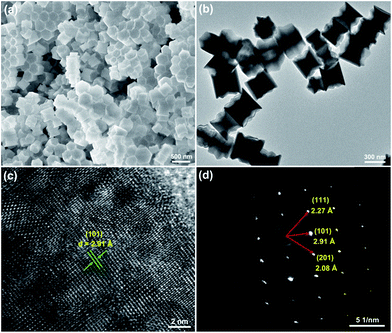 |
| | Fig. 2 (a) FE-SEM image, (b) TEM image, (c) HR-TEM image and (d) SAED pattern of the NaYF4:Er3+/Yb3+ nanoparticles. | |
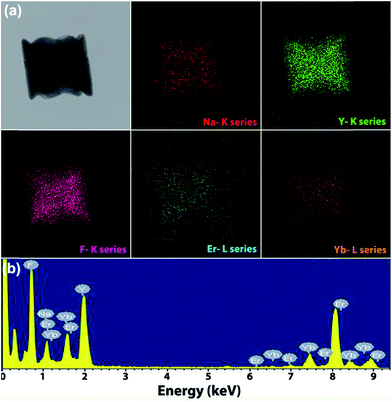 |
| | Fig. 3 (a) Elemental mappings and (b) EDS spectrum of the NaYF4:Er3+/Yb3+ nanoparticles. | |
3.2 Room-temperature UC emissions and energy level diagram
To evaluate the UC luminescence properties of the NaYF4:Er3+/Yb3+ nanoparticles, the UC emission spectrum was measured at room temperature under the excitation of 980 nm laser diode with the fixed pump power of 84 mW. As shown in Fig. 4, the UC emission spectrum was dominated by an intense red emission centered at around 662 nm which is assigned to the 4F9/2 → 4I15/2 transition along with two green emissions at 523 and 542 nm due to the 2H11/2 → 4I15/2 and 4S3/2 → 4I15/2 transitions of Er3+ ions, respectively.27–29 Meanwhile, a weak blue emission located at around 490 nm (4F7/2 → 4I15/2) was also detected (see Fig. 4).30 The simplified energy level diagram of Er3+ and Yb3+ ions, which was employed to expound the UC mechanism for the generation of the characteristic emissions of Er3+ ions, is depicted in the inset of Fig. 4. As demonstrated in the energy level diagram, the incident photons are first captured by the Yb3+ ions, and then the electrons in the ground state, 2F7/2, are pumped to the excited state of 2F5/2. Due to the superior energy level overlap between the Yb3+ and Er3+ ions, an efficient ET would arise from the Yb3+ ions to the adjacent Er3+ ions, i.e., Yb3+ (2F5/2) + Er3+ (4I15/2) → Yb3+ (2F7/2) + Er3+ (4I11/2), leading to the population of the 4I11/2 level of Er3+ ions. Meanwhile, the 4F7/2 level will be populated from the 4I11/2 level either by directly absorbing an incident photon or a second ET from Yb3+ to Er3+ ions (Yb3+ (2F5/2) + Er3+ (4I11/2) → Yb3+ (2F7/2) + Er3+ (4F7/2)). Subsequently, the majority of electrons in the 4F7/2 level nonradiatively decay to the 2H11/2 and 4S3/2 levels. As a result, the blue and green emissions are generated because of the radiative transition processes, namely, 4F7/2 → 4I15/2, 2H11/2 → 4I15/2 and 4S3/2 → 4I15/2. For the intense red emission, there exist two routes to populate the 4F9/2 level. As presented in the inset of Fig. 4, part of the electrons in the 4I11/2 level can nonradiatively relax to the 4I13/2 level, and these electrons can be further excited to the 4F9/2 level through an efficient ET from Yb3+ to Er3+ ions (Yb3+ (2F5/2) + Er3+ (4I13/2) → Yb3+ (2F7/2) + Er3+ (4F9/2)). In addition, the nonradiative (NR) transition from the 4S3/2 level can also contribute to the population of the 4F9/2 level. Owing to these efficient processes, bright red emission corresponding to the 4F9/2 → 4I15/2 transition was achieved.
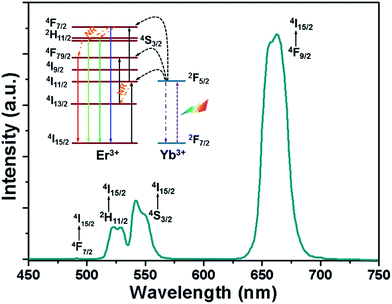 |
| | Fig. 4 Room-temperature UC emission spectrum of the NaYF4:Er3+/Yb3+ nanoparticles excited under 980 nm light with the pump power of 84 mW. Inset shows the simplified energy level diagram of Er3+ and Yb3+ ions. | |
3.3 Temperature sensing properties
On the basis of the UC emission spectrum (Fig. 4), one knows that the energy separation between the 2H11/2 and 4S3/2 levels was about 607.3 cm−1 (19 nm) which makes the 2H11/2 level to be populated from the 4S3/2 level by thermal excitation, leading to the variation in the FIR values of the green emissions from the (2H11/2, 4S3/2) → 4I15/2 transitions of Er3+ ions at the elevated temperature. Therefore, the non-contact temperature thermometry is expected to be realized in Er3+ ions doped luminescent materials by the FIR technique. In order to explore the suitability of the obtained nanoparticles for applications in optical temperature sensor, the dependence of UC emissions on temperature was recorded. Fig. 5 shows the green UC emission spectra (normalized at the emission band of 542 nm) of the NaYF4:Er3+/Yb3+ nanoparticles with the varied temperature from 93 to 673 K. As depicted in Fig. 5, the positions of the emission peaks hardly changed with increasing the temperature, whereas the UC emission intensity from the 2H11/2 level showed a gradually rising tendency compared to that from the 4S3/2 level. The FIR values of the green UC emissions arising from the 2H11/2 → 4I15/2 and 4S3/2 → 4I15/2 transitions were calculated as presented in Fig. 6(a). Clearly, the FIR value varied from 0.275 to 1.657 with increasing the temperature from 93 to 673 K. According to the Boltzmann distribution theory and by ignoring the effects from self-absorption of emissions, the FIR from two thermally coupled levels can be defined as:15,31,32| |
 | (1) |
where IH and IS are the integrated luminescent emission intensities for the 2H11/2 → 4I15/2 and 4S3/2 → 4I15/2 transitions of Er3+ ions, respectively. N(H) and N(S) represent the population number of the 2H11/2 and 4S3/2 levels, respectively. ΔE is the energy gap between the 2H11/2 and 4S3/2 levels. k is the Boltzmann constant. T is the absolute temperature. A and B are the constants. Through analyzing the experimental data with the help of eqn (1), the coefficients A and B were found to be 4.039 and 0.319, respectively, and the energy gap between the thermally coupled levels of 2H11/2 and 4S3/2 was ΔE ∼ 519.9 cm−1 which is close to the value obtained from the UC emission spectrum.
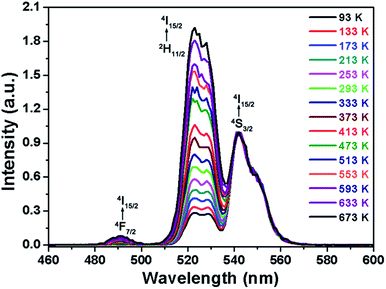 |
| | Fig. 5 Normalized green UC emission spectra of the NaYF4:Er3+/Yb3+ nanoparticles with different temperatures ranging from 93 to 673 K. | |
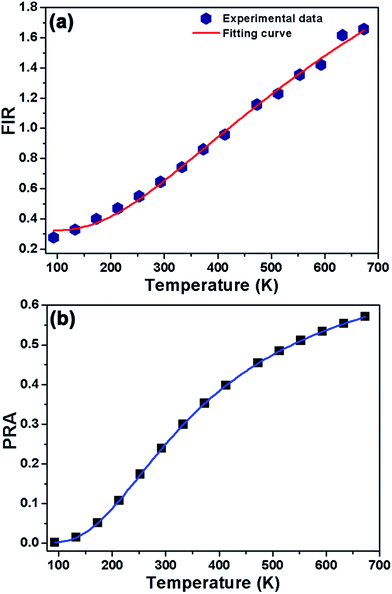 |
| | Fig. 6 (a) Temperature-dependent FIR values of IH/IS for the NaYF4:Er3+/Yb3+ nanoparticles. (b) Temperature-dependent PRA values of the 2H11/2 and 4S3/2 thermal coupled levels. | |
For the aforementioned channel to obtain the temperature-induced population redistribution, the temperature-dependent population redistribution ability (PRA) is given by the following expression:33,34
| |
 | (2) |
where
IU and
IL are the integrated luminescent emission intensities from the upper and lower thermally coupled levels to ground sate, respectively.
IH and
IS possess the same meaning as described in
eqn (1). Combined with
eqn (1) and
(2), the PRA can be approximately rewritten as:
| |
 | (3) |
where
A, Δ
E,
k and
T exhibit the same meaning as presented in
eqn (1). In present work, according to the above fitting result, one obtains that the values of
A and Δ
E were 4.039 and 519.9 cm
−1, respectively. The temperature-dependent PRA of
2H
11/2 and
4S
3/2 thermally coupled levels was estimated as depicted in
Fig. 6(b). It is evident that the PRA value can be significant affected by the absolution temperature. When the temperature was 93 K, the PRA value was as low as 0.0013. Nevertheless, with elevating the temperature, the value of PRA increased rapidly, reaching its maximum value of about 0.5706 when the temperature was 673 K, suggesting that the population between the
2H
11/2 and
4S
3/2 levels can be prominently affected by the external temperature. Therefore, the NaYF
4:Er
3+/Yb
3+ nanoparticles were expected to show superior temperature sensing properties.
To apprehend the sensing ability of the synthesized nanoparticles, it is necessary to investigate the sensor sensitivity. As we know, the relative sensor sensitivity is the rate of FIR changes in response to the change of absolute temperature and it can be expressed:35–37
| |
 | (4) |
By means of
eqn (4), the relative sensitivity as a function of absolution temperature was estimated, as can be seen in
Fig. 7. The NaYF
4:Er
3+/Yb
3+ nanoparticles can be worked in the temperature range of 93–673 K and the maximum sensitivity was approximately 0.0029 K
−1 at the temperature of 368 K. Furthermore, the sensitivity was slightly changed at higher temperature and the sensitivity was around 0.0022 K
−1 when the temperature was 673 K. In compare with other Er
3+/Yb
3+-coactivated upconverting luminescent materials, like oxides, tungsten-tellurite glasses, ceramics, sulfides and fluoride nanoparticles, for temperature thermometry, as demonstrated in
Table 1, a satisfied result was obtained in the NaYF
4:Er
3+/Yb
3+ nanoparticles. Different with other temperature sensing materials in which only the high temperature thermometry was available, the NaYF
4:Er
3+/Yb
3+ nanoparticles possessed a broad operating temperature range from 93 to 673 K. In addition, the present sensitivity obtained from the NaYF
4:Er
3+/Yb
3+ nanoparticles was also comparable with other fluoride-based temperature sensors (see
Table 1). These characteristics make the NaYF
4:Er
3+/Yb
3+ nanoparticles suitable for optical temperature sensor applications.
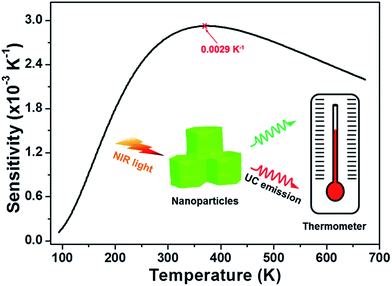 |
| | Fig. 7 Relative sensor sensitivity as a function of temperature for the NaYF4:Er3+/Yb3+ nanoparticles. | |
Table 1 Temperature range and maximum sensitivity of Er3+ ions doped compounds
| Compounds |
Temperature (K) |
Sensitivity (K−1) |
Excitation wavelength (nm) |
References |
| CaWO4:Er3+/Yb3+ |
300–540 |
0.0025 |
980 |
39 |
| BaTiO3:Er3+/Yb3+ |
120–505 |
0.0019 |
980 |
40 |
| Gd2O3:Er3+/Yb3+ |
300–900 |
0.0039 |
980 |
41 |
| TeO2-WO3:Er3+/Yb3+ |
300–690 |
0.0028 |
980 |
42 |
| La2O2S:Er3+/Yb3+ |
300–573 |
0.0080 |
980 |
43 |
| La2S3:Er3+/Yb3+ |
293–900 |
0.0075 |
971 |
44 |
| NaYF4:Er3+/Yb3+/Gd3+/Nd3+ |
288–328 |
0.0026 |
976 |
45 |
| NaLuF4:Er3+/Yb3+ |
303–523 |
0.0052 |
980 |
46 |
| β-NaGdF4:Er3+/Yb3+ |
303–563 |
0.0037 |
980 |
47 |
| NaYF4:Er3+/Yb3+ |
93–673 |
0.0029 |
980 |
Present work |
3.4 Temperature-dependent CIE chromaticity coordinates
From the temperature-dependent UC emission spectra of the NaYF4:Er3+/Yb3+ nanoparticles, as described in Fig. S2,† both the green and red emission intensities exhibited a declining tendency with the elevated temperature which was assigned to the thermal quenching effect. As is known, the NR transition possibility for the multiphonon relaxation can be expressed as:26,38| | |
WNR(T) = WNR(0)[1 − exp(−hν/kT)]−ΔE/kT,
| (5) |
where WNR(T) and WNR(0) stand for the NR relaxation probability at the temperature of T and T = 0 K, respectively, hν is the phonon energy, k is the Boltzmann coefficient, T is the temperature and ΔE is the energy separation involved. Clearly, the WNR(T) value is proportional to temperature, namely, the higher temperature contributes to the larger WNR(T) value. Thus, when the temperature was increased, the quenching of the luminescent emission intensity was caused. As presented in the inset of Fig. S2,† the emission intensity ratio of red to green emissions (IR/IG) was enhanced with the increment of temperature, indicating that color-controllable emissions could be realized in the NaYF4:Er3+/Yb3+ nanoparticles by properly adjusting the temperature. From the UC emission spectra, the CIE chromaticity coordinates of the NaYF4:Er3+/Yb3+ nanoparticles as a function of temperature were calculated and the corresponding results are depicted in Fig. 8 and Table S2.† It is evident that the emitting color of the synthesized nanoparticles was shifted from yellow to red with controlling the temperature from 93 to 673 K (see Fig. 8). These multicolor emissions further confirmed that the emission intensity ratio of IR/IG trended to increase with raising the temperature which matched well with the result presented in the inset of Fig. S2.† The temperature-induced multicolor emission properties suggested that the NaYF4:Er3+/Yb3+ nanoparticles may also have promising applications in high-temperature environment as a safety sign apart from the temperature sensor.
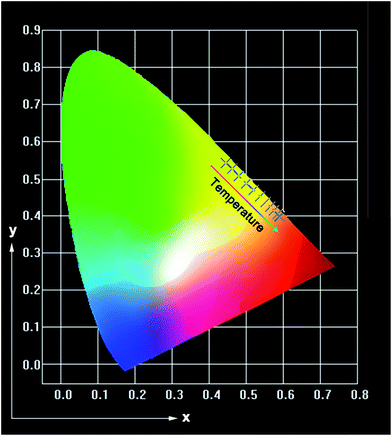 |
| | Fig. 8 CIE chromaticity coordinates of the NaYF4:Er3+/Yb3+ nanoparticles at different temperatures. | |
3.5 Optical heating ability
As is known, whenever the RE ions activated materials are exposed to the incident light source, a small portion of the incident photons absorbed by the optical materials will be converted into heat through the NR relaxation route. Consequently, the temperature of the product will be increased. This characteristic makes the luminescent materials appropriate for optical heaters. For the purpose of analyzing the thermal effect induced by the laser excitation, the pump power-dependent UC emission spectra were examined. The normalized green UC emission spectra of the NaYF4:Er3+/Yb3+ nanoparticles at the different pump powers of 84–585 mW are illustrated in the inset of Fig. 9 and the corresponding FIR values are calculated, as listed in Table S3.† Clearly, the FIR value varied from 0.534 to 0.860 with the increased pump power from 84 to 585 mW. From the aforementioned FIR technique, one obtains that an exact FIR value stands for a special temperature. Therefore, the internal heating performance of the host lattice induced by laser could be evaluated by rewriting eqn (1) and the temperature (T) can be calculated through the following formula:| |
 | (6) |
where the A, B and ΔE values were determined to be approximately 4.039, 0.319 and 519.9 cm−1, respectively. On the basis of eqn (6), the temperature of the NaYF4:Er3+/Yb3+ nanoparticles as a function of pump power was calculated. It is clear that the temperature exhibited an increasing tendency with raising the pump power and the maximum value was around 372.03 K when the pump power was 585 mW (see Fig. 9 and Table S3†), confirming that the NaYF4:Er3+/Yb3+ nanoparticles possessed the capability of converting the incident photons (laser excitation power) into heat. As a result, the NaYF4:Er3+/Yb3+ nanoparticles were promising candidates as optical heaters.
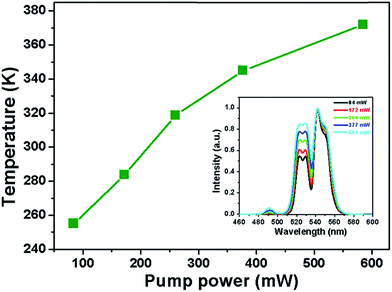 |
| | Fig. 9 Sample temperature as a function of pump power. Inset depicts the normalized green UC emission spectra of the NaYF4:Er3+/Yb3+ nanoparticles with different pump powers. | |
4. Conclusions
In summary, the highly efficient Er3+/Yb3+-codoped NaYF4 upconverting nanoparticles were synthesized by a facile hydrothermal approach. The visible UC emission peaks situated at about 490, 523, 542 and 662 nm, which originated from the intra-4f transitions of Er3+ ions, were observed when excited at 980 nm of near-infrared light. The optical thermometric properties of the NaYF4:Er3+/Yb3+ nanoparticles in the temperature range of 93–673 K were studied via utilizing the FIR technique of two green UC emissions from two thermally coupled levels of 2H11/2 and 4S3/2. The maximum sensitivity was found to be around 0.0029 K−1 at 368 K. Furthermore, the emitting color of the as-prepared nanoparticles was tuned from yellow to red with the increased absolute temperature from 93 to 673 K. Additionally, through theoretical calculation, the laser excitation power-induced thermal effect was investigated and the temperature of nanoparticles varied from 255.03 to 372.03 K with the increase of pump power from 84 to 585 mW. These results demonstrated that the NaYF4:Er3+/Yb3+ nanoparticles are promising multifunctional upconverting luminescent materials for noninvasive temperature thermometry, optical heater and safety sign for high-temperature circumstance.
Acknowledgements
This work was supported by the National Research Foundation of Korea (NRF) Grant funded by the Korea government (MSIP) (No. 2015R1A5A1037656).
Notes and references
- Z. Yi, X. Li, Z. Xue, X. Liang, W. Lu, H. Peng, H. Liu, S. Zeng and J. Hao, Adv. Funct. Mater., 2015, 25, 7119–7129 CrossRef CAS.
- L. Cheng, C. Wang and Z. Liu, Nanoscale, 2013, 5, 23–37 RSC.
- D. Gao, D. Tian, G. Xiao, B. Chong, G. Yu and Q. Pang, Opt. Lett., 2015, 40, 3580–3583 CrossRef PubMed.
- Y. Zhong, I. Rostami, Z. Wang, H. Dai and Z. Hu, Adv. Mater., 2015, 27, 6418–6422 CrossRef CAS PubMed.
- Y. Tian, Y. Tian, P. Huang, L. Wang, Q. Shi and C. Cui, Chem. Eng. J., 2016, 297, 26–34 CrossRef CAS.
- S. Zhao, W. Liu, X. Xue, Y. Yang, Z. Zhao, Y. Wang and B. Zhou, RSC Adv., 2016, 6, 81542–81551 RSC.
- P. Du, L. Luo, W. Li and Q. Yue, J. Appl. Phys., 2014, 116, 014102 CrossRef.
- X. Huang, Opt. Mater. Express, 2016, 6, 2165–2176 CrossRef.
- S. S. Perera and F. A. Rabuffetti, CrystEngComm, 2016, 18, 5818–5825 RSC.
- D. He, C. Guo, S. Zhou, L. Zhang, Z. Yang, C. Duan and M. Yin, CrystEngComm, 2015, 17, 7745–7753 RSC.
- X. Huang and J. Lin, J. Mater. Chem. C, 2015, 3, 7652–7657 RSC.
- F. Wang, Y. Han, C. S. Lim, Y. Lu, J. Wang, J. Xu, H. Chen, C. Zhang, M. Hong and X. Liu, Nature, 2010, 463, 1061–1065 CrossRef CAS PubMed.
- W. Bian, Y. Qi, W. Lu, X. Yu, X. Xu and J. Qiu, CrystEngComm, 2016, 18, 2642–2649 RSC.
- Z. Zhang, C. Guo, H. Suo, X. Zhao, N. Zhang and T. Li, Phys. Chem. Chem. Phys., 2016, 18, 18828–18834 RSC.
- X. Wang, Q. Liu, Y. Bu, C. Liu, T. Liu and X. Yan, RSC Adv., 2015, 5, 86219–86236 RSC.
- A. K. Soni, A. Kumari and V. K. Rai, Sens. Actuators, B, 2015, 216, 64–71 CrossRef CAS.
- K. Zheng, Z. Liu, C. Lv and W. Qin, J. Mater. Chem. C, 2013, 1, 5502–5507 RSC.
- A. Pandey, V. K. Rai, V. Kumar, V. Kumar and H. C. Swart, Sens. Actuators, B, 2015, 209, 352–358 CrossRef CAS.
- H. Suo, C. Guo, Z. Yang, S. Zhou, C. Duan and M. Yin, J. Chem. Mater. C, 2015, 3, 7379–7385 RSC.
- P. Du, L. Luo, W. Li, Q. Yue and H. Chen, Appl. Phys. Lett., 2014, 104, 152902 CrossRef.
- H. Zhang, D. Peng, W. Wang, L. Dong and C. Pan, J. Phys. Chem. C, 2015, 119, 28136–28142 CAS.
- S. Liu, D. Chen, Z. Wan, Y. Zhou, P. Huang and Z. Ji, RSC Adv., 2016, 6, 71176–71187 RSC.
- V. Lojpur, G. Nikolić and M. D. Dramićanin, J. Appl. Phys., 2014, 115, 203106 CrossRef.
- S. F. León-Luis, V. Monteseguro, U. R. Rodríguez-Mendoza, M. Rathaiah, V. Venkatramu, A. D. Lozano-Gorrín, R. Valiente, A. Muñoz and V. Lavín, RSC Adv., 2014, 4, 57691–57701 RSC.
- J. Shan, M. Uddi, N. Yao and Y. Ju, Adv. Funct. Mater., 2010, 20, 3530–3537 CrossRef CAS.
- G. Chen, H. Liu, H. Liang, G. Somesfalean and Z. Zhang, J. Phys. Chem. C, 2008, 112, 12030–12036 CAS.
- D. Gao, X. Zhang and W. Gao, ACS Appl. Mater. Interfaces, 2013, 5, 9732–9739 CAS.
- D. Gao, D. Tian, X. Zhang and W. Gao, Sci. Rep., 2016, 6, 22433 CrossRef CAS PubMed.
- P. Du, L. Luo, H. Park and J. S. Yu, Chem. Eng. J., 2016, 306, 840–848 CrossRef CAS.
- L. Huang, X. Liu, W. Xu, B. Chen and J. Lin, J. Appl. Phys., 2001, 90, 5550–5553 CrossRef CAS.
- P. Du, L. Luo and J. S. Yu, J. Alloys Compd., 2015, 632, 73–77 CrossRef CAS.
- W. Xu, H. Zhao, Y. Li, L. Zheng, Z. Zhang and W. Cao, Sens. Actuators, B, 2013, 188, 1096–1100 CrossRef CAS.
- X. Wang, J. Zheng, Y. Xuan and X. Yan, Opt. Express, 2013, 21, 21596–21606 CrossRef CAS PubMed.
- X. Wang, C. Liu and X. Yan, RSC Adv., 2014, 4, 24170–24175 RSC.
- L. H. Fischer, G. S. Harms and O. S. Wolfbeis, Angew. Chem., Int. Ed, 2011, 50, 4546–4551 CrossRef CAS PubMed.
- F. Huang, Y. Gao, J. Zhou, J. Xu and Y. Wang, J. Alloys Compd., 2015, 639, 325–329 CrossRef CAS.
- P. Du, L. Luo, Q. Yue and W. Li, Mater. Lett., 2015, 143, 209–211 CrossRef CAS.
- L. A. Riseberg and H. W. Moos, Phys. Rev., 1968, 174, 429–438 CrossRef CAS.
- X. Cheng, K. Yang, J. Wang, L. Yang and X. Cheng, Opt. Mater., 2016, 58, 449–453 CrossRef CAS.
- M. K. Mahata, T. Koppe, T. Mondal, C. Brüsewitz, K. Kumar, V. K. Rai, H. Hofsäss and U. Vetter, Phys. Chem. Chem. Phys., 2015, 17, 20741–20753 RSC.
- B. Tian, B. Chen, Y. Tian, X. Li, J. Zhang, J. Sun, S. Fu, H. Zhong, X. Zhang, H. Yu and R. Hua, Mater. Express, 2013, 3, 241–246 CrossRef CAS.
- A. Pandey, S. Som, V. Kumar, V. Kumar, K. Kumar, V. K. Rai and H. C. Swart, Sens. Actuators,
B, 2014, 202, 1305–1312 CrossRef CAS.
- Y. Yang, C. Mi, F. Yu, X. Su, C. Guo, G. Li, J. Zhang, L. Liu, Y. Liu and X. Li, Ceram. Int., 2014, 40, 9875–9880 CrossRef CAS.
- Y. Yang, C. Mi, F. Jiao, X. Su, X. Li, L. Liu, J. Zhang, F. Yu, Y. Liu and Y. Mai, J. Am. Ceram. Soc., 2014, 97, 1769–1775 CrossRef CAS.
- D. T. Klier and N. U. Kumke, RSC Adv., 2015, 5, 67149–67156 RSC.
- K. Zheng, W. Song, G. He, Z. Yuan and W. Qin, Opt. Express, 2015, 23, 7653–7658 CrossRef PubMed.
- D. Chen, Z. Wan, Y. Zhou, P. Huang, J. Zhong, M. Ding, W. Xiang, X. Liang and Z. Ji, J. Alloys Compd., 2015, 638, 21–28 CrossRef CAS.
Footnote |
| † Electronic supplementary information (ESI) available. See DOI: 10.1039/c6ra22349d |
|
| This journal is © The Royal Society of Chemistry 2016 |
Click here to see how this site uses Cookies. View our privacy policy here.  Open Access Article


