Enhanced adsorption of orthophosphate and copper onto hydrochar derived from sewage sludge by KOH activation

Ana Spatarua, Rohan Jain*ab, Jae Wook Chunga, Gabriel Gernerc, Rolf Krebsc and Piet N. L. Lensab
aUNESCO-IHE, Westvest 7, 2611 AX Delft, The Netherlands. E-mail: rohanjain.iitd@gmail.com; Fax: +31 152122921; Tel: +31 152151715
bDepartment of Chemistry and Bioengineering, Tampere University of Technology, Korkeakoulunkatu 10, FI-33720 Tampere, Finland
cInstitute of Natural Resource Sciences, Zurich University of Applied Sciences, Grüental, 8820 Wädenswil, Switzerland

Received 6th September 2016 , Accepted 17th October 2016

First published on 18th October 2016


Abstract

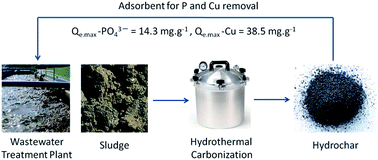
Hydrothermal carbonization producing hydrochar from organic waste is increasingly gaining attention to deal with the challenge of excess waste activated sludge produced during centralized aerobic wastewater treatment. Hydrochar is used as an adsorbent for the removal of organics, metals and biotic contaminants. This study demonstrated the application of KOH activated hydrochar, called enhanced hydrochar (EHC) derived from sewage sludge, for the removal of orthophosphate from wastewater by means of batch adsorption, zetametry and infrared spectroscopy. The maximum Qe-PO43− of EHC was 14.3 mg orthophosphate adsorbed per g of EHC when the initial orthophosphate concentration was increased to 150 mg L−1. The application of orthophosphate removal by EHC from the effluent of a constructed wetland was demonstrated by achieving more than 97% orthophosphate removal at an EHC dosage of 6.0 g L−1 and an initial orthophosphate concentration of 13.1 mg L−1. pH dependent adsorption experiments and infrared spectroscopy showed the orthophosphate removal by EHC was due to the replacement of hydroxyl groups by orthophosphate in the EHC. Acid–base titration showed the KOH washing of the raw hydrochar (RHC) led to a 1.7 times increase in the hydroxyl groups in EHC compared to RHC. This study further confirmed the higher uptake capacity of EHC compared to RHC towards copper as a model divalent cation. EHC can thus be applied for the removal of both anions (orthophosphate) and cations (copper) from wastewater.


1. Introduction

Sewage sludge disposal is an environmental challenge resulting in high operation costs for wastewater treatment plants. The hydrothermal carbonization process, where waste sludge is transformed under wet conditions and at low temperatures to hydrochar, is an increasingly used method to deal with the challenge of excess sludge disposal.1 The hydrochar is a valuable end product as it can be applied in soil management.2 In addition, it is a novel low cost adsorbent for the removal of organic,3,4 heavy metal5–8 and biotic9 contaminants from wastewaters. Further, the metal, such as Ca, concentration is increased in the hydrochar upon hydrothermal carbonization when compared to the starting material, thus providing a possibility for higher adsorption of cationic as well anionic inorganic contaminants.10

Phosphorus is an essential element for maintaining our food security, but its supply in the long term is at risk.11 One of the major reasons for the supply risk of phosphorus is its loss in agricultural wastewaters and run-off, mainly in the form of orthophosphate when it is applied as a fertilizer.11 Adsorption can be an effective method for the removal and recovery of phosphorus from these agricultural wastewaters as adsorption is low-cost, fast, efficient and works well for large volumes of wastewater with a low contaminant concentration.12,13

As the hydrochar has a negative ζ-potential,9 it is expected to be a very good adsorbent for positively charged cations such as Cd2+, Cu2+, Zn2+.5,14 Interestingly, Chung et al. (2014, 2015) demonstrated the removal of negatively charged biotic contaminants such as rotavirus, adenovirus and Escherichia coli on hydrochar derived from sewage sludge and maize.9,15 However, the adsorption capacity of hydrochar towards negatively charged anions, such as orthophosphate is not known.16 Chung et al. (2014) showed that a modification or pre-treatment of the hydrochar by KOH treatment significantly improved the adsorption capacity of the hydrochar derived from maize to remove E. coli.15 Similarly, Dai et al. (2014) demonstrated the adsorption of phosphorus by lanthanum doped hydrochar.16 However, there is so far no study that evaluated the adsorption of orthophosphate by (KOH treated) hydrochar derived from sewage sludge. The objective of this study was to solve the challenge of excess sewage sludge by converting sewage sludge to activated hydrochar by KOH washing for the adsorption of orthophosphate from the effluent of constructed wetlands.

This study explored the adsorption of orthophosphate as model anion by hydrochar produced from sewage sludge via hydrothermal carbonization followed by KOH pre-treatment. Further, the adsorption of copper as model divalent cation was also studied to observe the effect of KOH treatment on the hydrochar ability to adsorb positively charged ions. Copper was chosen for its economic importance and toxic effects to biota. The pH, initial concentration and contact time were varied in order to understand adsorption phenomena for the two considered pollutants. The adsorption mechanisms of orthophosphate and copper onto hydrochar were studied by infra-red spectroscopy and zeta-potential measurements. Prior to adsorption, raw hydrochar (RHC) and KOH pre-treated enhanced hydrochar (EHC) were characterized by means of acid–base titration. The application of EHC for the removal of orthophosphate from the effluent of a constructed wetland was also evaluated.

2. Materials and methods

2.1 Production of RHC and EHC

The production of the RHC and EHC has been described in detail in earlier studies.9,15 Briefly, sewage sludge was hydrothermally carbonized for 5 h at 210 °C and a pressure between 21 and 24 bar to produce RHC. The produced RHC was washed with 1 M KOH followed by washing with DI water to produce EHC.

2.2 Characterization of the adsorbent

FTIR-PAS infrared spectra in the wavelength range of 4000–560 cm−1 were recorded on a Tensor 37 FTIR Spectrometer (Bruker Optics, Fällanden, Switzerland) as described by Chung (2016).17 An average determination of 32 single spectra was carried out after analysis to improve the signal-to-noise ratio. Prior to FTIR-PAS analysis, samples had been dried at 105 °C for 1 h and were then stored in a desiccator at room temperature. The zeta potential measurements of EHC and RHC were carried out as described previously.17

Acid–base titration was carried out on 0.05 g RHC and EHC in 1 mM NaCl using a 0.03 M HCl titrant under continuous supply of N2 gas (Titrino plus) as described by Jain et al. (2015).18 Prior to the titration, a known amount of NaOH (0.1 M) was used to increase the pH of the solution above 10 (±0.2). The modeling of the acid–base titration was carried out by PROTOFIT 2.1 software.19 Two acidic and one basic site were considered in a three sites non-electrostatic model with an extended Debye–Hückel activity coefficient for the modeling of both EHC and RHC as described previously.18,20 The surface area used in the modeling for RHC and EHC was, respectively, 25.3 m2 g−1 and 18.5 m2 g−1.9

2.3 Batch adsorption studies

Batch adsorption experiments for removal of orthophosphate and copper by the hydrochar were carried out in triplicate at room temperature (21 ± 1 °C) using 2.0 g L−1 of RHC or EHC.

The time dependency experiments for orthophosphate removal were carried out for 24 h at an initial pH and orthophosphate concentration of, respectively, 7.0 and 10.0 mg L−1. The effect of pH on orthophosphate removal was studied by varying the initial pH from 3.0 to 8.0 with 10.0 mg L−1 of initial orthophosphate concentration. The orthophosphate adsorption isotherm study was carried out by varying the initial orthophosphate concentration from 0.5 mg L−1 to 150.0 mg L−1 at an initial pH of 7.0.

The time dependency experiments for copper removal were carried out for 16 h at initial pH and copper concentration of, respectively, 5.0 and 70.0 mg L−1. The effect of pH on copper removal was studied by varying the initial pH from 3.0 to 6.5 with 70.0 mg L−1 of initial copper concentration. The copper adsorption isotherm study was carried out by varying the initial copper concentration from 5.0 mg L−1 to 200.0 mg L−1 at an initial pH of 5.0.

After achieving equilibrium in the batch adsorption test, solid–liquid separation was carried out by filtration through a glass fiber filter of 0.45 μm and the orthophosphate or copper concentrations were measured in the filtrate.

2.4 Orthophosphate removal from the effluent of a constructed wetland

The effluent of a constructed wetland was obtained from a lab scale operational recirculating vertical flow constructed wetland treating artificial domestic wastewater as described by Zapater et al. (2011).21 The orthophosphate removal was studied in the shake flask experiments by varying the EHC dosage (0.5–6.0 g L−1).

2.5 Infra-red spectroscopy and zeta-potential measurements of orthophosphate and copper loaded EHC and RHC

100 mg L−1 of orthophosphate or copper was added to 2.0 g L−1 of EHC and RHC. The orthophosphate or copper loaded EHC and RHC were used for measurements of their zeta potential as described previously.17 For the infra-red spectroscopy measurements, the orthophosphate or copper loaded EHC and RHC were separated by centrifugation (37[thin space (1/6-em)]000g, 15 min Hermle Z36HK) after achieving equilibrium. The separated solids were dried at 105 °C for 1 h and were then stored in a desiccator at room temperature prior to FTIR measurements as described in Section 2.2.

2.6 Analytics

The chemical oxygen demand (COD), total nitrogen and total phosphorus concentrations were measured using standard methods as described earlier.21 Copper was analyzed with an atomic adsorption spectrophotometer (Perkin Elmer lamps at 324.8 nm wavelength) as described earlier.22 Orthophosphate was measured by UV-VIS spectrophotometry (Perkin Elmer Lambda) at 700 nm after reaction with, respectively, molybdate and ascorbic acid.23

3. Results

3.1 Hydrochar characterization

The elemental composition of RHC and EHC is detailed in Chung (2016).17 The RHC and EHC are mainly composed of carbon and oxygen. The EHC showed a lower phosphorus (2.7 wt%) content when compared to RHC (4.5%). The content of other elements in RHC and EHC did not show any significant differences. It is important to note that copper was not detected in both RHC and EHC.

The acid–base titration curve of the RHC and EHC is significantly different (Fig. 1a): the pH drop of RHC after the HCl addition was much steeper when compared to EHC, suggesting a larger number of alkaline groups in the EHC. The modeled data fitted well for the RHC and EHC in the pH range of 3.0–9.0 (Fig. 1a). The fitting is slightly poorer for EHC at pH values exceeding 9.0, probably because of the unaccounted leftover KOH present in the sample after the KOH washing step.


image file: c6ra22327c-f1.tif
Fig. 1 (a) Acid–base titration experiments for EHC (image file: c6ra22327c-u1.tif) and RHC (image file: c6ra22327c-u2.tif) and modelled titration curve for EHC (image file: c6ra22327c-u3.tif) and RHC (image file: c6ra22327c-u4.tif), (b) change in pH with addition of HCl for EHC (image file: c6ra22327c-u5.tif) and RHC (image file: c6ra22327c-u6.tif), (c) site density (mol kg−1) of different functional groups for EHC and RHC and (d) surface charge (C m−2) density for EHC (image file: c6ra22327c-u7.tif) and RHC (image file: c6ra22327c-u8.tif).

The changes in pH when plotted as a function of the solution pH reveal the pKa of the various functional groups present on the RHC and EHC (Fig. 1b). The local maxima in Fig. 1b represent the maximum change in pH values and hence represent the equivalence point of functional groups. On the other hand, the local minima represent the minimum change in pH and represent the pKa of the functional groups.24 For EHC and RHC, the local minimum was observed at, respectively, pH 7.5 and 7.0 (Fig. 1b) corresponding to phosphoryl/hydroxyl groups.25 Another less prominent local minimum was observed at pH 5.5 and 5.0 for, respectively, EHC and RHC (Fig. 1b) corresponding to carboxyl groups.18,25 It is important to note that due to the very small change in the pH values at the start and end of the titrations, functional groups with pKa at those extreme points are not identified.24

The modeling of the acid–base titration data identified phosphodiester groups whose pKa were 3.1 and 3.3 for EHC and RHC, respectively (Fig. 1c). The washing of RHC by KOH increased the concentration of phosphoryl/hydroxyl groups from 0.58 mol kg−1 in RHC to 0.98 mol kg−1 in EHC (Fig. 1c). Similarly, the concentration of carboxyl groups also increased from 0.24 mol kg−1 in RHC to 1.20 mol kg−1 in EHC (Fig. 1c). The KOH washing of RHC also lead to a 2.5 times more negative surface charge density on EHC compared to RHC at pH 9.0 (Fig. 1d). With the decrease of pH, the surface charge density on EHC and RHC became less negative and became equal at pH 4.8. With further decrease in pH, the surface charge density of EHC and RHC approached zero.

3.2 Orthophosphate adsorption

3.2.1 Orthophosphate adsorption isotherm. The adsorption of orthophosphate by EHC increased with increasing in initial orthophosphate concentration (Fig. 2a). At the initial orthophosphate concentration of 75.0 mg L−1, the Qe-PO43− was 4.9 mg of orthophosphate adsorbed per g of EHC. The Qe-PO43− further increased to 14.3 mg of orthophosphate adsorbed per g of EHC when the initial orthophosphate concentration was increased to 150.0 mg L−1. The equilibrium pH was 8.2, while the initial pH at all orthophosphate concentrations tested was 7.0.
image file: c6ra22327c-f2.tif
Fig. 2 Adsorption isotherm of (a) orthophosphate and (d) copper on EHC (image file: c6ra22327c-u9.tif) and RHC (image file: c6ra22327c-u10.tif) and time dependent adsorption of (b) orthophosphate and (e) copper on EHC (image file: c6ra22327c-u11.tif) and RHC (image file: c6ra22327c-u12.tif). Effect of initial (image file: c6ra22327c-u13.tif) and equilibrium (image file: c6ra22327c-u14.tif) pH on the adsorption of (c) orthophosphate and (f) copper on EHC as well as RHC (initial pH image file: c6ra22327c-u15.tif and equilibrium pH image file: c6ra22327c-u16.tif).

RHC did not adsorb any orthophosphate at the initial orthophosphate concentration of 25.0 mg L−1 (Fig. 2a). The Qe-PO43− increased to 2.5 mg of orthophosphate adsorbed per g of RHC when the initial orthophosphate concentration was 75.0 mg L−1. When the initial orthophosphate concentration was further increased to 150.0 mg L−1, the Qe-PO43− did not increase any further. The equilibrium pH was 7.2 while the initial pH at all orthophosphate concentrations tested was 7.0. It is interesting to note that the orthophosphate adsorption reaches a plateau in case of RHC, but such a plateau was not achieved when orthophosphate was adsorbed onto EHC.

3.2.2 Time dependency studies. The uptake of orthophosphate by EHC increased to 1.1 mg orthophosphate per g EHC in the first 10 minutes (Fig. 2b). The Qe-PO43− dropped to 0.7 mg orthophosphate per g EHC at 20 minutes and then increased to 1.6 mg orthophosphate per g EHC at 120 minutes. At 480 minutes, the Qe-PO43− was 2.5 mg orthophosphate per g EHC and increased to 2.9 mg orthophosphate per g EHC after 24 h (1440 minutes). The final pH was 8.1 at the end when the equilibrium was reached. In contrast, the RHC did not show any adsorption at initial orthophosphate concentrations of 10.0 mg L−1 and pH 7.0 (data not shown).
3.2.3 Effect of pH on adsorption of orthophosphate. The increase in initial pH from 3.0 to 4.0 led to an increase in Qe-PO43− from 2.4 to 3.4 mg of orthophosphate adsorbed per g of EHC (Fig. 2c). A further increase in the pH to 8.0 did not lead to any increase in Qe-PO43−. The equilibrium pH varied from 6.9 to 8.3 when the initial orthophosphate solution pH was varied from 3.0 to 8.0. RHC did not adsorb any orthophosphate at the pH values tested (data not shown).

3.3 Adsorption of copper

3.3.1 Copper adsorption isotherm. The Qe-Cu for EHC and RHC increased with increasing initial copper concentration (Fig. 2d). When the initial copper concentration was between 5.0 and 25.0 mg L−1, there was no significant difference in the Qe-Cu values of EHC and HC. When the initial copper concentration was further increased, a sharp increase in the Qe-Cu of EHC when compared to the Qe-Cu of RHC was observed (Fig. 2d). At the highest initial copper concentration tested (200.0 mg L−1), the Qe-Cu was 38.5 and 18.6 mg of copper adsorbed per g of adsorbent for, respectively, EHC and RHC.
3.3.2 Time dependency studies. The adsorption of copper onto EHC and RHC was relatively fast in the first 60 minutes. The Qe-Cu of 12.1 and 7.5 mg of copper adsorbed per g of adsorbent for, respectively, EHC and RHC was achieved after 60 minutes contact time (Fig. 2e). The uptake rate decreased and Qe-Cu values of 31.2 and 14.2 mg of copper adsorbed per g of adsorbent were achieved for, respectively, EHC and RHC after 960 minutes of incubation.
3.3.3 Effect of pH on copper adsorption. The increase in initial pH from 3.0 to 6.0 lead to a slight increase in the Qe-Cu value from 26.8 to 28.7 mg of copper adsorbed per g of EHC (Fig. 2f). The equilibrium pH varied from 5.0 to 6.5. The Qe-Cu values for RHC increased substantially from 3.9 to 18.8 mg of Cu adsorbed per g of RHC when the initial copper pH was increased from 3.0 to 6.0 (Fig. 2f). The equilibrium pH for RHC varied from 4.2 to 4.9 when the initial pH of the copper solution was increased from 3.0 to 6.0.

3.4 FTIR analysis of PO43−/Cu loaded EHC and EHC

The infrared spectroscopy of RHC revealed the presence of various functional groups (Fig. 3). The broad feature between 3200 and 3400 cm−1 can be attributed to OH stretching vibrations in the hydroxyl and carboxyl groups.26 The features at 2923 and 2852 cm−1 are due to aliphatic C–H stretching modes.27 The feature at 1583 cm−1 is attributed to asymmetric stretching of C[double bond, length as m-dash]O groups.27,28 The feature at 1452 cm−1 is due to C[double bond, length as m-dash]C stretching in the aromatic carbon rings and consequently, the feature between 796 to 777 cm−1 is attributed to aromatic C–H bonds.26,27 The feature at 1006 cm−1 is due to C–O–C stretching.28
image file: c6ra22327c-f3.tif
Fig. 3 IR spectra of EHC (i), RHC (ii), RHC + copper (iii), EHC + orthophosphate (iv) and EHC + copper (v). Note that the infrared spectra of RHC loaded orthophosphate is not presented, as RHC did not adsorb any orthophosphate at the concentrations tested.

The EHC sample showed similar FTIR spectra with subtle differences. There is a small shoulder visible at 1639 cm−1 and a shift in the feature at 1583 cm−1 in RHC to 1566 cm−1 in EHC. Furthermore, a less intense vibration of C–O–C was observed at the wavenumbers from 1100 to 1000 cm−1. This is probably due to OH deprotonation at the EHC surface.

The loading of copper onto the RHC changed the feature at 1583 cm−1 to 1591 cm−1, suggesting the interaction of copper with carboxyl groups (Fig. 3). The shape of the feature between 1400 and 1600 cm−1 in EHC was different in EHC loaded with copper, suggesting the further interaction of carboxyl groups. The EHC loaded with orthophosphate shows the different shape of the features between 1550 and 1650 cm−1.


image file: c6ra22327c-f4.tif
Fig. 4 ζ-Potential versus pH graph for (a) EHC and (b) RHC: EHC (image file: c6ra22327c-u17.tif), EHC + orthophosphate (image file: c6ra22327c-u18.tif), EHC + copper (image file: c6ra22327c-u19.tif), RHC (image file: c6ra22327c-u20.tif) and RHC + copper (image file: c6ra22327c-u21.tif). Note that the ζ-potential versus pH profile of RHC loaded orthophosphate is not included, as RHC did not adsorb any orthophosphate at the concentrations tested.

3.5 ζ-Potential variation after adsorption

The ζ-potential versus pH graph of the EHC and RHC suggests that both adsorbents have a similar negative ζ-potential value at pH values greater than 4.0 (Fig. 4a and b). The iso-electric point of EHC and RHC was at pH 3.0 and 3.5, respectively (Fig. 4a and b). Exposure of EHC and RHC to 100 mg L−1 of copper leads to a change in ζ-potential value from −30 mV to −10 mV at pH of 5.8. The loading of copper led to an increase in the iso-electric point of EHC and HC, respectively, to 3.8 (from 3.0) and 4.0 (from 3.5) (Fig. 4a and b). The loading of orthophosphate onto EHC did not alter the ζ-potential versus pH profile (Fig. 4a).

3.6 Orthophosphate removal from wetland effluent

The applicability of the EHC for phosphorus removal was demonstrated using the effluent of a constructed wetland. The effluent from the constructed wetland had a pH of 6.9 and the following composition (mg L−1): chemical oxygen demand 228, total suspended solids 35.2, dissolved oxygen 0.91 and total nitrogen 16.9. The orthophosphate concentration in the effluent was 13.1 mg L−1 and the total phosphorus concentration 18.0 mg L−1. At 6 g L−1 dosage of EHC, more than 97% removal of the orthophosphate and final orthophosphate concentration of 0.27 mg L−1 was achieved (Fig. 5).
image file: c6ra22327c-f5.tif
Fig. 5 Orthophosphate removal from the effluent of a constructed wetland at pH 6.9 (PO43− = 13.1 mg L−1) with increasing dosage of EHC.

4. Discussion

4.1 Orthophosphate adsorption onto EHC

This is the first study that demonstrates the adsorption of orthophosphate as a model anion onto EHC produced after the KOH pre-treatment of RHC derived from the sewage sludge (Fig. 2a–c). The maximum Qe-PO43− adsorbed in this study was 14.3 mg orthophosphate per g EHC. When compared to other adsorbents, the Qe-PO43− is on the lower side (Table 1), but the EHC has the advantage that it can be produced from abundantly present waste materials such as lignocellulose waste13,29 like rice straw,7 faecal sludge or manure30 as well as digested sewage sludge.9 Hydrothermal carbonized conversion of sewage sludge to hydrochar can have a positive impact on sewage sludge management, which is produced in huge amounts: estimated at an annual production of 28 million tonnes of sewage sludge by countries such as China, Russia, Brazil, Turkey and Mexico.31 As the hydrochar is produced from the sewage sludge, economic benefits can be achieved by manufacturing a product, also referred to be a sewchar, which can replace more costly commercial adsorbents such as activated charcoal. This would decrease the cost of wastewater treatment32 and contribute to the recycling of organic matter and nutrients in a circular economy.
Table 1 Orthophosphate adsorption capacity of various materials and engineered adsorbents
Adsorbent Qe (mg g−1) pH Equilibrium concentration (mg L−1) Reference
i = initial
eq. = equilibrium
Hydrochar RHC 2.3 i = 7.0; eq. = 7.2 150 This study
KOH activated hydrochar EHC 14.2 i = 7.0; eq. = 8.2 150 This study
Lanthanum doped hydrochar 189.2 i = 4.5; eq. = 6.0 4559 16
Hydrochar from Mg-enriched tomato tissue 100.0 i = 5.2; eq. = 7.9 130 33
Banana stem containing dimethylaminohydroxypropyl 72.5 i = 5.0; eq. = 5.0 160 34
Iron(III)-coordinated amino-functionalised poly(glycidylmethacrylate)-grafted cellulose 62.6 i = 6.0 300 35
Silica sulfate 51.6 eq. = 7.5 200 36
Zr-MCM 41 2.8 eq. = 6.5 200 36
Zr-ferrite 27.3 eq. = 7.0 200 36
Uncalcined hydrotalcite 60.0 i = 9.0; eq. = 9.5 160 37
Goethite 144.0 i = 5.0; eq. = 6.7 200 37
Granular date stone 26.7 i = 7.5; eq. = 7.5 20 38
Palm surface fibers 26.1 i = 7.5; eq. = 7.5 23 38


The adsorption of orthophosphate onto the EHC led to an increase in the equilibrium pH (Fig. 2c). The increase in the equilibrium pH can be due to the replacement of hydroxyl groups by the orthophosphate groups. The released hydroxyl groups increase the solution pH. This phenomenon was also observed when amorphous ZrO2 nanoparticles adsorbed orthophosphate and the hydroxyl ion concentration on the surface of the amorphous ZrO2 nanoparticles decreased.39 This observation is further confirmed by the relatively low pH increase during the adsorption of orthophosphate by RHC (Fig. 2c). Indeed, the FTIR showed a slight vibration shift in the EHC as compared to RHC at the bands of 1446–1400 cm−1, derived from –OH deprotonation at the sample surface. The acid–base titration also revealed the presence of larger numbers of hydroxyl groups on the EHC (Fig. 1c).

The ζ-potential versus pH plot shows that the adsorption of orthophosphate did not affect the ζ-potential of the orthophosphate loaded EHC (Fig. 4a). Also, the iso-electric point of the orthophosphate loaded EHC was similar to EHC without orthophosphate exposure. This suggests that the orthophosphate might be forming outer-sphere complexes with the EHC, however, further experiments such as determining the ionic dependence of the orthophosphate adsorption using X-ray absorption spectroscopy are required to identify the orthophosphate adsorption mechanisms onto EHC at molecular level.

4.2 Effect of KOH washing of hydrochar on orthophosphate adsorption

The KOH pre-treatment of the RHC not only lead to the formation of more hydroxyl groups (Fig. 1c) enhancing orthophosphate adsorption, but also to the dissolution of tar-like (alkali-soluble) substances.17 This dissolution of tar-like substances brings more cations such as Ca and Fe embedded in the skeletal part of RHC to interact with orthophosphate. The increased presence of Ca and Fe on the surface might lead to precipitation of the sorbed orthophosphate which might be the reason that the plateau was not reached in the adsorption isotherm of orthophosphate onto EHC (Fig. 2a). A Visual MINTEQ calculation at 25 mg L−1 orthophosphate and 5 mg L−1 Ca2+ at equilibrium pH 8.2 shows that orthophosphate will precipitate as amorphous calcium orthophosphate and hydroxyapatite. Replacing the Ca2+ with Fe2+ at similar conditions resulted in the precipitation of iron orthophosphate as vivianite. Similarly, orthophosphate adsorption onto the hydrochar derived from Mg-enriched tomato tissue resulted in the formation of MgHPO4 and Mg(H2PO4)2 precipitates.33 The achievement of the isotherm plateau (Fig. 2a) for adsorption of orthophosphate onto RHC suggests less interactions of orthophosphate with Ca and Fe. This further suggests that the higher orthophosphate adsorption capacity of EHC is due to the presence of higher amounts of cations on the EHC surface, leading to more interactions of Ca and Fe with orthophosphate.

The Qe-PO43− value of the EHC observed in this study is not yet the maximum: the plateau in the plot of Qe-PO43− versus initial orthophosphate concentration was not achieved (Fig. 2a). A further increase in the orthophosphate concentration would most likely lead to higher Qe-PO43− values. The isotherm data fitted poorly both the Langmuir (R2 = 0.29, data not shown) and Freundlich (R2 = 0.75, data not shown) models, thus, the maximum adsorption capacity cannot be estimated using these models. Since orthophosphate precipitation is predicted, the theoretical maximum adsorption capacity of EHC will be higher than the one obtained in this study and will depend on the Ca and Fe concentration on the skeleton of the EHC.

4.3 Adsorption of copper onto EHC

The adsorption of copper onto EHC was almost twice higher than that of RHC, i.e. 35.8 versus 18.7 mg Cu adsorbed per g adsorbent (Fig. 2d). The higher adsorption capacity of EHC can be due to the more negative surface charge density (Fig. 1d) and the more abundant carboxyl groups (Fig. 1c) on EHC compared to RHC.

Copper adsorption onto both hydrochars (RHC and EHC) is through electrostatic interactions, as confirmed by the less negative ζ-potential of copper loaded RHC and EHC (Fig. 4) as well as negative surface charge density of EHC and RHC (Fig. 1d). The increase in iso-electric point of EHC and RHC to, respectively, 3.8 and 4.0 mV upon copper exposure suggests the formation of an inner-sphere complex of copper within both hydrochars. A similar increase in the iso-electric point for both EHC and RHC further confirms that the KOH activation did not change the interaction mechanism of copper with the waste sewage sludge derived hydrochars.

The adsorption of copper onto RHC and EHC led to an increase in the equilibrium pH (Fig. 2f). The increase in equilibrium pH was larger for adsorption of copper onto EHC when compared to RHC. This pH increase leads to a higher negative ζ-potential value of the hydrochars, thus increasing the electrostatic attraction. The higher pH values also decrease the competition between Cu2+ and H+ ions. The decrease in H+ concentration or increase in pH can be due to the adsorption of H+ ions onto the hydrochar surface.

4.4 Environmental impact and applications

The EHC could remove more than 97% of the 13.1 mg L−1 orthophosphate from the effluent of a constructed wetland (Fig. 5). EHC can thus be used as a material in the post treatment of constructed wetlands, e.g. in a filter as suggested in Zapater-Pereyra et al. (2014).40 The use of an EHC filter along with a constructed wetland can be an affordable low tech solution for treating domestic wastewater, as all raw materials for this technology can be sourced locally. After the exhaustion of the adsorption capacity of the EHC, the orthophosphate loaded EHC can be used directly as a orthophosphate fortified fertilizer, because hydrochars can be used as soil conditioner and for soil stabilization.2 Indeed, the phosphate adsorbed on the hydrochar derived from Mg enhanced tomato tissue has been shown to be bioavailable and acted as a slow release phosphate fertilizer.33 Thus, due to the multipurpose applications of EHC for wastewater treatment along with benefits for sludge management make them attractive adsorbents that contribute to the transition of the end of pipe to resource recovery based wastewater treatment.

5. Conclusions

The objective of this study was to test a low cost adsorbent, derived from the waste activated sludge, for the removal of orthophosphate from the effluents. This study successfully achieved its objectives by demonstrating the adsorption capacity of KOH activated hydrochar derived from sewage sludge towards orthophosphate. The adsorption of the orthophosphate anion by EHC is due to replacement of hydroxyl ions and surface precipitation. This study also demonstrated that EHC can achieve more than 97% orthophosphate removal from the effluent of a constructed wetland treating municipal wastewater. Though, the adsorption capacity of the EHC is on a lower side when compared to other adsorbent, the importance of EHC lays in its derivation from the excess sewage sludge, thus opening perspectives to improve sewage sludge management. The EHC also demonstrated an increased adsorption capacity towards Cu when compared to RHC. The applicability of hydrochar derived from sewage sludge for orthophosphate removal and subsequent application of hydrochar as soil conditioner helps in recycling organic carbon and closing the nutrient cycles.

Acknowledgements

This research was supported by a scholarship of the Erasmus Mundus Master Class International Master of Environmental Technology and Engineering (IMETE). The authors are thankful to Frank Wiegman and Peter Heerings (UNESCO-IHE Delft, The Netherlands) for technical assistance in the laboratory.

References

  1. A. Funke and F. Ziegler, Biofuels, Bioprod. Biorefin., 2012, 6, 246–256 CrossRef.
  2. J. A. Libra, K. S. Ro, C. Kammann, A. Funke, N. D. Berge, Y. Neubauer, M.-M. Titirici, C. Fühner, O. Bens, J. Kern and K.-H. Emmerich, Biofuels, 2011, 2, 71–106 CrossRef CAS.
  3. A. S. Mestre, E. Tyszko, M. A. Andrade, M. Galhetas, C. Freire and A. P. Carvalho, RSC Adv., 2015, 5, 19696–19707 RSC.
  4. Y. Liu, X. Zhu, F. Qian, S. Zhang and J. Chen, RSC Adv., 2014, 4, 63620–63626 RSC.
  5. T. Chen, Z. Zhou, R. Han, R. Meng, H. Wang and W. Lu, Chemosphere, 2015, 134, 286–293 CrossRef CAS PubMed.
  6. J. M. V. Minani, J. W. Foppen and P. N. L. Lens, Water Sci. Technol., 2014, 69, 2504–2509 CrossRef CAS PubMed.
  7. D. Ding, X. Ma, W. Shi, Z. Lei and Z. Zhang, RSC Adv., 2016, 6, 74675–74682 RSC.
  8. Y. Chen, J. Chen, S. Chen, K. Tian and H. Jiang, J. Mater. Chem. A, 2015, 3, 9843–9850 CAS.
  9. J. W. Chung, J. W. Foppen, G. Gerner, R. Krebs and P. N. L. Lens, J. Appl. Microbiol., 2015, 119, 876–884 CrossRef CAS PubMed.
  10. A. Upneja, G. Dou, C. Gopu, C. A. Johnson, A. Newman, A. Suleimenov and J. L. Goldfarb, RSC Adv., 2016, 6, 92813–92823 RSC.
  11. B. E. Rittmann, B. Mayer, P. Westerhoff and M. Edwards, Chemosphere, 2011, 84, 846–853 CrossRef CAS PubMed.
  12. M. Rathod, K. Mody and S. Basha, J. Cleaner Prod., 2014, 84, 484–493 CrossRef CAS.
  13. T. A. H. Nguyen, H. H. Ngo, W. S. Guo, J. Zhang, S. Liang, D. J. Lee, P. D. Nguyen and X. T. Bui, Bioresour. Technol., 2014, 169, 750–762 CrossRef CAS PubMed.
  14. X. Chen, G. Chen, L. Chen, Y. Chen, J. Lehmann, M. B. McBride and A. G. Hay, Bioresour. Technol., 2011, 102, 8877–8884 CrossRef CAS PubMed.
  15. J. W. Chung, J. W. Foppen, M. Izquierdo and P. N. L. Lens, J. Environ. Qual., 2014, 43, 2096 CrossRef PubMed.
  16. L. Dai, B. Wu, F. Tan, M. He, W. Wang, H. Qin, X. Tang, Q. Zhu, K. Pan and Q. Hu, Bioresour. Technol., 2014, 161, 327–332 CrossRef CAS PubMed.
  17. J. W. Chung, PhD thesis, UNESCO-IHE, 2016, ISBN-13: 978-1138029293.
  18. R. Jain, M. Seder-Colomina, N. Jordan, P. Dessi, J. Cosmidis, E. D. van Hullebusch, S. Weiss, F. Farges and P. N. L. Lens, J. Hazard. Mater., 2015, 295, 193–200 CrossRef CAS PubMed.
  19. B. F. Turner and J. B. Fein, Comput. Geosci., 2006, 32, 1344–1356 CrossRef CAS.
  20. M. Li, Q. Liu, Z. Lou, Y. Wang, Y. Zhang and G. Qian, ACS Sustainable Chem. Eng., 2014, 2, 2501–2509 CrossRef CAS.
  21. M. Zapater, A. Gross and M. I. M. Soares, Ecological Engineering, 2011, 37, 1572–1577 CrossRef.
  22. R. Jain, D. Dominic, N. Jordan, E. R. Rene, S. Weiss, E. D. van Hullebusch, R. Hübner and P. N. L. Lens, Chem. Eng. J., 2016, 284, 917–925 CrossRef CAS.
  23. C. Li, J. Ma, J. Shen and P. Wang, J. Hazard. Mater., 2009, 166, 891–896 CrossRef CAS PubMed.
  24. O. Braissant, A. W. Decho, C. Dupraz, C. Glunk, K. M. Przekop and P. T. Visscher, Geobiology, 2007, 5, 401–411 CrossRef CAS.
  25. H.-W. Luo, J.-J. Chen, G.-P. Sheng, J.-H. Su, S.-Q. Wei and H.-Q. Yu, Sci. Rep., 2014, 4, 1–6 Search PubMed.
  26. M. Sevilla and A. B. Fuertes, Chem.–Eur. J., 2009, 15, 4195–4203 CrossRef CAS PubMed.
  27. C. He, A. Giannis and J. Y. Wang, Appl. Energy, 2013, 111, 257–266 CrossRef CAS.
  28. Y. Gao, X. Wang, J. Wang, X. Li, J. Cheng, H. Yang and H. Chen, Energy, 2013, 58, 376–383 CrossRef CAS.
  29. F. Monlau, C. Sambusiti, E. Ficara, A. Aboulkas, A. Barakat and H. Carrère, Energy Environ. Sci., 2015, 2600–2621 CAS.
  30. J. W. Chung, M. Breulmann, A. Clemens, C. Fuhner, J. W. Fopper and P. N. L. Lens, J. Water Health, 2016, 4, 754–767 CrossRef PubMed.
  31. G. Mininni and S. Dentel, http://megaslides.com/doc/884344/state-of-sewage-sludge-management-and-legislation-on, accessed October, 2016.
  32. M. Inyang and E. Dickenson, Chemosphere, 2015, 134, 232–240 CrossRef CAS PubMed.
  33. Y. Yao, B. Gao, J. Chen and L. Yang, Environ. Sci. Technol., 2013, 47, 8700–8708 CrossRef CAS PubMed.
  34. T. S. Anirudhan, B. F. Noeline and D. M. Manohar, Environ. Sci. Technol., 2006, 40, 2740–2745 CrossRef CAS PubMed.
  35. T. S. Anirudhan and P. Senan, Chem. Ecol., 2011, 27, 147–164 CrossRef CAS.
  36. W. Jutidamrongphan, K. Y. Park, S. Dockko, J. W. Choi and S. H. Lee, Environ. Chem. Lett., 2012, 10, 21–28 CrossRef CAS.
  37. E. N. Peleka and E. A. Deliyanni, Desalination, 2009, 245, 357–371 CrossRef CAS.
  38. Z. Z. Ismail, Int. J. Environ. Stud., 2012, 69, 135–149 CrossRef CAS.
  39. Y. Su, H. Cui, Q. Li, S. Gao and J. K. Shang, Water Res., 2013, 47, 5018–5026 CrossRef CAS PubMed.
  40. M. Zapater-Pereyra, E. Malloci, J. J. A. Van Bruggen and P. N. L. Lens, Ecological Engineering, 2014, 73, 635–642 CrossRef.

This journal is © The Royal Society of Chemistry 2016