Confined synthesis of three-dimensionally ordered arrays of multilamellar silica nanoparticles as a gold catalyst support

Shujun Zhou, Xinlei Yao and Tongxiang Fan*
State Key Laboratory of Metal Matrix Composite Materials, Shanghai Jiao Tong University, 800 Dongchuan Road, Min-hang District, Shanghai, China 200240. E-mail: txfan@sjtu.edu.cn

Received 31st August 2016 , Accepted 20th October 2016

First published on 21st October 2016


Abstract

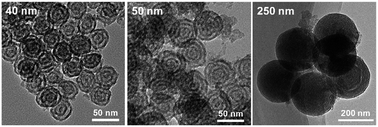
Three-dimensionally ordered arrays of multilamellar silica nanoparticles are prepared via confined synthesis inside ordered porous carbon, the pore size of which is varied to obtain multilamellar silica nanoparticles of about 40 nm, 50 nm, and 250 nm in size. The multilamellar silica nanoparticles have mesopores of sizes within 6.8–7.8 nm according to isothermal nitrogen adsorption–desorption measurements, and they pack three-dimensionally to give an additional set of ordered interparticle pores. Such hierarchically structured silica is exploited as the support for Au nanoparticles, whose catalytic activity is evaluated through the reduction of 4-nitrophenol monitored with UV-Vis spectroscopy. It is found that the Au nanoparticles on the multilamellar silica nanoparticle arrays show higher catalytic activity than those on non-hierarchical silica supports including SBA-15 and solid silica nanoparticle arrays.


Introduction

Hierarchical silica is attractive for applications in catalysis,1 drug delivery,2 absorbance,3 functional coatings,4 and so on.5 Methods including microfluidic synthesis,6 spray pyrolysis,7 biphasic sol–gel synthesis,8 dual-template methods,9 etc. can be used to prepare hierarchical silica. The syntheses of inorganic materials aided by block copolymers confined in nanosized spaces lead to intriguing structures.10,11 Wu et al. reported unusual mesoporous silica structures synthesized inside alumina nanochannels.12 The silica morphology systematically changes with the diameter of the nanochannels due to particular interactions and effects under physical confinements.12,13 Others attempted to prepare silica structures in planar,14 tubular,15 spherical,16 and polyhedral confinements.17 Among them, the spherical confinement is popular thanks to the easy availability of three-dimensional (3D) porous carbon with uniform and size-tuneable pores. Theoretical studies on block copolymers in spherical confinements suggest the existence of rich polymer phases different from the bulk when the size of confinement decreases.18 Such phases can be replicated using inorganic precursors. Recently, Wang et al. reported mesoporous silica particles synthesized inside 3D porous carbon, where the composite rod-like micelles curved under spherical confinements to form a concentric structure simultaneously replicated with silica.19 They used 3D porous carbon having pore sizes of 400 nm and 500 nm, which lie in the frequently-studied pore size range (from ca. 100 nm to several μm),9 however pores of much smaller sizes are seldom reported.

Considering that decreasing the size of spherical confinements may induce new polymer phases and enable interesting inorganic morphologies, it is worth exploring the silica morphology synthesized in tiny spherical pores. Here we report the preparation of ordered arrays of multilamellar silica nanoparticles (MLSs) via confined synthesis in 3D porous carbon having sub-100 nm pores. A triblock copolymer P123 was used as the structure directing agent. The obtained MLSs contain interior multilamellar structures with average pore sizes of 6.8–7.8 nm, and they further pack into 3D arrays to give an additional set of interparticle pores. Taking advantage of the hierarchical structure, we used the MLS array as a support for Au nanoparticle catalyst. The catalytic performances of Au nanoparticles loaded on the MLS arrays are evaluated through the reduction reactions of 4-nitrophenol.

Experimental

Materials

Tetraethyl orthosilane (TEOS), ethanol, furfuryl alcohol, oxalic acid tetrahydrate, trisodium citrate dihydrate, potassium hydroxide, and hydrochloric acid (37 wt%) were purchased from Sinopharm group Co. Ltd. (3-Aminopropyl)trimethoxysilane (APS) was purchased from Aladdin Industrial Corporation. Poly(ethylene oxide-block-propylene oxide-block-ethylene oxide) (P123, Mw 5800) and chloroauric acid were purchased from Sigma-Aldrich Corporation. Deionized water was used as solvent in all the experiments.

Synthesis of three-dimensional arrays of multilamellar silica nanoparticles (MLSs)

The protocol for synthesizing 3D arrays of MLSs is described in Scheme 1. First, colloidal silica nanoparticles with a mean size of 60 nm and 80 nm were prepared with previous methods.20,21 Those with a size of ca. 270 nm were prepared with the Stöber method,22 washed and then re-dispersed in water. Suspensions of the above silica nanoparticles were put in glass beakers and left statically at 60 °C for one week, during which the solvent evaporated to induce the silica nanoparticles to assemble into particle arrays. The dried silica particle arrays were further calcined at 550 °C for 6 h to sinter the silica nanoparticles.
image file: c6ra21785k-s1.tif
Scheme 1 Synthetic procedures of the multilamellar silica nanoparticles.

Second, 3D porous carbon was prepared by impregnating the silica particle arrays in a carbon precursor made by dissolving oxalic acid (0.126 g) in furfuryl alcohol (19.2 g).23 The silica particle arrays soaked with carbon precursor were dried at 90 °C for 12 h, and then heated in vacuum at 200 °C and 900 °C each for 3 h to pyrolyze the carbon precursor. The silica particle arrays were removed through chemical etching in potassium hydroxide solution (6 M) with hydrothermal treatment (180 °C, 3 days). The resulted solid was washed thoroughly with ethanol and water, and then dried at 60 °C to give the 3D porous carbon.

Third, 3D arrays of MLSs were synthesized using the porous carbon as template. The silica precursor was prepared by dissolving P123 (1 g) in a solution containing ethanol (14 g), water (0.9 g) and hydrochloric acid solution (2 M, 0.06 g), followed by the addition of TEOS (2.08 g).19 The precursor was ready for use after 1 h of magnetic stirring at room temperature. The 3D porous carbon was impregnated with excess precursor at 30 °C in an open container for 48 h, during which the solvent evaporated and the precursor filled the pores of carbon template. The precursor-filled carbon (1 g) along with hydrochloric acid solution (1 M, 15 ml) were put in a Teflon container (50 ml) sealed in an autoclave, and hydrothermally treated at 100 °C for 15 h. The resulted solid was washed with water, dried at 60 °C and calcined at 550 °C for 10 h to remove carbon, finally yielding the MLSs. For comparison, mesoporous silica SBA-15 was prepared using the same silica precursor in the absence of carbon template.24

Synthesis of Au-loaded MLSs

Before Au loading, the MLSs were chemically modified with APS as follows. The dry powder of MLSs (0.1 g) was added to APS aqueous solution (0.02 wt%, 16.62 g), and the mixture was magnetically stirred for 2 h in a water bath at 75 °C. The powder was washed three times with ethanol and dried at 60 °C, giving the APS-modified MLSs. For Au loading, powder of the APS-modified MLSs (0.1 g) was added to chloroauric acid aqueous solution (0.5 mM) in a clean glass vial, followed by magnetic stirring at room temperature for 2 h. The powder turned from white to yellow, indicating the absorption of gold species onto the MLSs. The mixture solution was heated to 90 °C and then trisodium citrate aqueous solution (40 mM, 2.4 ml) was added under vigorous stirring. The powder tuned light pink after 1 h of stirring; it was then centrifuged, washed three times with water, and dried at 180 °C to give the Au-loaded MLSs, which were red powder.

Catalytic reduction of 4-nitrophenol (4NP)

Au nanoparticles can catalyse the conversion of 4NP into 4-aminophenol, for which NaBH4 is the reductive agent.1,25 The catalytic reduction of 4NP was conducted as follows. The NaBH4 solution (1 ml, 50 mM) was added to the 4NP solution (0.1 ml, 0.125 mM) in a quartz cuvette, giving a bright yellow mixture solution. Noted that it is difficult for 4NP and NaBH4 to react in the absence of catalyst. Then an aqueous dispersion of Au-loaded MLSs (1 ml, 0.5 mg ml−1) was added to the above mixture, whose colour gradually faded to a faint yellow after about 20 minutes. The time-course UV-Vis spectra were measured to monitor the above reaction process, since 4NP has characteristic UV-Vis absorbance whose strength reflects its concentration in solution. Measurements were started after the addition of Au-loaded catalysts into the 4NP–NaBH4 mixture, with had an initial 4NP concentration of 6 × 10⁻⁶ M and a catalyst dose of 0.24 g L−1. The time-course UV-Vis spectra were continuously taken through starting a measurement as soon as the last measurement was complete. The time interval of measurements was determined by referring to the time records of the measurement log sheet. The average time intervals of measuring Au-loaded MLS-1, MLS-2, MLS-3, and SBA-15 during the catalysis tests are 86 s, 99 s, 88 s, and 99 s, respectively.

Characterization

Scanning electron microscope (SEM) images were taken with a NOVA Nano SEM230 field-emission scanning electron microscope. The samples in powder form were fixed with carbon tape onto the sample holder, and then sputtered with Au in Ar atmosphere prior to SEM observations. Transmittance electron microscope (TEM) analysis was conducted on a JEOL JEM-2100F transmittance electron microscope equipped with the INCA-IET200 EDX apparatus. The samples (colloid or aqueous dispersion of powder) were loaded onto the carbon film-coated Cu grid through drop casting. The isothermal nitrogen adsorption–desorption measurements were conducted at 77 K on a Micromeritics ASAP 2020 adsorption analyser. All samples were outgassed in vacuum at 200 °C for 5 hours prior to the measurements. The pore size distribution curves were derived from the adsorption isotherm with the Barrett–Joyner–Halenda (BJH) method; the surface areas were calculated with the Brunauer–Emmett–Teller (BET) equation. Small-angle X-ray diffraction measurements within 0.6–6° (2θ) were conducted on a Rigaku D/max-2200/PC X-ray diffractometer with Cu Kα irradiation (λ = 1.5406 Å), step size of 0.02° (2θ), and scan rate of 2° per min. X-ray diffraction (XRD) measurements within 10–80° (2θ) were conducted on a Rigaku Ultima IV X-ray diffractometer with Cu Kα irradiation (λ = 1.5406 Å), step size of 0.02° (2θ), and scan rate of 5° per min. Inductively coupled plasma mass spectrometry (ICP-MS) was measured with the Agilent 7500a equipment to determine the Au weight ratio in the Au-loaded catalysts. UV-Vis spectroscopy of liquid sample in a quartz cuvette was measured within 200–600 nm using a Perkin Elmer Lambda 750 spectrometer with deionized water as the reference.

Results and discussion

Ordered arrays of multilamellar silica nanoparticles (MLSs)

Uniform silica nanoparticles with mean sizes of 60 nm, 80 nm, and 270 nm were synthesized (Fig. 1a–c). They were used as templates to yield 3D porous carbon composed of uniform spherical pores with mean sizes of 50 nm, 80 nm, and 300 nm (Fig. 1d–f). The 3D porous carbon with varying pore sizes were employed as containers for the confined synthesis of MLSs, which are noted as MLS-1, MLS-2, and MLS-3, respectively, in the following discussion.
image file: c6ra21785k-f1.tif
Fig. 1 TEM images of silica spheres with a mean size of (a) 60 nm and (b) 80 nm. SEM images of (c) silica spheres ca. 270 nm in size and porous carbon with an average pore size of ca. (d) 50 nm, (e) 80 nm, and (f) 300 nm.

SEM images of the as-prepared MLSs show ordered arrays of particles (Fig. 2a–c). The particles have uniform sizes of ca. 40 nm (MLS-1), 50 nm (MLS-2), and 250 nm (MLS-3), which are smaller than the pore size of their parent carbon templates. The interstices between neighbouring particles indicates shrinkage due to sintering and template removal during calcination. TEM images reveal that the interior of the particles consists of several layers arranged in a concentric manner (Fig. 2d–f). The MLS-1 and MLS-2 contain 2 and 3 layers, respectively. Though the large size of MLS-3 makes it difficult to identify all the layers in the structure, the MLS-3 particles generally contains at least 15 distinguishable layers.


image file: c6ra21785k-f2.tif
Fig. 2 SEM images of arrays of MLSs: (a) MLS-1, (b) MLS-2, and (c) MLS-3. TEM images of (d) MLS-1, (e) MLS-2, and (f) MLS-3 with yellow curves indicating the layers of the MLSs.

Pore textures of the MLSs are analysed with isothermal nitrogen adsorption–desorption measurements. The MLSs all have IV-type isotherms, indicating of their mesoporous nature (Fig. 3a–c). Their isotherms are similar, despite of different particle sizes. The adsorption branch of the isotherms undergoes a steep raise at P/P0 = 0.7–0.8 and then a mild raise at P/P0 = 0.9–1.0. The hysteresis loop can be described as a combination of H1 type (at P/P0 = 0.7–0.8) and H3 type (at P/P0 = 0.9–1.0) loops.26 The H1 loop indicates the presence of uniform mesopores, which give sharp pore size distribution peaks (Fig. 3a–c, insets). The H3 loop can be attributed to the less ordered interparticle pores. The BET surface areas of MLS-1 (489 cm2 g−1), MLS-2 (502 cm2 g−1), and MLS-3 (453 cm2 g−1) are not obviously affected by the particle size. They are comparable to that of SBA-15 synthesized in the absence of carbon template (674 cm2 g−1, Fig. S1 (a and b)) and higher than that of the solid silica nanoparticles of a similar size (71.3 cm2 g−1, Fig. S1 (c and d)). A similar tendency is also observed with the total pore volume.


image file: c6ra21785k-f3.tif
Fig. 3 Nitrogen adsorption–desorption isotherms and pore size distribution (insets) of (a) MLS-1, (b) MLS-2, and (c) MLS-3. (d) Small-angle XRD spectra of the MLSs.

Structure of the MLSs is further examined with small-angle XRD measurements (Fig. 3d). Diffraction peaks at 2θ ≈ 1.2 degree are detected for all the MLSs, indicating regular structures. The structural periodicity is estimated with Bragg equation to be 7.1 nm, 7.4 nm, and 7.0 nm for MLS-1, MLS-2, and MLS-3, respectively, as is comparable to their uniform mesopore sizes (Fig. 3a–c, insets).

Multilamellar spherical structures are obtained through confined synthesis in 3D porous carbon. The current precursor contains rod-shape micelles that adopt hexagonal packing in the bulk,24 however physical confinements would impose high stress on the bulk packing order.12 In confinements of axial symmetry, the precursor favourably arranges into a set of concentric cylindrical shells to relieve the stress.12 Here the spherical pores of 3D porous carbon should generate isotropic stress that results in concentric shells with spherical symmetry. Decreasing the confinement size may cause strong confinement effects and induce new morphologies,13,18 but here essentially the same multilamellar morphology is obtained. We suppose that this morphology may be a favourable conformation for minimizing the stress with the current precursor, reaction conditions, and pore surface properties. Different morphologies are obtained by replacing P123 with other block copolymers as the structure directing agent in the precursor (Fig. S2), and their morphological evolvements with the confinement size are worth further investigations.

Catalytic reduction of 4NP with Au-loaded MLSs

The MLSs are employed as a support for Au catalyst, which was loaded through surface adsorption followed by in situ reduction. Fig. 4 shows the TEM images of the MLSs after loading Au. Nanoparticles of a darker contrast to the multilamellar structure can be observed and the EDX spectra confirm the presence of Au (Fig. S3). The Au content is determined with ICP-MS analysis to be 2.1 wt%, 2.5 wt%, and 1.7 wt% for Au–MLS-1, Au–MLS-2, and Au–MLS-3, respectively. XRD measurements detect diffraction peaks at 2θ ≈ 39°, 45°, 65°, and 78° (Fig. 4d), which can be indexed with the (111), (200), (220), and (311) crystal planes of Au (face-centered cubic, JCPDS 4-0783). Hence these nanoparticles should be the Au nanoparticles (Fig. 4a–c). Judging from TEM images, the mean sizes of Au nanoparticles on MLS-1, MLS-2, and MLS-3 are about 5.0 nm, 5.3 nm, and 5.7 nm, respectively.
image file: c6ra21785k-f4.tif
Fig. 4 TEM images of the Au-loaded MLSs: (a) Au–MLS-1, (b) Au–MLS-2, and (c) Au–MLS-3. (d) XRD spectra of the Au-loaded MLSs. The peak at 2θ ∼ 22.5° is attributed to amorphous silica.

Au-loaded SBA-15 (Au–SBA-15, Fig. S4) and SNPs (Au–S, Fig. S5) were also prepared through the same Au synthesis procedures for comparison. The Au content and mean particle size of Au–SBA-15 is 1.9 wt% and 5.3 nm, respectively, which are comparable to those of the Au–MLSs. The Au–S contains 1.8 wt% Au with a mean particle size of 12.5 nm. The Au nanoparticles on the MLSs and SBA-15 are smaller than those on the SNPs, because the MLSs and SBA-15 have mesopores below 10 nm to limit the Au particle growth.

The catalytic activity of Au loaded on MLSs is evaluated through the reduction of 4NP by NaBH4, which can be monitored with UV-Vis absorbance spectroscopy. The 4NP aqueous solution exhibits a characteristic UV-Vis absorbance peak at 320 nm, while adding NaBH4 into 4NP solution shifts the peak to 400 nm, indicating the formation of 4-nitrophenolate ions (Fig. S6).1 The absorbance at 400 nm gradually decreases after the addition of Au-loaded MLSs into the 4NP–NaBH4 mixture, while a new peak at 300 nm appears, indicating the emergence of 4-aminophenol which is the product of 4NP reduction (Fig. 5a–c). The absorbance at 400 nm becomes almost unchanged after about 15 minutes, indicating the ending of the reaction. Au–SBA-15 leads to a similar spectral change of the 4NP–NaBH4 mixture as the Au–MLSs (Fig. 5d). In contrast, the absorbance at 400 nm remains almost unchanged and no peak of 4-aminophenol at 300 nm emerges after adding Au–S into the 4NP–NaBH4 mixture (Fig. S7), indicating that 4NP is not reduced. The above results show that Au loaded on the MLSs and SBA-15 are catalytically active, while those on the SNPs are not. The poor catalytic activity of Au on SNPs can be attributed to their large particle size.27


image file: c6ra21785k-f5.tif
Fig. 5 UV-Vis absorbance spectra of the 4NP–NaBH4 mixture solution detected at different time after the addition of Au-loaded silica: (a) Au–MLS-1, (b) Au–MLS-2, (c) Au–MLS-3, and (d) Au–SBA-15. (e) A graph showing the decrease of the absorbance at 400 nm with time. (f) The relationship between (1/At − 1/A0) and time (t), wherein At and A0 are the absorbance at 400 nm at time t and t = 0, respectively. The straight lines are fitting curves using the second-order kinetic model with correlation coefficient R2.

The catalytic performances of Au nanoparticles on MLSs and SBA-15 are further examined with the decrease of absorbance at 400 nm with time as shown in Fig. 5e. Since the absorbance intensity relates to the concentration of 4NP in solution, the conversion of 4NP can be evaluated with the relative intensity of absorbance at 400 nm before and after reaction (ESI, Formula).1 The Au–MLS-1, Au–MLS-2, and Au–MLS-3 convert 82%, 78%, and 79%, respectively, whereas Au–SBA-15 converts 66% of the 4NP within 20 minutes. The second-order kinetic model is found to best describe the relationship between the absorbance at 400 nm and reaction time. The relationship between 1/At − 1/A0 and reaction time can be fitted with linear lines (Fig. 5f), from the slope of which the reaction rate constants are determined to be 0.23, 0.16, 0.21, and 0.08 M−1 min−1 for Au–MLS-1, Au–MLS-2, Au–MLS-3, and Au–SBA-15, respectively. The results suggest that the Au–MLSs generally have higher catalytic efficiencies than Au–SBA-15, considering that their Au content and particle size are comparable. The turnover frequency (TOF) of Au–MLS-1, Au–MLS-2, Au–MLS-3, and Au–SBA-15 within the first 2 minutes of reactions is calculated to be 2.3 × 10⁻⁴, 1.2 × 10⁻⁴, 3.7 × 10⁻⁴, and 1.4 × 10⁻⁴ s−1, respectively, with the initial 4NP concentration of 6 × 10⁻⁶ M and Au-loaded catalyst dose of 0.24 g L−1. Au–MLS-2 has the lowest TOF due to its relatively high Au content that decreases the specific activity of Au.28 Although the Au–MLS-1, Au–MLS-3, and Au–SBA-15 have similar Au contents, Au–MLS-1 and Au–MLS-3 both have higher TOFs than Au–SBA-15, indicating higher catalytic activity of Au nanoparticles on MLS-1 and MLS-3 compared with those on SBA-15.

The above results show that Au nanoparticles supported on the MLSs have better catalytic performances than those on SBA-15. The catalytic reactions involve (1) adsorption of reactant to the surface of catalyst, (2) diffusion of reactant to the Au nanoparticles, (3) reaction of the reactant into product, and (4) desorption of the product.29 The catalytic activity of Au is largely affected by the Au loading amount, particle size, synthesis methods, and support materials.30 Here the Au–MLSs and Au–SBA-15 are prepared with the same method to achieve similar Au loading amounts and particle sizes. The MLSs and SBA-15 are both silica that is an inert support for Au, but their pore structures should have different effects on the diffusion process of reactant and product,31 which is a significant factor affecting the catalytic performances. The long slender mesopores of SBA-15 make it difficult for organic molecules to effectively diffuse through the pores, hence excluding some amount of the internal surface.32 In contrast, the MLSs adopt a spherical shape to reduce the mesopore length and enable shorter diffusion pathways. They further arrange into particle arrays with three-dimensional interparticle pores, which provide channels for fast transferring the reactants to the mesopores where Au locates, hence raising the accessibility of Au to reactants.33 The channels can also facilitate the delivery of products away from the Au sites to refresh the catalysts.34 These may explain the enhanced catalytic performances of Au supported on MLSs.

Conclusions

Three-dimensionally ordered arrays of MLSs are prepared through confined synthesis of mesoporous silica within 3D ordered porous carbon. The MLS array has ordered interior mesopores with pore sizes of 6.8–7.8 nm and an addition set of interparticle pores, hence is a hierarchical structure. The multilamellar structure is stable despite different confinement sizes, suggesting that the structure may be a favourable conformation to achieve minimized confinement stress with the current experimental conditions. The MLS arrays are used as a support for Au nanoparticles, whose catalytic activity is evaluated with 4-nitrophenol reduction. As a catalyst support, the MLS arrays are found to enhance the catalytic performances of Au nanoparticles better than the non-hierarchical SBA-15 and solid silica nanoparticle arrays. The ordered mesopores of MLSs are beneficial for the dispersion of small Au nanoparticles, while the hierarchical structure can facilitate mass transfer and raise the accessibility of Au. The latter features, in particular, are also desirable for light-harvesting, sensing, absorbance, filtration and separation. The MLS arrays can further serve as hard templates for preparing hierarchical materials such as metal oxides, metal sulfides, organic–inorganic hybrids, and so on, to achieve a wide range of applications.

Acknowledgements

We are grateful for financial supports by the National Natural Science Foundation of China (No. 51402191), China Postdoctoral Funds for Scientific Research (No. 2014M561472), the National Science Fund for Distinguished Young Scholars (No. 51425103), Program of Shanghai Outstanding Academic Leaders (No. 15XD1501900), International Science & Technology Cooperation Program of China (No. 2015DFE52870).

References

  1. Q. Ji, J. P. Hill and K. Ariga, J. Mater. Chem. A, 2013, 1, 3600–3606 CAS.
  2. W. Zhao, M. Lang, Y. Li, L. Li and J. Shi, J. Mater. Chem., 2009, 19, 2778–2783 RSC.
  3. L. Zhang, N. Zhan, Q. Jin, H. Liu and J. Hu, Ind. Eng. Chem. Res., 2016, 55, 5885–5891 CrossRef CAS.
  4. X. Du and J. He, Chem.–Eur. J., 2011, 17, 8165–8174 CrossRef CAS PubMed.
  5. X. Du and J. He, Nanoscale, 2011, 3, 3984–4002 RSC.
  6. C.-X. Zhao and A. P. J. Middelberg, RSC Adv., 2013, 3, 21227–21230 RSC.
  7. F. Iskandar, Mikrajuddin and K. Okuyama, Nano Lett., 2001, 1, 231–234 CrossRef CAS.
  8. D. Shen, J. Yang, X. Li, L. Zhou, R. Zhang, W. Li, L. Chen, R. Wang, F. Zhang and D. Zhao, Nano Lett., 2014, 14, 923–932 CrossRef CAS PubMed.
  9. N. D. Petkovich and A. Stein, Chem. Soc. Rev., 2013, 42, 3721–3739 RSC.
  10. M. Ramanathan, S. M. Kilbey, Q. Ji, J. P. Hill and K. Ariga, J. Mater. Chem., 2012, 22, 10389–10405 RSC.
  11. A. Stein, S. G. Rudisill and N. D. Petkovich, Chem. Mater., 2014, 26, 259–276 CrossRef CAS.
  12. Y. Wu, G. Cheng, K. Katsov, S. W. Sides, J. Wang, J. Tang, G. H. Fredrickson, M. Moskovits and G. D. Stucky, Nat. Mater., 2004, 3, 816–822 CrossRef CAS PubMed.
  13. B. Yu, P. Sun, T. Chen, Q. Jin, D. Ding, B. Li and A.-C. Shi, Phys. Rev. Lett., 2006, 96, 138306 CrossRef PubMed.
  14. V. R. Koganti and S. E. Rankin, J. Phys. Chem. B, 2005, 109, 3279–3283 CrossRef CAS PubMed.
  15. B. Platschek, A. Keilbach and T. Bein, Adv. Mater., 2011, 23, 2395–2412 CrossRef CAS PubMed.
  16. A. Stein, B. E. Wilson and S. G. Rudisill, Chem. Soc. Rev., 2013, 42, 2763–2803 RSC.
  17. F. Li, Z. Wang, N. S. Ergang, C. A. Fyfe and A. Stein, Langmuir, 2007, 23, 3996–4004 CrossRef CAS PubMed.
  18. X. Zhang, D. Cao and W. Wang, J. Phys. Chem. C, 2008, 112, 2943–2948 CAS.
  19. M. Wang, Z. Sun, Q. Yue, J. Yang, X. Wang, Y. Deng, C. Yu and D. Zhao, J. Am. Chem. Soc., 2014, 136, 1884–1892 CrossRef CAS PubMed.
  20. T. Yokoi, Y. Sakamoto, O. Terasaki, Y. Kubota, T. Okubo and T. Tatsumi, J. Am. Chem. Soc., 2006, 128, 13664–13665 CrossRef CAS PubMed.
  21. R. Watanabe, T. Yokoi, E. Kobayashi, Y. Otsuka, A. Shimojima, T. Okubo and T. Tatsumi, J. Colloid Interface Sci., 2011, 360, 1–7 CrossRef CAS PubMed.
  22. W. Stöber and A. Fink, J. Colloid Interface Sci., 1968, 26, 62–69 CrossRef.
  23. W. Fan, M. A. Snyder, S. Kumar, P.-S. Lee, W. C. Yoo, A. V. McCormick, R. Lee Penn, A. Stein and M. Tsapatsis, Nat. Mater., 2008, 7, 984–991 CrossRef CAS PubMed.
  24. D. Zhao, J. Feng, Q. Huo, N. Melosh, G. H. Fredrickson, B. F. Chmelka and G. D. Stucky, Science, 1998, 279, 548–552 CrossRef CAS PubMed.
  25. J.-S. Jan, T.-H. Chuang, P.-J. Chen and H. Teng, Langmuir, 2011, 27, 2834–2843 CrossRef CAS PubMed.
  26. M. Thommes, Chem. Ing. Tech., 2010, 82, 1059–1073 CrossRef CAS.
  27. C. Lin, K. Tao, D. Hua, Z. Ma and S. Zhou, Molecules, 2013, 18, 12609–12620 CrossRef CAS PubMed.
  28. Y.-C. Chang and D.-H. Chen, J. Hazard. Mater., 2009, 165, 664–669 CrossRef CAS PubMed.
  29. S. Saha, A. Pal, S. Kundu, S. Basu and T. Bal, Langmuir, 2010, 26, 2885–2893 CrossRef CAS PubMed.
  30. Q. Yao, C. Wang, H. Wang, H. Yan and J. Lu, J. Phys. Chem. C, 2016, 120, 9174–9183 CAS.
  31. C. M. A. Parlett, K. Wilson and A. F. Lee, Chem. Soc. Rev., 2013, 42, 3876–3893 RSC.
  32. J. Du, X. Lai, N. Yang, J. Zhai, D. Kisailus, F. Su, D. Wang and L. Jiang, ACS Nano, 2011, 5, 590–596 CrossRef CAS PubMed.
  33. K. Qiu and Z. X. Guo, J. Mater. Chem. A, 2014, 2, 3209–3215 CAS.
  34. X. Fu, X. Sheng, Y. Zhou, Z. Fu, S. Zhao, X. Bu and C. Zhang, RSC Adv., 2016, 6, 50630–50639 RSC.

Footnote

Electronic supplementary information (ESI) available. See DOI: 10.1039/c6ra21785k

This journal is © The Royal Society of Chemistry 2016
Click here to see how this site uses Cookies. View our privacy policy here.