 Open Access Article
Creative Commons Attribution 3.0 Unported Licence
Monodisperse AgPd alloy nanoparticles as a highly active catalyst towards the methanolysis of ammonia borane for hydrogen generation
Daohua
Sun
*,
Pengyao
Li
,
Bin
Yang
,
Yan
Xu
,
Jiale
Huang
and
Qingbiao
Li
Department of Chemical and Biochemical Engineering, College of Chemistry and Chemical Engineering, National Laboratory for Green Chemical Productions of Alcohols, Ethers and Esters, Xiamen University, Xiamen, 361005, P. R. China. E-mail: sdaohua@xmu.edu.cn; Fax: +86 592 2184822; Tel: +86 592 2183088
First published on 8th November 2016
Abstract
Monodisperse AgPd nanoparticles (NPs) were successfully synthesized by coreducing silver nitrate and palladium chloride in the presence of oleylamine. Characterization techniques such as transmission electron microscopy, energy-dispersive X-ray spectroscopy, and X-ray diffraction were employed to verify the alloy nature of the obtained NPs. These AgPd NPs, supported on carbon, were found to be active catalysts for the generation of hydrogen from the methanolysis of ammonia borane at room temperature. The catalytic activity depended on the alloy composition, and the Ag30Pd70 NPs displayed the greatest activity among the tested catalysts, with a very high total turnover frequency value of 366.4 min−1 and activation energy of 37.5 kJ mol−1. In a reusability test, the Ag30Pd70/C catalyst retained 67% of its initial activity and 100% conversion after eight cycles.
1. Introduction
Storage and transport of hydrogen are the widely accepted technological barriers to the development of the so-called hydrogen economy.1 As the lightest element in the periodic table, hydrogen in the gas form is extremely difficult to store. Considering economically viable and safe practices, efforts have been directed towards the development of chemical hydrides as a potential on-board storage form of hydrogen.2,3 Ammonia borane (AB) has been considered to be the most promising candidate among the chemical hydrides.4,5 This molecule is stable in the solid state at ambient temperatures and has shown an impressive gravimetric capacity of 19.6 wt% H2, potentially capable of meeting the 2015 target of the U.S. Department of Energy (9 wt% hydrogen for a material to be practically applicable).6,7 Hydrogen stored in AB can be produced and obtained by pure thermal decomposition, hydrolysis and methanolysis using a suitable catalyst. Considering the mild reaction conditions and favorable kinetics, solvolysis is preferred.8 The methanolysis or hydrolysis of AB can release 3.0 equivalents of hydrogen in the presence of a suitable catalyst. However, the hydrolysis of AB in concentrated solutions can cause liberation of ammonia gas, which can poison Pt-based fuel cells, and the hydrolysis product ammonium metaborate is difficult to recycle, which can pose enormous challenges to practical applications.9,10 In a previous study by Ramachandran, when methanol was used instead of water, the catalytic methanolysis of AB yielded hydrogen gas without ammonia evolution, and yielded the recyclable methanolysis product ammonium tetramethaoxyborate.6 In addition, the methanolysis reaction can even be initiated at temperatures below 0 °C through use of a suitable catalyst, which satisfies applications in cold weather.11Since methanolysis of AB can achieve a complete release of hydrogen in the presence of a suitable catalyst, finding the best catalyst for this process is very important. Heterogeneous catalysts were the first ones to be tested for the methanolysis of AB. RuCl3 and RhCl3 have been shown to exhibit excellent catalytic activity, but they are difficult to isolate and they display low stability, features that seriously restrict their practical application.6 Cu@Cu2O, Cu2O,12 Co–Co2B, Ni–Ni2B, Co–Ni–B,13 and Cu–Cu2O–CuO/C14 are cheaper transition metal-based catalysts, but suffer from low activity. The performance of the catalyst in the methanolysis of AB appears to depend on the identity of the metal. Thus, recent studies have been directed toward bimetallic alloy nanoparticles (NPs), as their catalytic properties have been found to be superior to those of either component metal alone due to synergistic effects. Our previous studies have also indicated monodisperse CoPd NPs15 and CuPd NPs16 to be more active than Pd-rich NPs in catalyzing the AB methanolysis reaction, with total turnover frequency (TOF) values of 27.7 and 53.2 min−1, respectively, having been attained.
Despite the significant progress made in the synthesis of bimetallic alloy NPs,17,18 size-controlled fabrication of nanostructures has become one of the most important and challenging aspects of modern nanotechnology. In the widely used method, the metal NPs are generated from the reduction of metal ions in solution in the presence of a stabilizer or supporting materials.19 To obtain uniformly sized, shape-controlled, and highly dispersed monodisperse NPs, “hot injection” techniques, which utilize homogeneous nucleation to synthesize monodisperse nanocrystals in organic solutions, are commonly used. For example, when using this technique, Sun20 prepared CoPd NPs with diameters of 5–12 nm and with a standard deviation of the diameter of less than 7%. Hyeon21 even succeeded in the incremental 1 nm size controlled synthesis of iron oxide NPs ranging from 6 to 13 nm. To allow precise control over size and monodispersity, capping agents such as oleic acid and organic metal salt precursor (e.g., acetylacetonate) have usually been employed.22–24 These agents, however, increase the costs of the catalytic process. Therefore, it is of crucial importance to develop rational cost-effective approaches to synthesize monodisperse alloy NPs.
Herein, we report the synthesis of monodisperse AgPd alloy NPs from inorganic salt silver(I) nitrate and palladium(II) chloride in oleylamine, and the evaluation of their performance in catalyzing the methanolysis of AB at ambient conditions. We demonstrated that the activity of these AgPd NPs can be enhanced by properly controlling the Ag/Pd molar ratio. In addition, these AgPd NPs showed a very high catalytic activity and prolonged lifetime.
2. Experimental
2.1 Chemicals
AgNO3, PdCl2, isopropanol, hexane and methanol were of analytical levels and used as received without any further purification. The borane–ammonia complex (90%) and oleylamine (80–90%) were purchased from Sigma-Aldrich and Aladdin, respectively. All pieces of glassware were washed several times with aqua regia and ordinary distilled water.2.2 Preparation of AgPd NPs
Typically, under the protection of a constant nitrogen flow, 0.2 mmol AgNO3 and 0.2 mmol PdCl2 were added into a four-necked flask with 15 mL of oleylamine. The mixture was heated to 110 °C gradually and kept at this temperature for 0.5 h in order to remove oxygen and moisture from the flask, and then the solution was heated to 210 °C at a heating rate of 4 °C min−1 and maintained at this temperature for 1 h before being cooled to room temperature. Afterwards, the mixture and 40 mL of isopropanol were transferred to centrifuge tubes, and the product was separated by centrifugation at 10![[thin space (1/6-em)]](https://www.rsc.org/images/entities/char_2009.gif) 000 rpm for 10 min. Finally, the product was dispersed in hexane.
000 rpm for 10 min. Finally, the product was dispersed in hexane.
For comparison, Ag NPs and Pd NPs were also, separately, synthesized and obtained. The Ag NPs were prepared by carrying out thermal decomposition of AgNO3 in the presence of oleylamine. The Pd NPs were prepared by carrying out thermal decomposition of PdCl2 in oleylamine. The procedures used to synthesize the Ag NPs and Pd NPs were similar to that used to synthesize AgPd NPs.
2.3 Preparation of the catalyst
Typically, accurately weighed 10 mg of AgPd nanoparticles were redispersed in 5 mL hexane and 5 mL acetone in a vial with a volume of 20.0 mL, and then a mass of 30 mg of Ketjen carbon (∼750 m2 g−1) was added. The resulting mixture was sonicated for 2 h to ensure that the nanoparticles were completely loaded onto the support. Next, the black solid residue AgPd/C catalyst was obtained after the hexane and acetone were vaporized as a result of a constant flow of nitrogen.2.4 Evaluation of the catalytic activity
To evaluate the catalytic activity of the AgPd/C catalyst for methanolysis of AB, the classic water-displacement method involving determining the rate of hydrogen generation was performed.15 Typically, a volume of 10 mL of a methanol suspension of the AgPd/C catalyst was transferred into a reaction flask (25 mL) containing a Teflon-coated stir bar placed on a magnetic stirrer. The reaction temperature was maintained at 25 °C using a constant temperature bath during the process, and the reaction flask was connected to a burette filled up with water to measure the volume of hydrogen. Weighed AB was then added into the reaction flask quickly with stirring at a rate of 800 rpm. The volume of hydrogen generated from methanolysis of AB in the flask was monitored and measured by recording the displacement of the water level at various intervals of time. The reaction was considered to be complete when the generation of more gas was no longer observed.2.5 Characterizations
Samples used for TEM and HRTEM analyses were prepared in advance by sonicating AgPd in hexane at a proper concentration and then depositing a drop of the resulting dispersion on a carbon-coated copper grid. The morphologies of the various types of NPs were visualized by using a TEM instrument operating at 300 kV, and an elemental analysis of the AgPd NPs was performed by carrying out an energy-dispersive X-ray spectroscopy (EDX) experiment. The dried and powdered samples were analyzed via X-ray diffraction (XRD) by using an X-ray diffractometer (Phillips, Netherlands) with Cu Kα radiation (40 kV, 30 mA). The composition and metallic content of the NPs were determined by performing inductively coupled plasma mass spectrometry (ICP-MS) (Agilent 7700x). The dried NPs were dissolved in HNO3 to assure the complete dissolution of the metal into the acid, and the obtained solution was then diluted with 2% HNO3. X-ray photoelectron spectroscopy (XPS) measurements were taken with an X-ray photoelectric spectrophotometer, and all binding energies were referenced to the C 1s peak, at 284.8 eV.3. Results and discussion
3.1 Synthesis and characterization of the monodisperse AgPd NPs
Zhang has reported the synthesis of AgPd alloy NPs with dimensions of 2.2 nm by coreducing Ag(Ac) and Pd(acac)2 in oleylamine, oleic acid and 1-octadecene at 180 °C.22 We replaced the above precursors with inorganic metal salts to yield a procedure that is more cost-effective but for which obtaining monodisperse nanoparticles is more challenging. Specifically, AgPd NPs were synthesized from AgNO3 and PdCl2 in oleylamine at 220 °C under the protection of a constant flow of nitrogen. The morphology and structure of the as-synthesized AgPd NPs were observed by performing TEM. For a molar ratio of Ag to Pd of about 1![[thin space (1/6-em)]](https://www.rsc.org/images/entities/char_2009.gif) :
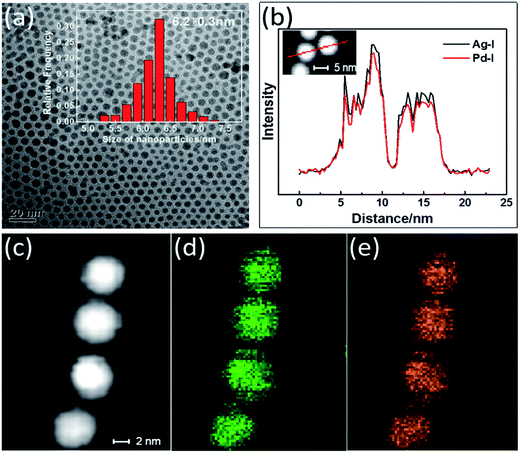
:![[thin space (1/6-em)]](https://www.rsc.org/images/entities/char_2009.gif) 1, the composition of the as-synthesized NPs was determined using ICP-MS to be Ag36Pd64. The as-synthesized NPs were observed to be spherical, with a mean diameter of 6.2 nm (Fig. 1(a)). These NPs were monodisperse, with a standard deviation of ∼5%. STEM-EDX images of the Ag36Pd64 NPs are shown in Fig. 1(b)–(e). Close inspection of several as-synthesized NPs suggested the Ag (Fig. 1(d)) and Pd (Fig. 1(e)) atoms to be evenly distributed throughout the NP. Moreover, EDX elemental line scanning of two NPs (Fig. 1(b)) also verified the presence of the alloy structure in these NPs.
1, the composition of the as-synthesized NPs was determined using ICP-MS to be Ag36Pd64. The as-synthesized NPs were observed to be spherical, with a mean diameter of 6.2 nm (Fig. 1(a)). These NPs were monodisperse, with a standard deviation of ∼5%. STEM-EDX images of the Ag36Pd64 NPs are shown in Fig. 1(b)–(e). Close inspection of several as-synthesized NPs suggested the Ag (Fig. 1(d)) and Pd (Fig. 1(e)) atoms to be evenly distributed throughout the NP. Moreover, EDX elemental line scanning of two NPs (Fig. 1(b)) also verified the presence of the alloy structure in these NPs.
The composition and size of AgPd bimetallic NPs could be facilely controlled by changing the ratio of AgNO3 to PdCl2. In our study, the total amounts of AgNO3 and PdCl2 were each set at 0.4 mmol, and ICP analyses indicated that as-synthesized NPs with the formulas Ag71Pd29, Ag44Pd56, Ag36Pd64, Ag30Pd70 and Ag12Pd88 were obtained when using the molar ratios of AgNO3 to PdCl2 of 9![[thin space (1/6-em)]](https://www.rsc.org/images/entities/char_2009.gif) :
:![[thin space (1/6-em)]](https://www.rsc.org/images/entities/char_2009.gif) 1, 7
1, 7![[thin space (1/6-em)]](https://www.rsc.org/images/entities/char_2009.gif) :
:![[thin space (1/6-em)]](https://www.rsc.org/images/entities/char_2009.gif) 3, 5
3, 5![[thin space (1/6-em)]](https://www.rsc.org/images/entities/char_2009.gif) :
:![[thin space (1/6-em)]](https://www.rsc.org/images/entities/char_2009.gif) 5, 3
5, 3![[thin space (1/6-em)]](https://www.rsc.org/images/entities/char_2009.gif) :
:![[thin space (1/6-em)]](https://www.rsc.org/images/entities/char_2009.gif) 7, and 1
7, and 1![[thin space (1/6-em)]](https://www.rsc.org/images/entities/char_2009.gif) :
:![[thin space (1/6-em)]](https://www.rsc.org/images/entities/char_2009.gif) 9, respectively. The TEM images of each of the above five NPs are shown in Fig. 2(b)–(f), with an image of the Ag NPs shown in Fig. 2(a) and that of the Pd NPs in Fig. 2(g). All of the as-synthesized NPs were observed to be spherical in shape and well-dispersed, except for the Ag12Pd88 and Pd NPs. The results may be attributed to the smaller particles more easily agglomerating during the synthetic process. As shown in Fig. 2(h), when the mole fraction of Ag was increased from 30% to 100%, the dimensions of the resulting particle increased on average from 5.4 nm to 12.3 nm. The influence of the molar ratio of the metals on the size of the bimetallic alloy NPs has also been reported in earlier studies.25,26 The dependence of the size of the alloy NPs on the composition has been indicated to be related to the collision energy, sticking coefficient, rate of nucleation and growth.27
9, respectively. The TEM images of each of the above five NPs are shown in Fig. 2(b)–(f), with an image of the Ag NPs shown in Fig. 2(a) and that of the Pd NPs in Fig. 2(g). All of the as-synthesized NPs were observed to be spherical in shape and well-dispersed, except for the Ag12Pd88 and Pd NPs. The results may be attributed to the smaller particles more easily agglomerating during the synthetic process. As shown in Fig. 2(h), when the mole fraction of Ag was increased from 30% to 100%, the dimensions of the resulting particle increased on average from 5.4 nm to 12.3 nm. The influence of the molar ratio of the metals on the size of the bimetallic alloy NPs has also been reported in earlier studies.25,26 The dependence of the size of the alloy NPs on the composition has been indicated to be related to the collision energy, sticking coefficient, rate of nucleation and growth.27
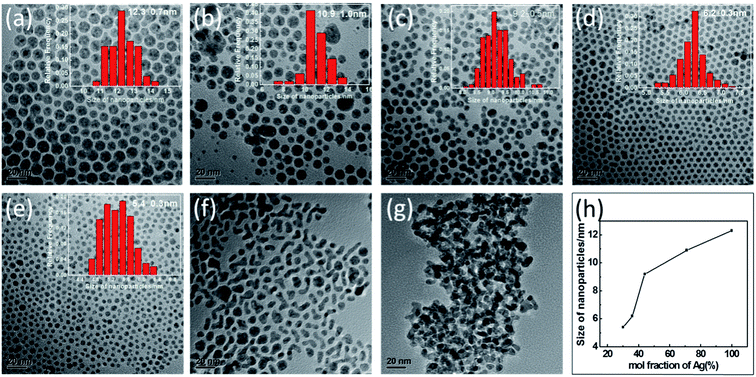 | ||
| Fig. 2 Representative TEM images of (a) Ag, (b) Ag71Pd29, (c) Ag44Pd56, (d) Ag36Pd64, (e) Ag30Pd70, (f) Ag12Pd88 and (g) Pd NPs. (h) Plot of AgPd NPs size versus mole fraction of Ag. | ||
XRD patterns of the monometallic and bimetallic NPs are shown in Fig. 3(b). Each pattern exhibited several diffraction peaks, which can be indexed to the (111), (200), (220), (311) and (222) planes of the fcc structure of Ag and Pd, representing five diffraction rings in the selected area electron diffraction (SAED) pattern (Fig. 3(a)). Fig. 3(c) shows a plot of the diffraction angle versus the Pd molar fraction. All of these XRD peaks gradually shifted to larger angles as the Pd content was increased. As shown in the inset of Fig. 3(c), an intense peak resulted from each of the AgPd NPs produced using AgNO3 to PdCl2 ratios of 9![[thin space (1/6-em)]](https://www.rsc.org/images/entities/char_2009.gif) :
:![[thin space (1/6-em)]](https://www.rsc.org/images/entities/char_2009.gif) 1, 7
1, 7![[thin space (1/6-em)]](https://www.rsc.org/images/entities/char_2009.gif) :
:![[thin space (1/6-em)]](https://www.rsc.org/images/entities/char_2009.gif) 3, 5
3, 5![[thin space (1/6-em)]](https://www.rsc.org/images/entities/char_2009.gif) :
:![[thin space (1/6-em)]](https://www.rsc.org/images/entities/char_2009.gif) 5, 3
5, 3![[thin space (1/6-em)]](https://www.rsc.org/images/entities/char_2009.gif) :
:![[thin space (1/6-em)]](https://www.rsc.org/images/entities/char_2009.gif) 7, 1
7, 1![[thin space (1/6-em)]](https://www.rsc.org/images/entities/char_2009.gif) :
:![[thin space (1/6-em)]](https://www.rsc.org/images/entities/char_2009.gif) 9, respectively. The curves in this figure indicated that the positions of the (111) diffraction peaks from the AgPd NPs were indeed between that from a pure Ag crystal at 38.23° and that from a pure Pd crystal at 39.23°. These results further confirmed the alloy nature of the products synthesized from the various initial molar ratios of AgNO3 to PdCl2.
9, respectively. The curves in this figure indicated that the positions of the (111) diffraction peaks from the AgPd NPs were indeed between that from a pure Ag crystal at 38.23° and that from a pure Pd crystal at 39.23°. These results further confirmed the alloy nature of the products synthesized from the various initial molar ratios of AgNO3 to PdCl2.
The Ag 3d and Pd 3d regions of the XPS spectra of three representative AgPd alloy NPs are shown in Fig. 4(c) and (d), respectively. For comparison, Fig. 4(a) and (b) show the XPS spectra of the Ag 3d and Pd 3d regions of monometallic Ag NPs and Pd NPs, respectively. The differences (Δ values) between the positions of the 3d5/2 and 3d3/2 peaks of Ag were observed to be 6.0 eV, and the differences between the positions of the 3d5/2 and 3d3/2 peaks of Pd were observed to be 5.3 eV. These values were the same as the reported values for zero-valent Ag and Pd, respectively.28,29 Hence, Ag and Pd atoms existed in the zero-valent state in all of the prepared alloy samples. The positions of the XPS peaks are listed in Table 1 for further reference. The binding energy of Ag 3d was clearly shifted to lower energy and the binding energy of Pd 3d shifted to higher energy when the Pd content was increased, indicating that Ag and Pd formed an alloy cluster.30 The formation of interfacial metal–metal bonds for a bimetallic alloy can produce large perturbations to the Hamiltonian, binding energy density, and hence the catalytic properties.31 Sun has mentioned that the polarization of AgPd shifts the valence density of state to generate excessive electrons, which makes the AgPd alloy serve as a charge donor in the catalytic reaction.32
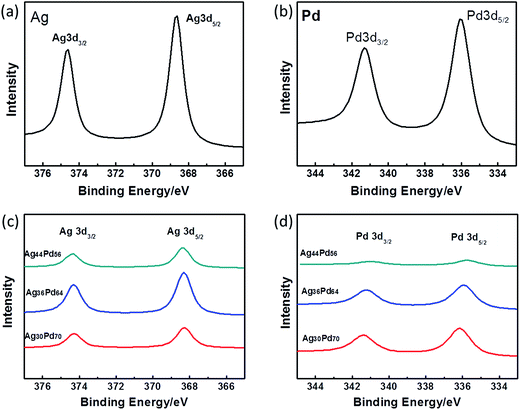 | ||
| Fig. 4 X-ray photoelectron spectroscopy (XPS) patterns showing the (a) Ag 3d region for the Ag NPs, (b) Pd 3d region for the Pd NPs, (c) Ag 3d and (d) Pd 3d regions for the AgPd alloy NPs. | ||
| NPs | Binding energy (eV) | |||
|---|---|---|---|---|
| Ag | Pd | |||
| 3d5/2 | 3d3/2 | 3d5/2 | 3d3/2 | |
| Ag | 368.66 | 374.65 | ||
| Ag44Pd56 | 368.36 | 374.37 | 340.96 | 335.69 |
| Ag36Pd64 | 368.29 | 374.29 | 341.20 | 335.91 |
| Ag30Pd70 | 368.28 | 374.27 | 341.42 | 336.12 |
| Pd | 341.28 | 336.00 | ||
3.2 Methanolysis of AB catalyzed by monodisperse AgPd NPs
The as-synthesized NPs supported on Ketjen carbon acted as catalysts for the generation of hydrogen from the methanolysis of the AB solution. As shown in Fig. 5, pure Ag NPs, pure Pd NPs and 5 compositions of AgPd NPs supported on Ketjen carbon exhibited different levels of catalytic activity for the methanolysis of AB. Interestingly, among the tested catalysts, Ag30Pd70/C NPs displayed the highest catalytic activity with a completion time of 15 s for 100 mM AB, obviously better than those of pure Pd NPs and Ag NPs, which indicated the existence of a synergistic effect between the Ag and Pd. The metal content of the oleylamine-coated Ag30Pd70 was determined, using ICP-AES, to be 34.6 wt%. The catalytic activity of Ag30Pd70/C for the methanolysis of AB was also assessed by determining its TOF, which was found to be 366.4 mol of H2 (mol of catalyst min)−1. The very high activity of Ag30Pd70 NPs probably resulted from their small dimensions and regular shapes.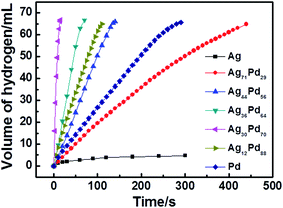 | ||
| Fig. 5 Plots of reaction time versus volume of hydrogen released from the methanolysis of AB catalyzed by AgPd/C catalysts with different compositions (10 mg NPs, [AB] = 100 mM, T = 25 ± 1 °C). | ||
3.3 Methanolysis kinetics of the Ag30Pd70/C catalyst
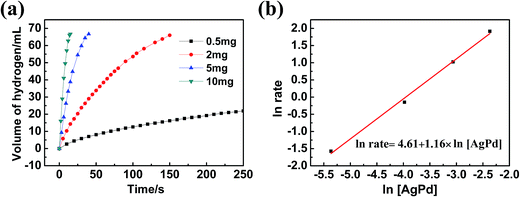
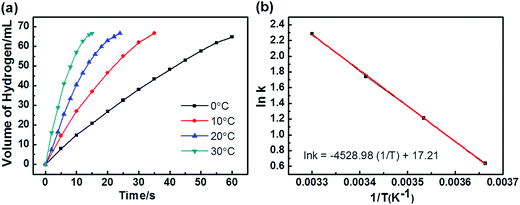
As the Ag30Pd70/C catalyst exhibited the highest activity, we chose it for further study of its kinetics. First, the methanolysis reaction was carried out using various dosages of the Ag30Pd70 NPs, specifically at 0.5 mg, 2 mg, 5 mg, and 10 mg of the NPs (representing Ag30Pd70 concentrations at 0.16 mM, 0.64 mM, 1.6mM, and 3.2 mM, respectively), with a constant AB concentration of 100 mM at 25 ± 1 °C. The plots of hydrogen generation from the methanolysis of the AB solution in the presence of different dosages of Ag30Pd70/C NPs are shown in Fig. 6(a). The slope of the linear initial portion of each plot was chosen as the rate of hydrogen generation corresponding to the respective catalyst concentration. As shown in Fig. 6(b), a plot of the natural logarithm of the rate of hydrogen generation versus the natural logarithm of the concentration of Ag30Pd70 was found to be nearly linear, with a slope of 1.16. The linear nature of this plot indicated that the methanolysis of AB followed nearly first order kinetics with respect to the concentration of Ag30Pd70/C.To obtain the activation energy of the methanolysis of AB catalyzed by AgPd/C NPs, reactions at various temperatures from 0–30 °C were carried out. The values of the rate constant k at these temperatures were calculated from the slope of the linear part of each plot shown in Fig. 7(a). The Arrhenius plot, i.e., ln![[thin space (1/6-em)]](https://www.rsc.org/images/entities/char_2009.gif) k vs. 1/T, for the catalyst is shown in Fig. 7(b), from which the apparent activation energy was determined to be approximately 37.5 kJ mol−1. Table 2 summarizes performance features of the various catalysts towards the methanolysis of AB at room temperature. The Ag30Pd70/C catalyst was determined to be the most active catalyst, even better than Ru11- and Rh38,39-based catalysts based on comparing their TOF values.
k vs. 1/T, for the catalyst is shown in Fig. 7(b), from which the apparent activation energy was determined to be approximately 37.5 kJ mol−1. Table 2 summarizes performance features of the various catalysts towards the methanolysis of AB at room temperature. The Ag30Pd70/C catalyst was determined to be the most active catalyst, even better than Ru11- and Rh38,39-based catalysts based on comparing their TOF values.
| Catalyst | TOF/min−1 | E a/kJ mol−1 | Ref. |
|---|---|---|---|
| RuCl3 | 150 | — | 6 |
| NiCl2 | 2.9 | — | 6 |
| PdCl2 | 1.5 | — | 6 |
| Cu@Cu2O | 0.16 | — | 12 |
| Co–Ni–B | 10.0 | — | 13 |
| PVP–Pd | 22.3 | 35 ± 2 | 33 |
| Rh/zeolite | 30 | 40.04 | 34 |
| Ru/MMT | 90.9 | 23.8 ± 1.2 | 9 |
| PVP–Ru | 66.95 | 58 ± 2 | 35 |
| CoPd/C | 27.7 | 25.5 | 15 |
| Mesoporous Cu | 2.41 | 34.2 ± 1.2 | 36 |
| CuPd/C | 53.2 | 35.4 | 16 |
| Cu–Cu2O–CuO/C | 24 | 67.9 | 14 |
| Ru/graphene | 99.4 | 54.1 ± 2 | 11 |
| PVP–Ni | 12.1 | 63 ± 2 | 37 |
| Rh/nano HAP | 147 | 56 ± 2 | 38 |
| Rh/nanosilica | 168 | 49 ± 2 | 39 |
| Ag30Pd70/C | 366.4 | 37.5 | This study |
3.4 Reusability of the Ag30Pd70/C catalyst
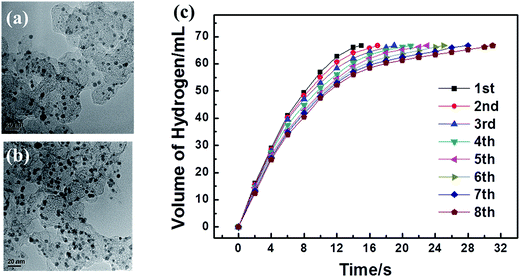
The reusability of a catalyst is crucial for practical applications. After the first run of methanolysis of AB (1 mmol) catalyzed by 3.2 mM NPs, the catalyst was kept in the solution and another equivalent amount of AB was added to the reaction system. The gas generation was monitored and the same procedure was repeated. Fig. 8(c) shows the hydrogen productivity versus reaction time for the generation of hydrogen from the AB solution catalyzed by Ag30Pd70/C at 8 recycles under ambient conditions. The activity of Ag30Pd70/C catalysts decreased with the number of recycles, and the TOF value dropped from 366.4 to 248.9 min−1 after the eight runs. The TEM images shown in Fig. 8(a) and (b) indicated that there was no noticeable change either in NP size or morphology, so the decreased activity of the Ag30Pd70/C catalysts may be attributed to the loss of metal from the surface of the carbon or the deactivation effect of the increasing metaborate concentration during the methanolysis of AB. To examine this possibility, supernatant liquid after the reusability tests was filtered to remove the support. ICP analysis of the solution indicated the presence of a small amount of Ag.4. Conclusions
In summary, we have reported the synthesis of monodisperse AgPd alloy NPs by the coreduction of silver nitrate and palladium chloride in oleylamine. These NPs exhibited notable activity towards hydrogen generation from the methanolysis of AB at room temperature due to the uniform size of the particles on the support and the synergistic effects between Ag and Pd. The catalytic activity was found to be closely related to the alloy composition, and the Ag30Pd70 NPs were shown to be the most active, with a TOF value of 366.4 min−1. The kinetic studies that we carried out on these alloy NPs indicated the catalytic methanolysis of AB to be first-order with respect to the catalyst concentration. The activation energy was determined to be 37.5 kJ mol−1. Moreover, the Ag30Pd70/C catalyst retained 67% of its initial activity after 8 catalytic cycles. Their tunable catalytic properties shown here indicate that these AgPd alloy NPs have great potential in developing AB as a hydrogen storage material for fuel cell applications.Acknowledgements
This work was supported by NSFC project numbers 21476187 and 21536010.References
- L. Schlapbach and A. Züttel, Nature, 2001, 414, 353–358 CrossRef CAS PubMed.
- U. Eberle, M. Felderhoff and F. Schueth, Angew. Chem., Int. Ed., 2009, 48, 6608–6630 CrossRef CAS PubMed.
- J. Yang, A. Sudik, C. Wolverton and D. J. Siegel, Chem. Soc. Rev., 2010, 39, 656–675 RSC.
- T. B. Marder, Angew. Chem., Int. Ed., 2007, 46, 8116–8118 CrossRef CAS PubMed.
- F. H. Stephens, V. Pons and R. T. Baker, Dalton Trans., 2007, 25, 2613–2626 RSC.
- P. V. Ramachandran and P. D. Gagare, Inorg. Chem., 2007, 46, 7810–7817 CrossRef CAS PubMed.
- S. Satyapal, J. Petrovic, C. Read, G. Thomas and G. Ordaz, Catal. Today, 2007, 120, 246–256 CrossRef CAS.
- M. Diwan, D. Hanna and A. Varma, Int. J. Hydrogen Energy, 2010, 35, 577–584 CrossRef CAS.
- H. B. Dai, X. D. Kang and P. Wang, Int. J. Hydrogen Energy, 2010, 35, 10317–10323 CrossRef CAS.
- K. V. Kordesch and G. R. Simader, Chem. Rev., 1995, 95, 191–207 CrossRef CAS.
- S. G. Peng, J. C. Liu, J. Zhang and F. Y. Wang, Int. J. Hydrogen Energy, 2015, 40, 10856–10866 CrossRef CAS.
- S. B. Kalidindi, U. Sanyal and B. R. Jagirdar, Phys. Chem. Chem. Phys., 2008, 10, 5870–5874 RSC.
- S. B. Kalidindi, A. A. Vernekar and B. R. Jagirdar, Phys. Chem. Chem. Phys., 2009, 11, 770–775 RSC.
- M. Yurderi, A. Bulut, I. E. Ertas, M. Zahmakiran and M. Kaya, Appl. Catal., B, 2015, 165, 169–175 CrossRef CAS.
- D. H. Sun, V. Mazumder, Ö. Metin and S. H. Sun, ACS Catal., 2012, 2, 1290–1295 CrossRef CAS.
- P. Y. Li, Z. L. Xiao, Z. Y. Liu, J. L. Huang, Q. B. Li and D. H. Sun, Nanotechnology, 2015, 26, 025401 CrossRef CAS PubMed.
- D. S. Wang and Y. D. Li, Adv. Mater., 2011, 23, 1044–1060 CrossRef CAS PubMed.
- R. G. Chaudhuri and S. Paria, Chem. Rev., 2012, 112, 2373–2433 CrossRef PubMed.
- M. Zahmakıran and S. Özkar, Nanoscale, 2011, 3, 3462–3481 RSC.
- V. Mazumder, M. F. Chi, M. N. Mankin, Y. Liu, O. Metin, D. H. Sun, K. L. More and S. H. Sun, Nano Lett., 2012, 12, 1102–1106 CrossRef CAS PubMed.
- J. Park, E. Lee, N. M. Hwang, M. Kang, S. C. Kim, Y. Hwang, J. G. Park, H. J. Noh, J. Y. Kim, J. H. Park and T. Hyeon, Angew. Chem., Int. Ed., 2005, 44, 2872–2877 CrossRef CAS PubMed.
- S. Zhang, Ö. Metin, D. Su and S. H. Sun, Angew. Chem., Int. Ed., 2013, 52, 3681–3684 CrossRef CAS PubMed.
- Ö. Metin, S. F. Ho, C. Alp, H. Can, M. N. Mankin, M. S. Gültekin, M. F. Chi and S. H. Sun, Nano Res., 2013, 6, 10–18 CrossRef.
- Ö. Metin, X. L. Sun and S. H. Sun, Nanoscale, 2013, 5, 910–912 RSC.
- D. H. Chen and C. J. Chen, J. Mater. Chem., 2002, 12, 1557–1562 RSC.
- Y. T. Ji, S. C. Yang, S. W. Guo, X. P. Song, B. J. Ding and Z. M. Yang, Colloids Surf., A, 2010, 372, 204–209 CrossRef CAS.
- F. F. Lu, D. H. Sun, J. L. Huang, M. M. Du, F. Yang, H. M. Chen, Y. L. Hong and Q. B. Li, ACS Sustainable Chem. Eng., 2014, 2, 1212–1218 CrossRef CAS.
- E. V. Carino, M. R. Knecht and R. M. Crooks, Langmuir, 2009, 25, 10279–10284 CrossRef CAS PubMed.
- S. W. Han, Y. Kim and K. Kim, J. Colloid Interface Sci., 1998, 208, 272–278 CrossRef CAS PubMed.
- D. S. Lee and Y. W. Chen, J. Taiwan Inst. Chem. Eng., 2013, 44, 40–44 CrossRef CAS.
- P. Kamakoti, B. D. Morreale, M. V. Ciocco, B. H. Howard, R. P. Killmeyer, A. V. Cugini and D. S. Sholl, Science, 2005, 307, 569–573 CrossRef CAS PubMed.
- C. Q. Sun, Y. Wang, Y. G. Nie, B. R. Mehta, M. Khanuja, S. M. Shivaprasad, Y. Sun, J. S. Pan, L. K. Pan and Z. Sun, Phys. Chem. Chem. Phys., 2010, 12, 3131–3135 RSC.
- H. Erdogan, Ö. Metin and S. Özkar, Phys. Chem. Chem. Phys., 2009, 11, 10519–10525 RSC.
- S. Caliskan, M. Zahmakiran and S. Özkar, Appl. Catal., B, 2010, 93, 387–394 CrossRef CAS.
- H. Erdogan, Ö. Metin and S. Özkar, Catal. Today, 2011, 170, 93–98 CrossRef CAS.
- Q. L. Yao, M. Huang, Z. H. Lu, Y. W. Yang, Y. X. Zhang, X. S. Chen and Z. Yang, Dalton Trans., 2014, 44, 1070–1076 RSC.
- D. Özhava, N. Z. Kılıçaslan and S. Özkar, Appl. Catal., B, 2015, 162, 573–582 CrossRef.
- D. Özhava and S. Özkar, Int. J. Hydrogen Energy, 2015, 40, 10491–10501 CrossRef.
- D. Özhava and S. Özkar, Appl. Catal., B, 2016, 181, 716–726 CrossRef.
| This journal is © The Royal Society of Chemistry 2016 |

