DOI:
10.1039/C6RA21607B
(Paper)
RSC Adv., 2016,
6, 107829-107835
Morphology evolution, formation mechanism and adsorption properties of hydrochars prepared by hydrothermal carbonization of corn stalk†
Received
29th August 2016
, Accepted 16th October 2016
First published on 27th October 2016
Abstract
The formation condition, morphology evolution, reaction mechanism and adsorption properties of hydrochars prepared from corn stalk were explored using a hydrothermal method at low temperatures for a continuous period of reaction time. The experimental results showed that by prolonging the reaction time up to 26 h, corn stalk could be converted into hydrochar via HTC at a low temperature of 200 °C. It was found that hemicellulose was completely dissolved and more amorphous phases of cellulose and soluble lignin were fragmented and dissolved with increase of the reaction time. The ester, furfural and phenolic derivatives underwent a series of reactions in an aqueous solution to form polymerized hydrochar microspheres, whereas the non-dissolved cellulose and lignin went through a heterogeneous pyrolysis-like process to form polyaromatic char with an interconnected porous network structure. The as-prepared hydrochars with oxygen-containing functional groups and unique porous network structures could adsorb a larger amount of Cr(VI) than commercial activated carbon and were an effective and green sustainable adsorbent for the removal of Cr(VI) from an aqueous solution.
Introduction
Biomasses and their derivative precursors are considered as potential platform compounds, from which a variety of carbon-based materials, chemicals and fuels have been synthesized using innovative and sustainable production technologies.1 The ambition to use biomasses and their derivatives has led to worldwide research programs.2,3 As a consequence, the biomass-to-carbon conversion (biomass-based carbon material) is meeting its most rapid development and is one of the most important topics in biomass research field.4 In general, two main thermochemical processes are used for biomass-to-carbon conversion:5 torrefaction and hydrothermal carbonization. Torrefaction is a pyrolysis process in which the biomass must be dried. Numerous studies have been conducted on this topic.6–8 As a promising, inexpensive and low energy consumption approach, hydrothermal carbonization (HTC) can convert wet biomass into carbon-based materials with flexible morphologies, pore structures and functionalities at relatively mild conditions.9 It also allows the generation of a variety of nanostructured carbon materials, which can be applied in the fields of adsorption,10–12 catalysis,13,14 fuels15,16 and even as an soil additive.17,18
HTC is associated with a series of reactions, including hydrolysis, condensation, dehydration, decarboxylation, polymerization and aromatization of biomass components. The detailed reaction nature and mechanisms strongly depend on the type and composition of the feedstock and process conditions (such as reaction temperature and retention time). Many studies on the mechanism and morphology of the hydrochar produced from various precursors have been conducted.19–28 Although these results provide valuable information for understanding the process of HTC, only a little research on the reaction process of raw biomass has been done. It is well known that different biomass owns different cellulose, hemicellulose, and lignin weigh ratios; therefore, various reactions in different biomass could take place during the HTC transformation. Previous studies suggested that the formation and characteristics of hydrochar from biomass are mainly governed by the reaction temperature and time.29–33 However, the reported studies mainly focused on the process of decomposition and dissolution of biomass and the effect of critical temperature and critical time during HTC. They did not show any detailed information about the effect of extended reaction time. Because biomass was first dissolved during HTC and the dissolution process was diffusion controlled, reaction time plays a significant role in controlling the chemical characteristics of the carbonization products; both the aqueous products and hydrochar may undergo significant conversion with the time. Thus, it is essential to perform a comprehensive and detailed exploration on the carbonization production evolution with the reaction time.
Corn stalk, an agricultural byproduct, is usually burned in the fields, which produces environmental pollution. In the limited literatures for the HTC of corn stalk, Fuertes,34 Xiao35 and Guo36 did some work on the physical and chemical properties of hydrochar. However, these studies are carried out under a limited time frame, and the composition evolution of aqueous products has not been systematically studied at different times. Herein, the aim of the present study is to explore the effect of reaction time on the chemical compositions of aqueous products and chemical properties and structures of hydrochar from corn stalk and further propose potential mechanism of HTC.
Experimental section
Instruments
Elemental analysis (C, H, N) was performed with a Elementar Vario EL III analyzer. The surface morphology of solid was examined with a S4800 scanning electron microscope (SEM). Transmission electron microscopy (TEM) was performed using a FEI Tecnai G2F20S-TWIN microscope. Fourier transform infrared (FT-IR) measurements were performed using a Perkin Elmer System FT-IR670 using the KBr technique. Teller (BET) nitrogen-sorption data were obtained with a Micromeritics ASAP2020M automated gas adsorption analyzer. GC-MS analyses were conducted on a Varian Trace GC, ultra DSQ II using capillary columns of TR-5MS, single quadrupole detector, with He as the carrier gas. Operating conditions were as follows: 40 °C for 2 min, increased to 280 °C at a rate of 20 °C min−1, and finally maintained at 280 °C for 10 min. X-ray photoelectron spectroscopy (XPS) was carried out by a Specs spectrometer using Mg Kα (1253.6 eV) radiation from a double anode at 50 W, and the binding energies (BE) were corrected taking C1s (284.6 eV) as the reference.
Reagents
Corn stalks were collected from the croplands of suburb of Hohhot, China. The stalks were cut into small chips, milled and sieved to particles below 100 μm.
Synthesis of the hydrochar
2 g of as-prepared sample was dispersed in water (65 ml) and stirred for 2 h at room temperature, and then was heated up to 200 °C at a heating rate of around 3 °C min−1 from 3 h to 44 h in a Teflon-lined autoclave (100 ml). After each reaction, the reactors were cooled down to room temperature, and the solid/liquid products were separated by filtration. The liquid portion was extracted with equal volume of ether and separated into the ether phase and aqueous phase; the ether phase was frozen at −18 °C until analysis. The remaining solid fraction was washed repeatedly with distilled water and then with ethanol until the solvent was colourless and then the remaining solid (here denoted as hydrochar) was dried at 80 °C for 24 h. Ether phase was analyzed by GC-MS to determine their major components qualitatively and quantitatively.
Results and discussion
Characteristics of the liquid products
The ether phase of the reaction products from each individual reaction time was analyzed on a GC/MS. The main components in all GC curves are consisted of ether compounds (such as hexadecanoic acid, 1-(hydroxymethyl)-1,2-ethanediyl ester, diisooctyl ester), furfural (such as 2-furancarboxaldehyde, 5-(hydroxymethylfurfural) (5-HMF)), phenol and other phenolic compounds (such as 2,6-dimethoxy phenol). Furfural and 5-HMF compounds were originated from the thermal decomposition of hemicellulose and cellulose, respectively, and phenol and its other derivatives were products of lignin decomposed by the cleavage of the β-aryl and benzoyl ether bonds.37–39 In order to further analyze the hydrolysis products of hemicellulose, cellulose and lignin of the corn stalk, the outer bark and inner pulp of corn stalk were sampled using skin stalk splitters. By using the Van Soest method, the contents of cellulose, hemicellulose, and lignin in both outer bark and inner pulp were determined (see Table 1). Then, both samples proceeded to a hydrothermal reaction at 200 °C. The chemical compositions of the ether phase at each individual reaction time were qualitatively characterized by GC/MS and are summarized in Table 1. It can be seen that for 6 h, the relative area percentages of furfural were 47.89% and 35.75% for the skin and pulp, respectively, and then decreased with reaction time further extending, and no furfural in skin was found after 30 h. The results show that furfurals polymerized and generated carbon microspheres with extending reaction time, which is consistent with Hashaikeh's results.33 However, the content of phenol and 5-HMF compounds increased with the increase of reaction time indicating that the decomposed products from lignin and cellulose were produced, and the product content in the skin is more than that in the pulp. The results suggested that hemicellulose was completely decomposed and cellulose and lignin were decomposed partially when the reaction time is long enough.
Table 1 Composition of cornstalk (% dry weight) and the identified components and their respective area percentagesa
Type |
Hec (wt%) |
Cel (wt%) |
Ligin (wt%) |
T (h) |
Fur (area%) |
5-HMF (area%) |
Phe (area%) |
Hec: hemicellulose; Cel: cellulose; Lig: ligin; T: time; Fur: furfural; Phe: phenol. |
Skin |
21.78 |
47.98 |
11.51 |
3 |
3.39 |
0.25 |
2.42 |
6 |
47.89 |
1.46 |
1.04 |
18 |
28.37 |
4.14 |
4.4 |
30 |
0.00 |
10.34 |
14.26 |
Pulp |
25.43 |
39.66 |
4.31 |
3 |
1.97 |
0.00 |
0.00 |
6 |
35.75 |
1.02 |
1.75 |
18 |
27.07 |
1.84 |
2.71 |
30 |
17.49 |
3.11 |
5.60 |
Characteristics of the hydrochar
Chemical compositions of hydrochar. Corn stalks were turned into dark brown to black powders after the reaction. The effect of reaction time on characteristics of hydrochars was studied from 3 h to 44 h, and the results are listed in Table 2. All the aqueous solutions were acidic with the pH value ranged from 3.6 to 4.0. The yield of hydrochar is in the 30–44 wt% range for reaction time of 6–26 h. Herein, we need to point out that the hydrochar yield from water soluble monosaccharides gradually increases as the reaction time increases, on the contrary, the yield of the hydrochar from biomass gradually decreases from an initial value of 100%, then increased and eventually remained constant. This because the liquid and volatile side products were formed initially by hydrolysis and/or dehydration; therefore, the yield of hydrochar decreased for a short period of time. The liquid phase products were re-polymerized and/or condensed to hydrochar with the extension of the reaction time until the liquid phase products become inert. Some authors have reported that a longer reaction time was more favorable for the production of solid residue25,28 owing to the formation of a solid residue by repolymerization of heavy oil. Table 2 shows that the yield of hydrochar increased after 16 h of reaction, and the yield did not significantly change when the reaction time was longer than 26 h, suggesting that the extension of the reaction time has no significant effect on the yield after 26 h. The content of N in the hydrochar shows a trend of increase, which can be attributed to hydrolysis of mainly carbohydrates in biomass; however, nitrogen was present in the hydrochar network in the form of nitrogen compounds, which is not affected by the hydrolysis process. Therefore, the nitrogen content of hydrochar increases with the increase of reaction degree. The elemental composition (C, O, and H) of the hydrochars was measured, each analysis was repeated twice, and the mean values of these two measurements are listed in Table 2. The carbon content increased from 44.24 wt% in the raw material to 56.71 wt% in the hydrochar samples for the reaction time of 3–26 h, and the content of carbon obtained for 28–44 h was relatively stable (56–57 wt%), which further indicated that 26 h is the optimum time of HTC at the temperature of 200 °C, at which a large fraction of carbon in the corn stalks was stored, and the residue was dissolved in the aqueous phase. The O/C ratio decreased with increasing reaction time for 3–26 h, while it was stable after 26 h. The behaviour of decreasing O/C suggested that decarboxylation and dehydration took place during HTC.40 The H/C ratio varied slightly with increasing reaction time, and the nitrogen content of hydrochar was low, approximately 1% for 26–44 h. In all, the variation in the elemental composition and the yield of hydrochar indicated that a greater degree of polymerization or condensation reaction of the products in liquid phase was carried out before 28 h, and the extension of the reaction time has no significant effect on the yield, which implicated that 26 h was sufficient for producing hydrochar at the temperature of 200 °C.
Table 2 Physical properties of hydrochar materialsa
t (h) |
Yb [%] |
pHe |
N (wt%) |
C (wt%) |
H (wt%) |
Oc (%) |
O/Cd |
H/Cd |
t: reaction time. Y, expressed as yield (g product per 100 g raw material). O, oxygen content is estimated as follows: O = 100 − (C + H + N + S + ash). Atomic ratio. pH referred to the solution phase after the reaction. |
0 |
— |
— |
0.14 |
44.24 |
5.79 |
49.83 |
0.84 |
1.57 |
3 |
0.53 |
4.00 |
0.20 |
47.90 |
6.07 |
45.83 |
0.72 |
1.52 |
6 |
0.30 |
3.73 |
0.74 |
48.92 |
5.84 |
44.50 |
0.68 |
1.43 |
8 |
0.30 |
3.66 |
0.86 |
51.94 |
5.76 |
41.44 |
0.60 |
1.33 |
10 |
0.32 |
3.72 |
0.88 |
52.10 |
5.35 |
41.67 |
0.60 |
1.23 |
14 |
0.39 |
3.80 |
0.91 |
54.11 |
5.44 |
39.54 |
0.55 |
1.21 |
16 |
0.44 |
3.75 |
0.63 |
55.03 |
6.11 |
38.23 |
0.52 |
1.33 |
18 |
0.41 |
3.68 |
0.68 |
52.40 |
5.83 |
41.09 |
0.59 |
1.34 |
20 |
0.42 |
3.67 |
0.72 |
54.45 |
5.89 |
38.94 |
0.54 |
1.30 |
22 |
0.45 |
3.68 |
0.56 |
55.30 |
6.07 |
38.07 |
0.52 |
1.32 |
24 |
0.41 |
3.65 |
0.77 |
55.81 |
5.84 |
37.58 |
0.51 |
1.26 |
26 |
0.44 |
3.41 |
1.10 |
56.71 |
5.50 |
36.69 |
0.49 |
1.16 |
28 |
0.37 |
3.66 |
1.11 |
56.50 |
5.62 |
36.77 |
0.49 |
1.19 |
32 |
0.38 |
3.64 |
0.89 |
56.62 |
5.74 |
36.75 |
0.49 |
1.22 |
34 |
0.39 |
3.64 |
0.78 |
56.65 |
5.85 |
36.72 |
0.49 |
1.24 |
38 |
0.38 |
3.60 |
0.93 |
56.43 |
5.70 |
36.94 |
0.49 |
1.21 |
40 |
0.38 |
3.67 |
1.13 |
56.97 |
5.56 |
36.34 |
0.48 |
1.17 |
44 |
0.38 |
3.65 |
0.94 |
56.96 |
5.89 |
36.21 |
0.48 |
1.24 |
FT-IR spectra and XPS analyses
The chemical transformations of the hydrochar were characterized by Fourier transform infrared (FT-IR) spectroscopy. As shown in Fig. 1, the IR spectra of hydrochars are completely different from that of corn stalk and change with reaction time; however, they remained similar for the reactions beyond 26 h. The broad adsorption peak at about 3411–3449 cm−1 was assigned to the O–H stretching vibration of both hydroxyl and carboxyl groups, and this peak is weaker and narrower for hydrochar than that for corn stalk, suggesting that hydroxyl or carboxyl groups were involved in the reaction. The bands in the range 2907–2941 cm−1 were attributed to aliphatic C–H stretching vibration. The bands at 1674–1728 cm−1 corresponded to C
O (carbonyl, ester, or carboxyl) groups, whereas the peak at 1589–1648 cm−1 was ascribed to C
C group vibration of aromatic structure. The bands in the 1000–1200 cm−1 region mainly corresponded to C–O–C stretching and O–H bending vibrations. As the reaction time increases, the reduction in intensity of these peaks indicated that dehydration and aromatization processes occurred during HTC. The peak at 591–622 cm−1 belonged to C–H out-of-plane bending vibrations. Analysis of the FT-IR spectra also indicated that substantial amount of oxygen-containing functional groups existed on the surface of the hydrochar. Transformation of oxygen-containing groups was further determined by XPS. As shown in Fig. 2, the peaks in C1s spectrum corresponded to C
C/C–Hx/C–C (284.6 ± 0.2 eV), C–O (286.3 ± 0.3 eV), C
O (287.7 ± 0.2 eV) and O–C
O (288.1 ± 0.1 eV).26 The relative peak area percentages of the C1s XPS spectra are listed in the Table 1 of the ESI.† The intensity of C–O peak showed a decreasing trend, on the contrary, the intensity of O–C
O peak increased from 0 h to 22 h, due to oxidation of parts of hydroxyl group to carboxyl group during HTC. However, all the peak intensities of C–O, C
O and O–C
O groups were decreased noticeably after 26 h; moreover, the O–C
O group peak disappeared completely after the reaction for 34 h. These results suggested that a lot of oxygen-containing functional groups on the surface of hydrochar took part in the reaction. In other words, more and more hydrochar spheres were bonded together with time extension, which agreed well with the FT-IR results.
 |
| Fig. 1 FT-IR spectra for original and hydrochars at different reaction time. | |
 |
| Fig. 2 C1s XPS spectra of the corn stalk and hydrochar obtained at different reaction time. | |
Structural characteristics of the hydrochar
SEM analysis was used to evaluate the structural variations of hydrochar with time. Fig. 3 shows the SEM low resolution micrographs of hydrochars obtained from corn stalks at different reaction times. It could be clearly seen that the rough and fibrous texture of corn stalks was almost unchanged within 6 h (Fig. 3a). As reaction time increased up to 14 h, hydrochar microspheres were formed, and their density and mean diameter gradually increased with the extended reaction time (Fig. 3, 16–26 h). However, a number of hydrochar microspheres were adhered together and a heterogeneous distribution in terms of size could be observed when reaction time was 26 h or more (Fig. 3, 28–34 h). The hydrochar microspheres of 44 h were more aggregated and many of them were joined together compared to those of 26 h. The microspheres are mainly formed by degradation of the hemicellulose. The amorphous cellulose and some soluble segments of lignin were also homogenously hydrolyzed, and hydrolysis products subsequently recondensed to form microspheres when the reaction time was extended. TEM reconfirmed that the hydrochar had a spherical shape (Fig. 3, 26 h). Some complex interconnected network structures were also produced when the reaction time reached 26 h (Fig. 4, high resolution micrographs) because the original structure scaffold of non-dissolved cellulose and lignin was almost disrupted to form a continuous network structure. The network structures were irregular, and some of them were destroyed after 26 h (Fig. 4).
 |
| Fig. 3 SEM low resolution micrographs of hydrochars at different reaction times and TEM micrograph of hydrochar at 26 h. | |
 |
| Fig. 4 SEM high resolution micrographs of hydrochars at different reaction times. | |
The abovementioned results revealed that the hydrochars obtained at 200 °C were morphologically heterogeneous, and some of the hydrochar microspheres were on the surface of the corn stalks fiber with a heterogeneous size distribution. At the same time, some of the original structure scaffold of corn stalk were disrupted and formed the complex interconnected porous network structure. Thus, it takes 26 h for corn stalks to convert into microspheres and network structures at 200 °C.
 |
| Scheme 1 Schematic illustration of synthesizing hydrochar. | |
The proposed reaction mechanism
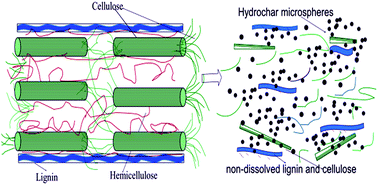
During hydrolysis reactions, water simultaneously acts as both the reactant and catalyst in the HTC process.41 Compared with ambient water, dielectric constant in hot pressurized water decreases with increasing temperature; this gives rise to increasing solubility and reaction rate of organic compounds. At the same time, the ionization constant of water increases with increasing temperature and is about three orders of magnitude higher than that of ambient water.42 In other words, much of H+ and OH− ions have been produced; therefore, H+ can act as a catalyst in corn stalks hydrolysis reactions, which leads to lower decomposition temperatures of biomass under hydrothermal conditions. Corn stalk contains cellulose, hemicellulose, lignin, extractives and ash in various concentrations (Scheme 1); the extractives and hemicellulose are susceptible to hydrolysis at temperatures as low as at 200 °C during HTC. The partial glycosidic bonds of cellulose are ruptured in the temperature range of 200–220 °C in acid media.38 Minowa et al. also found that cellulose begins to decompose to glucose/oligomer at 200 °C (short reaction time).43 At the same time, soluble lignin was fragmented and dissolved with increasing reaction time. Furfural, 5-HMF and phenolic derivatives were the characteristic products of hemicellulose, cellulose and lignin, respectively, which have been identified by GC-MS analysis through the ether phase products in the skin and pulp (from Table 1). In addition, ester, acid and other derivatives were also detected by GC-MS. The furfural compounds are prone to undergo condensation reactions accompanying by hydrolytic ring opening under acidic media,44 and small part of polymerization hydrochar microspheres were obtained via oligomerization/polymerization and/or condensation reactions of furfural derivatives on the surface of fiber through a water-soluble homogeneous reaction. Ibbett et al.45 studied hydrothermal reactions of straw biomass using thermal–analytical method. Their results indicated that exothermic degradation of hemicellulose initiates above 195 °C. The partial amorphous cellulose was cracked into smaller molecules, and one of the main characteristic degradation products of these molecules was 5-HMF, which formed hydrochar microspheres with similar procedure as furfural during HTC. The results are also confirmed by Sevilla.27 However, for the non-dissolved cellulose, the procedures of reaction resembled the pyrolytic process with intramolecular rearrangement, dehydration, and decarboxylation reactions to form an interconnected porous network structure. With an extended reaction time, some lignins were fragmented, dispersed and dissolved in the aqueous phase at 200 °C. Furthermore, since the dissolving process of lignin is diffusion controlled, longer reaction time can result in a better solubility of lignin, and the soluble lignin was homogenously hydrolyzed and decomposed to the phenolic derivatives,33 which re-polymerized with other water-soluble compounds to form hydrochar microspheres. Moreover, non-dissolved lignin also followed the same reaction procedure as non-dissolved cellulose. Thus, furfural, 5-HMF and phenolic derivatives were polymerized or condensed to microspheres (taken as polymerized hydrochar), and the size and number of the spheres gradually increase with increasing reaction time, which was well supported by the SEM and XPS analysis (from Fig. 2 and 3). In addition, the original framework structure of non-dissolved cellulose and lignin was almost completely disrupted and underwent a heterogeneous pyrolysis-like process and formed an interconnected porous network structure called polyaromatic char, which was confirmed by SEM (from Fig. 4). In brief, polymerized hydrochar formation was attributed to a series of reactions of ester, furfural, 5-HMF and phenolic derivatives in aqueous solution, and polyaromatic char was from non-dissolved cellulose and lignin (from Scheme 2).
 |
| Scheme 2 Possible reaction pathways to form hydrocarbon sphere. | |
Adsorption of Cr(VI)
Since hydrochar has relatively large amount of oxygen-containing surface functional groups, it should have a high affinity for metal ions.46 Therefore, the optimization and comparative studies on the removal of Cr(VI) have been conducted in an aqueous solution by using the as-prepared hydrochars, commercial activated carbon (AC), corn stalk and pyrolysis char from corn stalk (Table 3). In these samples, the HC-26 presents the maximum adsorption capacity, which is much higher than AC, although HC-26 exhibited lower specific surface area (12.04 m2 g−1) than AC (801.53 m2 g−1). The relative amount of oxygen containing functional groups reached the highest in 26 h, as observed by comparing the peak area of C1s XPS spectra peaks (Table 1 from ESI†). At the same time, Fig. 3 and 4 showed the hydrochar microspheres of 26 h are disperse and its network structures are regular, which provided a number of active binding sites for the adsorption of Cr(VI). Therefore, a high content of oxygen containing functional groups and a unique network of porous structures were in favor of the surface complexation between the protonated oxygen-containing groups and Cr(VI) anion at acidic condition. Batch adsorption experiments of HC-26 revealed that the adsorption equilibrium time was about 60 min and the optimum pH of the solution was of 1. The kinetic data can be well fitted to the pseudo-second-order kinetics model and the adsorption equilibrium data could be well explained by Langmuir model (see the ESI†). Moreover, adsorbed Cr(VI) were evenly distributed on the surface of hydrochar by scanning electron microscopy analysis (from Fig. 5), from which it is predicted that carbon hybrid materials could be prepared and metallic element uniformly dispersed on the surface of carbon.
Table 3 The adsorbing capacity of different type carbon adsorbent on the adsorption of Cr(VI)
Adsorbent type |
Removal% |
6 h |
61.25 |
18 h |
52.13 |
26 h |
67.26 |
28 h |
63.35 |
44 h |
65.32 |
Activated carbon |
31.22 |
Char |
39.24 |
Corn stalks |
24.10 |
 |
| Fig. 5 Scanning electron microscopy micrographs of hydrochars of 26 h (a) and distribution of Cr(VI) adsorbed (b). | |
Conclusions
By prolonging the reaction time up to 26 h, corn stalk could be converted into hydrochar by HTC at a low temperature of 200 °C. Reaction time had a significant effect on the composition of liquid products and the characteristics of hydrochars. Hemicellulose was completely dissolved and more amorphous phases of cellulose and lignin were fragmented and dissolved with increasing reaction time. Ester, furfural and phenolic derivatives in an aqueous solution underwent a series of reactions to form polymerized hydrochar, whereas non-dissolved cellulose and lignin underwent a heterogeneous pyrolysis-like process to form polyaromatic char. The yield, carbon content, ratio of O/C and H/C of the hydrochar and the pH of the liquid phase were almost invariable when the reaction time was more than 26 h; the diameter and quantity of the hydrochar microspheres were gradually increased within 26 h. Some hydrochar with complex interconnected network structures was produced. However, a number of hydrochar spheres were adhered together, and their network structures were also destroyed when the reaction time exceeds 26 h. Thus, the reaction time of 26 h was sufficient for producing microspheres and for network structure formation of hydrochar at a temperature of 200 °C. FT-IR and XPS show that a lot of oxygen-containing functional groups existed on the surface of hydrochar. Batch adsorption experiments suggested that the 26 h hydrochar exhibited the highest Cr(VI) adsorption capacity in an aqueous solution among the studied samples owning to its oxygen-containing functional groups and its unique porous network structures. The as-prepared hydrochar was an effective and green sustainable adsorbent for removal of Cr(VI) from aqueous solutions.
Acknowledgements
The authors are grateful for the financial aid from the Prairie Excellence Innovation and Entrepreneurial Team of Inner Mongolia (201201), the Program for the Development of Innovative Teams in Universities of Inner Mongolia (NMGIRT1105), the Program for Science and technology leading talent and innovation team of Inner Mongolia (20120101), and the natural science foundation of Inner Mongolia (2015MS0211).
References
- S. Chatterjee and T. Saito, ChemSusChem, 2015, 8, 3941 CrossRef CAS PubMed.
- M. M. Titirici, R. J. White, N. Brun, V. L. Budarin, D. S. Su, F. Monte, J. H. Clark and M. J. MacLachlan, Chem. Soc. Rev., 2015, 44, 250 RSC.
- S. De, A. M. Balu, J. C. Waal and R. Luque, ChemCatChem, 2015, 7, 1608 CrossRef CAS.
- J. Deng, M. Li and Y. Wang, Green Chem., 2016, 18, 4824 RSC.
- X. Li, M. F. Li, J. Bian, B. Wang, J. K. Xu and R. C. Sun, RSC Adv., 2015, 5, 77147 RSC.
- A. Pimchuai, A. Dutta and P. Basu, Energy Fuels, 2010, 24(9), 4638 CrossRef CAS.
- S. B. Saleh, B. B. Hansen, P. A. Jensen and K. D. Johansen, Energy Fuels, 2013, 27(12), 7541 CrossRef CAS.
- Q. V. Bach and Ø. Skreiberg, Renewable Sustainable Energy Rev., 2016, 54, 665 CrossRef CAS.
- J. A. Libra, K. S. Ro, C. Kammann, A. Funke, N. D. Berge, Y. Neubauer, M. M. Titirici, C. F. O. Bens, J. Kern and K. H. Emmerich, Biofuels, 2011, 2(1), 71 CrossRef CAS.
- Z. Liu and F. S. Zhang, J. Hazard. Mater., 2009, 167, 933 CrossRef CAS PubMed.
- J. L. Yin, M. S. Pei, Y. J. He, Y. K. Du, W. J. Guo and L. Y. Wang, RSC Adv., 2015, 5, 89839 RSC.
- M. E. Fernandez, B. Ledesma, S. Roman, P. R. Bonelli and A. L. Cukierman, Bioresour. Technol., 2015, 183, 221 CrossRef CAS PubMed.
- X. Wang, C. Hu, Y. Xiong, H. Liu, G. Du and X. He, J. Power Sources, 2011, 196, 1904 CrossRef CAS.
- P. Makowski, R. D. Cakan, M. Antonietti, F. Goettmann and M. M. Titirici, Chem. Commun., 2008, 999 RSC.
- G. K. Parshetti, Z. G. Liu, A. Jain, M. P. Srinivasan and R. Balasubramanian, Fuel, 2013, 111, 201 CrossRef CAS.
- C. H. Zhou, X. Xia, C. X. Lin, D. S. Tong and J. Beltramini, Chem. Soc. Rev., 2011, 40, 5588 RSC.
- N. Eibisch, R. Schroll, R. Fu, R. Mikutta, M. Helfrich and H. Flessa, Chemosphere, 2015, 119, 155 CrossRef CAS PubMed.
- A. Funke and F. Ziegler, Biofuels, Bioprod. Biorefin., 2010, 4, 2160 Search PubMed.
- A. Jain, R. Balasubramanian and M. P. Srinivasan, Chem. Eng. J., 2016, 283, 789 CrossRef CAS.
- H. S. Kambo and A. Dutta, Renewable Sustainable Energy Rev., 2015, 45, 359 CrossRef CAS.
- M. M. Titirici, A. Thomas, S. H. Yu, J. O. Müller and M. Antonietti, Chem. Mater., 2007, 19, 4205 CrossRef CAS.
- M. M. Titirici, M. Antonietti and N. Baccile, Green Chem., 2008, 10, 1204 RSC.
- C. Falco, N. Baccileb and M. M. Titirici, Green Chem., 2011, 13(11), 3273 RSC.
- C. Falco, F. P. Caballero, F. Babonneau, C. Gervais, G. Laurent, M. M. Titirici and N. Baccile, Langmuir, 2011, 27, 14460 CrossRef CAS PubMed.
- N. Baccile, G. Laurent, F. Babonneau, F. Fayon, M. M. Titirici and M. Antonietti, J. Phys. Chem. C, 2009, 113, 9644 CAS.
- M. Sevilla and A. B. Fuertes, Chem.–Eur. J., 2009, 15, 4195 CrossRef CAS PubMed.
- M. Sevilla and A. B. Fuertes, Carbon, 2009, 47, 2281–2289 CrossRef CAS.
- A. Funke and F. Ziegler, Biofuels, Bioprod. Biorefin., 2010, 4, 160 CrossRef CAS.
- X. W. Lu, P. J. Pellechia, J. R. V. Flora and N. D. Berge, Bioresour. Technol., 2013, 138, 180 CrossRef CAS PubMed.
- Y. Gao, X. H. Wang, J. Wang, X. P. Li, J. J. Cheng, H. P. Yang and H. P. Chen, Energy, 2013, 58, 376 CrossRef CAS.
- S. M. Kang, X. L. Li, J. Fan and J. Chang, Ind. Eng. Chem. Res., 2012, 51, 9023 CrossRef CAS.
- G. Luo, P. J. Strong, H. L. Wang, W. Z. Ni and W. Y. Shi, Bioresour. Technol., 2011, 102, 6990 CrossRef CAS PubMed.
- R. Hashaikeh, Z. Fang, I. S. Butler, J. Hawari and J. A. Kozinski, Fuel, 2007, 86, 1614 CrossRef CAS.
- A. B. Fuertes, M. C. Arbestain, M. Sevilla, J. A. Maciá-Agulló, S. Fiol, R. López, R. J. Smernik, W. P. Aitkenhead, F. Arce and F. Macias, Aust. J. Soil Res., 2010, 48, 618 CrossRef CAS.
- L. P. Xiao, Z. J. Shi, F. Xu and R. C. Sun, Bioresour. Technol., 2012, 118, 619 CrossRef CAS PubMed.
- S. Q. Guo, X. Y. Dong, T. T. Wu, F. J. Shi, and C. X. Zhu, DOI:10.1016/j.jaap, 2015, 10, 15.
- S. Kumar, U. Kothari, L. Z. Kong, Y. Y. Lee and R. B. Gupt, Biomass Bioenergy, 2011, 35, 956 CrossRef CAS.
- F. Behrendt, Y. Neubauer, M. Oevermann, B. Wilmes and N. Zobel, Chem. Eng. Technol., 2008, 31(5), 667 CrossRef CAS.
- S. Karagöz, T. Bhaskar, A. Muto, Y. Sakata, T. Oshiki and T. Kishimoto, Chem. Eng. J., 2005, 108, 127 CrossRef.
- D. W. van Krevelen, Coal: Typology-physics-Chemistry-Constitution, Elsevier, Amsterdam, 1983, ch. 6 Search PubMed.
- S. S. Toor, L. Rosendahl and A. Rudolf, Energy, 2011, 36(5), 2328 CrossRef CAS.
- G. Brunner, J. Supercrit. Fluids, 2009, 47, 373 CrossRef CAS.
- T. Minowa, Z. Fang and T. Ogi, J. Supercrit. Fluids, 1998, 13, 1253 CrossRef.
- R. Mariscal, P. Maireles-Torres, M. Ojeda, I. Sádabaa and M. López Granados, Energy Environ. Sci., 2016, 9, 1144 CAS.
- R. Ibbett, S. Gaddipati, S. Davies, S. Hill and G. Tucker, Bioresour. Technol., 2011, 6, 44 Search PubMed.
- M. Owlad, M. K. Aroua, W. A. W. Daud and S. Baroutian, Water, Air, Soil Pollut., 2009, 200, 59 CrossRef CAS.
Footnote |
† Electronic supplementary information (ESI) available: Effect of initial pH, contact time on adsorption of Cr(VI) by hydrochar, Langmuir isotherm and second-order plot for adsorption of Cr(VI). See DOI: 10.1039/c6ra21607b |
|
This journal is © The Royal Society of Chemistry 2016 |
Click here to see how this site uses Cookies. View our privacy policy here.