Structural and optical properties of sol–gel derived Cr-doped ZnO diluted magnetic semiconductor nanocrystals: an EXAFS study to relate the local structure

Shiv Kumarac, N. Tiwarib, S. N. Jhab, S. Chatterjeec, D. Bhattacharyyab and Anup K. Ghosh*a
aMaterials Research Laboratory, Department of Physics, Banaras Hindu University, Varanasi-21 005, India. E-mail: akghosh@bhu.ac.in; anupkg66@gmail.com
bAtomic & Molecular Physics Division, Bhabha Atomic Research Centre, Mumbai-400 085, India
cDepartment of Physics, Indian Institute of Technology, Banaras Hindu University, Varanasi-221 005, India

Received 16th June 2016 , Accepted 4th November 2016

First published on 4th November 2016


Abstract

Structural, local structural and optical properties of sol–gel derived Zn1−xCrxO (0 ≤ x ≤ 0.06) nanoparticles have been thoroughly studied by several complementary techniques. The crystallite structure, size, and lattice strain have been estimated by X-ray diffraction (XRD) with Rietveld refinement and high-resolution transmission electron microscopy (HRTEM). No significant change in lattice parameters a and c has been observed upon Cr doping, though crystallite size and tensile strain in the crystals change. Extended X-ray absorption fine structure (EXAFS) measurement shows that Cr doping creates oxygen vacancies without causing any significant change in the host lattice structure. X-ray absorption near edge structure (XANES) measurements rule out the presence of metallic Cr clusters in the samples. Raman spectroscopy has been employed to study the crystalline quality, structural disorder, and defects in the host lattice. XANES and FTIR results show that the local structure around Cr becomes increasingly octahedral with an increase in Cr doping concentration. UV-vis measurements have been used to study the effect of Cr-doping on absorption spectra and hence on the band gaps of the samples. The band gap initially increases for low Cr-concentration and then decreases with higher Cr-concentration. The PL spectra show many emissions including green emission, which is attributed to singly ionized oxygen vacancies, increases with an increase in Cr doping concentration in the samples.

1. Introduction

Ferromagnetic ordering at room temperature in diluted magnetic semiconductors (DMSs)1 has recently attracted lots of attention due to their promising applications in the emerging field of spintronic devices.2–5 Although, a few devices based on giant magneto-resistance (GMR) of ferromagnetic/non-magnetic/ferromagnetic type hetero-structures have been successfully realized, a phenomenal success of spintronics is still awaiting the development of the DMS. In a DMS material, ferromagnetic ordering above room temperature is achieved by doping the semiconductor with a very small quantity of 3d transition metal (TM) so that both charge as well as the spin of the electrons can be utilized for device applications. Moreover, doping of wide-gap semiconductors with transition metal (TM) elements such as Mn, Fe, Co, Cr, etc. offers a viable means of tuning both optical1,6–8 and magnetic properties of these materials.9–12 Again, the ability of tailoring the physical properties of nanocrystals (NCs) simply by changing their size and surface functionality renders NCs an attractive building block for functional devices. Hence, DMS NCs have received much attention because they could potentially be used as building blocks for fabricating 3D architecture of novel spintronic microchips. Since, the principal requirement in realizing spintronic devices is materials with ferromagnetism at room temperature (RTFM),2–5 much efforts have been invested to prepare TM-doped wide band gap DMS nanostructures that exhibit ferromagnetic ordering at or above room temperature, high charge carrier concentration and mobility for spin-based applications.13–17

Zinc oxide (ZnO) is an optically transparent II–VI semiconductor with hexagonal wurtzite structure of C46v (P63mc) space group. It has wide direct band gap of ∼3.37 eV, excitons binding energy of ∼60 meV and has been identified as a promising host material after theoretical predictions of ferromagnetism above room temperature in it upon doping by various transition metals (TM).18,19 Among the TMs, Cr is particularly attractive and has been chosen as the preferred TM dopant by several research groups because of (1) theoretical research by Sato et al.19 on Cr-based ferromagnetic ordering; (2) Cr3+ and Zn2+ have close values of ionic radii, which means Cr3+ can be easily incorporated into the ZnO crystal lattice; (3) among the impurity phases in ZnO[thin space (1/6-em)]:[thin space (1/6-em)]Cr system, Cr metal, Cr2O3, Cr3O4 and ZnCr2O4 are anti-ferromagnetic, thus eliminating any role of Cr precipitates in getting spurious FM and (4) the only ferromagnetic oxide of Cr, CrO2 which has a Curie temperature (TC) of 386 K, is not a stable phase under normal conditions and is easy to be oxidized into Cr2O3 when heated at atmospheric pressure. However, compared to the widely studied Fe, Co and Mn-doped ZnO systems, both theoretical and experimental researches on Cr-doped ZnO are relatively less.20–28 Moreover, quite contradictory experimental results on Cr doped ZnO are available in the literature which have created doubts regarding the origin of ferromagnetism in these materials. For example, Venkatesan et al.23 and Ueda et al.24 have not observed any signature of FM in Cr doped ZnO samples, where as Liu et al.25 showed that Cr-doped ZnO films are ferromagnetic at room temperature. While nanoparticles prepared by sol–gel route are found to be ferromagnetic at room temperature with magnetic moment decreasing with increase in Cr doping concentration from 1–5%.26 Cr doped ZnO nanoparticles grown by chemical vapour synthesis technique, shows ferromagnetic ordering only at higher Cr doping concentration.27,28

The doping concentrations in DMSs are usually well below the percolation limit so that ferromagnetic ordering in doped ZnO cannot be explained in the framework of double-exchange or super-exchange mechanisms29 and oxygen vacancies are found to play an important role in defining the magnetic properties of these materials.12,30 Thus structural properties of these TM doped nanocrystals along with the oxidation state of the TM ions are needed to be investigated thoroughly to have an insight into their magnetic behavior. Moreover, although magnetism in Cr-doped ZnO nanoparticles is an interesting and controversial issue to be solved, tailoring of the optical band gap also has immense importance for device applications. In this paper we concentrate on investigating the structural, local-structural and optical properties of Cr-doped ZnO (i.e. Zn1−xCrxO) nanocrystals to get a clear understanding of the behavior of the Cr dopants in ZnO nanoparticles.

2. Experimental details

Zn1−xCrxO (0 ≤ x ≤ 0.06) samples (named as Cr0, Cr0.5, Cr1, Cr2, Cr4 and Cr6 for Cr-concentration x = 0, 0.005, 0.01, 0.02, 0.04 and 0.06 respectively) have been synthesized by the sol–gel method. Appropriate proportions of analytical grade metal nitrate Zn(NO3)2·6H2O (99.9% purity) and Cr(NO3)2·4H2O (99.9% purity) powders were thoroughly mixed and dissolved in aqueous solution of citric acid [C6H8O7] (99.5% purity) while stirring to obtain a homogeneous precursor solution. Citric acid serves as fuel for the reaction. The precursor solution was dried at 80 °C for 3 h to obtain xerogel and the swelled xerogel was kept at 130 °C for 12 h to complete it. The simplified exothermic reaction can be expressed as:
M(NO3)2 + C6H8O7 + 4O2 → MO + 2NO2 + 6CO2 + 4H2O; (M = Zn, Cr).

After grinding, the xerogel powders were sintered at 600 °C for 10 h in air ambient to get Zn1−xCrxO nanoparticles. Structural characterization of Zn1−xCrxO samples was performed by X-ray diffractometer (Model: Miniflex-II, Rigaku, Japan) with CuKα radiation (λ = 1.5406 Å). Synchrotron based Extended X-ray Absorption Fine Structure (EXAFS) measurements of these samples have been carried out both at Zn and Cr K-edges at the Scanning EXAFS Beamline (BL-9) at the INDUS-2 Synchrotron Source (2.5 GeV, 200 mA) at the Raja Ramanna Centre for Advanced Technology (RRCAT), Indore, India.31 The beamline uses a double crystal monochromator (DCM) which works in the photon energy range of 4–25 keV with a resolution of 104 at 10 keV. A 1.5 m horizontal pre-mirror with meridonial cylindrical curvature is used prior to the DCM for collimation of the beam and higher harmonic rejection. The second crystal of the DCM is a saggital cylinder with radius of curvature in the range 1.28–12.91 meters which provides horizontal focusing to the beam while another Rh/Pt coated bendable post mirror facing down is used for vertical focusing of the beam at the sample position. For the present set of samples, measurements at Zn K-edge have been carried out in transmission mode while measurements at the dopant Cr K-edge have been carried out in fluorescence mode. For measurements in the transmission mode, the sample is placed between two ionization chamber detectors. The first ionization chamber measures the incident flux (I0) and the second ionization chamber measures the transmitted intensity (It). From these intensities the absorbance of the sample is found as a function of energy. To obtain a reasonable edge jump, appropriate weights of the powdered sample has been mixed thoroughly with cellulose powder to get a total weight of approximately 150 mg so that 2.5 mm thick homogenous pellets of 12.5 mm diameter were made. The EXAFS spectra of the undoped and Cr-doped samples at Zn K-edge were recorded in the energy range of 9550–10[thin space (1/6-em)]100 eV. For measurements in the fluorescence mode, the sample is placed at 45° to the incident X-ray beam and the fluorescence signal (If) is detected using a Si drift detector placed at 90° to the incident X-ray beam. An ionization chamber detector is used prior to the sample to measure the incident X-ray flux (I0) and the absorbance of the sample image file: c6ra15685a-t1.tif is obtained as a function of energy by scanning the monochromator over the specified energy range. The EXAFS spectra of the samples at Cr K-edge were recorded in the energy range of 5984–6635 eV.

TEM and HRTEM measurements were done with Technai G2 S-Twin (FEI, Netherlands). Fourier transmission infrared (FT-IR) spectra of the samples (as pellets in KBr) were recorded using FT-IR Spectrometer (Spectrum One, Perkin Elmer Instrument, USA) in the range of 4000–400 cm−1 with a resolution of 1 cm−1. Raman spectra were taken with a Reinshaw micro-Raman spectroscope using 514.5 nm Ar+ laser as excitation source in the range of 200–1250 cm−1. The powder samples were made into pellets for the Raman measurement. The optical absorption spectra were measured in the range of 300–800 nm using UV-vis spectrometer (Perkin Elmer Instrument, Lamda-25, USA). The photoluminescence (PL) spectra were taken by a Fluorescence Spectrometer (LS-45, Perkin Elmer, USA).

3. Results and discussion

3.1 Structure and composition

3.1.1 X-ray diffraction. Rietveld refinements of the X-ray diffraction (XRD) patterns for Zn1−xCrxO (0 ≤ x ≤ 0.06) samples are shown in Fig. 1. All peak positions of Cr-doped ZnO samples corresponding to the standard Bragg positions of hexagonal wurtzite ZnO (space group P63mc) have been shown by the vertical bars and the residue by the line respectively at the bottom of the XRD patterns. The XRD patterns show that Cr-doping does not lead to the appearance of any extra peak or disappearance of any peak of the hexagonal wurtzite structure of pure ZnO, confirming that structure of the doped ZnO remains wurtzite and belongs to the space group P63mc. Rietveld analysis tells that the samples are single phase and no trace of other impurities has been found. It should be pointed out that the impurities can be detected by XRD only when they form crystalline phases. Hence there is no crystalline impurity within the detection limit of X-rays.
image file: c6ra15685a-f1.tif
Fig. 1 Rietveld refinement profiles of X-ray diffraction data of the Zn1−xCrxO (0 ≤ x ≤ 0.06) samples. The circle represents the observed data (Obs) while solid line through the circles is the calculated profile (Calc), vertical tics below curves represent allowed Bragg-reflections for the wurtzite phase. The difference pattern of the observed data and calculated profile (Obs − Calc) is given below the vertical tics.

All the XRD peaks have been indexed using the standard JCPDS file for ZnO (JCPDS #36–1451). Therefore, we believe that the maximum doping concentration (i.e. x = 0.06) is well below the maximum solid solubility of Cr ions in ZnO lattice. The secondary phase of ZnCr2O4 emerges at x = 0.08, which indicates that the doping limit of Cr in ZnO is below 8%. The existence of secondary phase of ZnCr2O4 with 8% Cr doped ZnO has also reported in the literature.25

The lattice parameters (a and c) have been calculated from Rietveld refinement of the X-ray diffraction data and the volume of the unit cell for a hexagonal system has been calculated from the following equation:32

 
V = 0.866 × a2 × c (1)

The lattice parameters (a and c) measured from Rietveld refinement are plotted in Fig. 2 with the variation of Cr-concentration (x). The value of lattice parameters (a and c), bond lengths and bond angles calculated from Rietveld refinement for different Cr-concentration are shown in Table 1. Volumes of the unit cells calculated by using eqn (1) are shown in the inset of Fig. 2. From Fig. 2, it is seen that there is no appreciable change in the lattice parameters a, c and volume of the unit cell (V) due to an increase in Cr-ion doping. However, a closer observation shows that the lattice parameter a decreases very slowly with Cr-concentration which can be explained on the basis of the difference in ionic radii of Zn and Cr. On the other hand, the lattice parameters c increases slowly with Cr-doping which can't be explained on the basis of the difference in ionic radii. Some other effect (for example lattice distortion)12 may be associated which will be studied further elsewhere.


image file: c6ra15685a-f2.tif
Fig. 2 Variation of lattice parameter (a and ‘c’) with Cr-concentration (x) calculated from Rietveld refinement. The inset plot shows the variation of the unit cell volume.
Table 1 Values of lattice parameters, bond lengths and bond angles calculated from Rietveld refinement
Parameters Cr 0 Cr 0.5 Cr 1 Cr 1.5 Cr 2 Cr 4 Cr 6
a (Å) 3.24564 3.24617 3.24618 3.24592 3.24610 3.24497 3.24617
c (Å) 5.19985 5.2008 5.20127 5.20129 5.20127 5.19966 5.20178
c/a 1.60210 1.60213 1.60227 1.60240 1.60231 1.60237 1.60243
dZn–Oa (Å) 1.97521 1.97558 1.97600 1.97554 1.97561 1.97494 1.97570
dZn–Ob (Å) 1.97526 1.97559 1.97565 1.97555 1.97562 1.97495 1.97571
Angle (Oa–Zn–Ob) (°) 108.43732 108.43761 108.44340 108.44766 108.44383 108.44591 108.44798
Angle (Ob–Zn–Ob) (°) 110.48503 110.48476 110.47918 110.47509 110.47876 110.47678 110.47479


The average crystallite size, D, of the samples are estimated using the Scherrer's equation:33,34

 
image file: c6ra15685a-t2.tif(2)
where, λ the wavelength of radiation used (λ = 1.5406 Å), θ the Bragg angle and β is the full width at half maxima (FWHM). The average crystallite size (D) decreases linearly with the increase of Cr doping concentration which can be attributed to the presence of Cr ion in ZnO lattice. The presence of Cr ion in ZnO lattice prevents the growth of the crystal grains and slows down the motion of grain boundaries. The promoting effect on the chemical reaction between Cr dopant atoms and ZnO restricts the mobility of the grain boundaries.17 This can also be explained by Zener pinning.35,36

A better estimation of the crystallite size has been achieved from ‘size–strain plot’ (SSP)37 by using the following equation:

 
image file: c6ra15685a-t3.tif(3)
where, dhkl is the inter-planar spacing and ε is the average strain produced in the lattice. β, λ and D are described as earlier, k is the Scherrer's constant (=0.9).

The plot of (dhklβ[thin space (1/6-em)]cos[thin space (1/6-em)]θ/λ)2 vs. (dhkl2β[thin space (1/6-em)]cos[thin space (1/6-em)]θ/λ2) is shown in Fig. 3. The crystallite size (D) and average strain (ε) have been estimated from the slope and the intercept of the linear fit of the plot respectively. Fig. 4 shows the variation of crystallite size and lattice strain (ε) (inset of Fig. 4) with the Cr-concentration (x) estimated from size–strain plot and from Scherrer's equation. The average crystallite size decreases linearly with the increase in Cr-concentration.


image file: c6ra15685a-f3.tif
Fig. 3 (dhklβ[thin space (1/6-em)]cos[thin space (1/6-em)]θ/λ)2 vs. (dhkl2β[thin space (1/6-em)]cos[thin space (1/6-em)]θ/λ2) plot of the samples to estimate crystallite size(D) and average strain (ε).

image file: c6ra15685a-f4.tif
Fig. 4 Variation of average crystallite size with Cr-concentration (x) estimated from size–strain plot and Scherrer's equation. Inset shows variation of the strain (ε) with the Cr-concentration (x).
3.1.2 Transmission electron microscopy. The morphology and the microstructure of the nanoparticles have been examined by transmission electron microscopy (TEM). A typical TEM image of several nanoparticles of the sample Cr1 (i.e. Zn0.99Cr0.01O) is presented in Fig. 5. As can be seen from Fig. 5(a), the nanoparticles tend to coalesce into aggregate which is a very common phenomenon in magnetic nanoparticles. Closer look of TEM images of different parts of the sample shows that nanoparticles are more or less spherical in shape and smooth in surface. The TEM-micrograph (Fig. 5) shows that the samples are indeed nano-grained and contain, therefore, a large amount of grain boundaries and free surfaces which should affect their physical properties as observed by Straumal et al.38,39 The average particle size obtained from TEM measurements matches well with the size estimated from the XRD study. Fig. 5(b) represents the selected area electron diffraction (SAED) patterns of different planes. High-resolution TEM (HRTEM) image gives insight into the detailed atomic structure of the nanoparticles. Fig. 5(c) and (d) show the HRTEM image of a single particle of the Cr1 sample. The HRTEM micrographs of Fig. 5(c) and (d) show that the inter-planar spacing (d-value) of fringes are 0.281 nm and 0.264 nm which is in good agreement with the d-value of (100) and (002) planes (viz. 0.280 nm and 0.259 nm of wurtzite ZnO) respectively. Moreover, it should be pointed out here that the d-values of the Cr-doped samples (e.g. Cr1) determined from TEM measurements are found to be higher than that of undoped ZnO, which signifies the presence of tensile strain in the Cr doped samples as observed from XRD measurements also. HRTEM measurement thus indicates that all the nanoparticles are single crystalline in nature and are free from major lattice defects. According to the results of XRD pattern and HRTEM images, it can be concluded that the Cr-ions are well incorporated into the crystal lattice of ZnO.
image file: c6ra15685a-f5.tif
Fig. 5 Low magnification TEM (a) SAED (b) and HRTEM (c and d), images of Zn0.99Cr0.01O nanocrystals.
3.1.3 EXAFS measurements. Fig. S1 and S2 in the ESI represent the experimental EXAFS (μ(E) versus E) spectra of undoped and Cr doped ZnO samples measured at Zn K-edge and for Cr doped samples at Cr K-edge respectively. In order to take care of the oscillations in the absorption spectra, the energy dependent absorption coefficient μ(E) has been converted in to absorption function χ(E) defined as follows:40
 
image file: c6ra15685a-t4.tif(4)
where E0 is the absorption edge energy, μ0(E0) is the bare atom background and Δμ0(E0) is the step in the μ(E0) value at the absorption edge. After converting the energy scale to the photoelectron wave number scale (k) as defined by,
 
image file: c6ra15685a-t5.tif(5)
the energy dependent absorption coefficient χ(E) has been converted to the wave number dependent absorption coefficient χ(k), where m is the electron mass. Finally, χ(k) is weighted by k2 to amplify the oscillation at high k and the k2χ(k) functions are Fourier transformed in R space to generate the χ(R) versus R plots (or FT-EXAFS spectra) in terms of the real distances from the center of the absorbing atom. It should be mentioned here that a set of EXAFS data analysis program available within the IFEFFIT software package has been used for reduction and fitting of the experimental EXAFS data.41 This includes data reduction and Fourier transform to derive the χ(R) versus R plots from the absorption spectra (using ATHENA software), generation of the theoretical EXAFS spectra starting from an assumed crystallographic structure and finally fitting of the experimental data with the theoretical plots using the FEFF 6.0 code (using ARTEMIS software). Fig. 6 shows the k2χ(k) vs. k plots, while Fig. 7 shows the corresponding Fourier transformed EXAFS (FT-EXAFS) spectra or χ(R) versus R plots of undoped and Cr doped ZnO samples measured at the Zn K-edge along with the best fit theoretical curves. FT-EXAFS spectra of all the samples consist of two major peaks, the first major peak in the radial distribution function corresponds to the nearest oxygen shell and second peak corresponds to the next nearest Zn/Cr shell respectively surrounding the central Zn atom. The theoretical FT-EXAFS spectra have been generated assuming the wurtzite ZnO structure having the first oxygen shell with (Zn–O1) bond length of 1.97 Å and coordination number (CN) of 4 and two combined closely spaced Zn shells between 3.20 Å and 3.25 Å having total nominal Zn coordination of 12. The data have been fitted up to 3.5 Å in R-space. The bond distances, coordination numbers (CN) and disorder (Debye–Waller) factors (σ2), which give the mean-square fluctuations in the distances, have been used as fitting parameters. The goodness of fit has been determined by the value of the Rfactor defined by:
 
image file: c6ra15685a-t6.tif(6)
where χdat and χth refer to the experimental and theoretical χ(R) values respectively and Im and Re refer to the imaginary and real parts of the respective quantities. The best fit parameters have been shown in Table S1 of the ESI. It should be noted that the fitting have been carried out in R space while the results have been shown in both k and R space in Fig. 6 and 7 respectively.

image file: c6ra15685a-f6.tif
Fig. 6 The experimental k2χ(k) vs. k plots and the theoretical fits for undoped and Cr doped ZnO samples measured at Zn K-edge.

image file: c6ra15685a-f7.tif
Fig. 7 The experimental χ(R) versus R plots and the theoretical fits of undoped and Cr-doped ZnO samples measured at Zn K-edge.

The main findings of the Zn K-edge EXAFS analysis are as follows: (i) it has been observed that Zn–O bond length for the first coordination shell and Zn–Zn distance of the second coordination shell of the doped samples agree with that of the undoped ZnO. This indicates that Cr is replacing Zn2+ as Cr3+ since ionic radii of Zn2+ (0.60 Å) and Cr3+ (0.61 Å) are almost similar while that of Cr2+ is significantly higher.42 The above result will subsequently be supported by Cr K-edge EXAFS measurements as described below. (ii) More and more oxygen vacancies are created in the 1st shell with increase in Cr doping concentration and Zn coordination of the 2nd shell is also found to be less than the bulk value of 12. The decrease in oxygen coordination at Zn sites at higher Cr concentration might be due to the fact that Cr3+ preferably takes octahedral coordination instead of tetrahedral coordination of Zn2+ in ZnO, depleting the Zn sites of oxygen. This will be more evident from Cr K-edge XANES data discussed later. Creation of large amount of oxygen vacancies due to doping have been observed by us in case of other doped ZnO systems also.43–45 The lower Zn coordination in the 2nd coordination shell compared to bulk value can be attributed lower particle size of these nanocrystalline samples. Similar decrease in Zn–Zn coordination due to small particle size in nanocrystalline ZnO samples had been observed by us and other workers earlier.43,46

To fit the experimental FT-EXAFS data at the Cr K-edge two possibilities were explored (a) starting with basic wurtzite ZnO structure and replacing Zn by Cr as per the concentration and (b) by assuming Cr2O3 structure. Similar approach has been followed earlier in case of fitting of EXAFS data for Mn and Co doped ZnO nanocrystals also.43,47 In the first formalism, we have replaced Zn atoms with Cr atoms while supplying inputs for ZnO structure in the ATOMS subroutine of IFEFFIT software package. However, in the structure generated at the output of ATOMS subroutine, the neighbouring Cr atoms (leaving the central Cr atom) were replaced by Zn atoms again with suitable potentials since it is very unlikely that in the dilute doping regime two TM atoms would come close by. Subsequently scattering paths were generated by running the FEFF subroutine which have finally been used for fitting. For the second case, structural parameters of Cr2O3 have been taken from ICSD database48 and the data have been fitted assuming the first oxygen shell (Cr–O) at 1.97 Å with coordination number (CN) of 6, second Cr shell (Cr–Cr) at 2.58 Å having CN of 2 and third Cr shell (Cr–Cr) at 2.88 Å with coordination 2. Fig. 8 and 9 represent the Fourier transformed EXAFS (FT-EXAFS spectra) or χ(R) versus R plots of Cr doped ZnO samples at the Cr K-edge along with the best fit theoretical plots obtained with both the possible structures and the corresponding best fit parameters have been shown in Tables S2 and S3 of the ESI. The salient features of the Cr K-edge EXAFS analysis is summarized in the following:


image file: c6ra15685a-f8.tif
Fig. 8 The experimental χ(R) versus R plots and the theoretical fits of Cr doped ZnO samples measured at Cr K-edge where the fitting is done assuming ZnO structure with Cr at Zn sites.

image file: c6ra15685a-f9.tif
Fig. 9 The experimental χ(R) versus R plots and the theoretical fits of Cr doped ZnO samples measured at Cr K-edge where fitting has been done assuming Cr2O3 structure.

It should be noted here that for fitting with the first approach, viz., assuming Cr in tetrahedral ZnO structure, we have combined the contributions of both the Cr–Zn shells at distances of 3.20 Å and 3.25 Å of 6 co-ordinations each as a single shell at an average distance of 3.23 Å and with a total coordination of 12. However, it has been observed that that Cr–Zn distance and coordination numbers obtained by fitting are much lower than that expected for ZnO structure. However, the parameters obtained by the later approach viz., assuming Cr2O3 structure yields more reasonable results and it supports our earlier conclusion from Zn K-edge EXAFS data that Cr is going to the lattice as Cr3+. Fig. 10 shows k2χ(k) vs. k plots with theoretical fit for the Cr doped ZnO samples fitted with the Cr2O3 model.


image file: c6ra15685a-f10.tif
Fig. 10 The experimental k2χ(k) vs. k plots for Cr doped ZnO samples at Cr K-edge along with theoretical fit carried out assuming Cr2O3 structure.

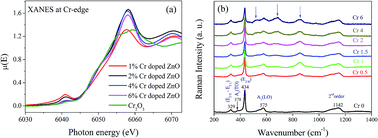
Fig. 11 shows the normalized XANES spectra of the samples measured at Cr K-edge which manifests that the Cr K-edge positions in the samples match with that of Cr2O3 standard showing presence of Cr3+ in the samples. This clearly rules out the presence of any metallic Cr phase in the samples ensuring proper doping of Cr in ZnO lattice. Furthermore, the Cr K-edge XANES spectra are found to be characterized by the presence of a pre-edge peak at ∼8041 eV, which is a characteristic of tetrahedral coordination of ZnO lattice. However, it is found that the intensity of the pre-edge peak decreases as Cr concentration in the samples increases. Since pre-edge peaks do not exist in case of pure octahedral coordination, the above observation suggests that Cr is preferentially having octahedral coordination over tetrahedral coordination as Cr concentration increases in the samples. This leads to creation of oxygen vacancies at Zn sites which has also been found from Zn K-edge EXAFS measurements. A similar observation on the increase in octahedral coordination at Cr sites with increase in Cr doping concentration has also been made by FTIR measurement and PL studies also corroborate the increase in oxygen vacancies in the samples as described later. It should be noted that several other authors have also reported the presence of Cr in Cr3+ valence state and in a mixed environment of tetrahedral and octahedral coordination in Cr doped ZnO nanocrystals prepared by different techniques.26,49,50


image file: c6ra15685a-f11.tif
Fig. 11 XANES spectrum of Cr-doped ZnO nanocrystals measured at Cr K-edge.
3.1.4 Raman spectroscopy. Raman spectroscopy is one of the very sensitive and important techniques to detect local structural changes due to incorporation of TM-ions into the ZnO host lattice.51 Wurtzite ZnO (number of atoms per unit cell is 4) belongs to the C46v symmetry group having total number of 12 phonon modes namely, one longitudinal-acoustic (LA), two transverse-acoustic (TA), three longitudinal–optical (LO), and four transverse–optical (TO) branches. At the Γ point of the Brillouin zone, optical phonons have the irreducible representation52 as: Γopt = A1 + 2B1 + E1 + 2E2, where both A1 and E1 modes are polar and can be split into transverse optical (TO) and longitudinal optical (LO) phonons, with all being Raman and infrared active. Non-polar E2 modes are Raman active, while B1 modes are Raman inactive. For the lattice vibrations with A1 and E1 symmetries, the atoms move parallel and perpendicular to the c-axis, respectively. The vibration of heavy Zn sublattice gives rise to the low-frequency E2 mode while that of oxygen sublattice gives rise to high-frequency E2 mode.53 Modes E1 (TO) and A1 (TO) reflect the strength of the polar lattice bonds.54 According to the selection rule, generally E2 and A1 (LO) modes can only be observed in the unpolarized Raman spectra of bulk ZnO under backscattering geometry. However, when the crystal is reduced to nanometer size, the selection rule with k = 0 for the first-order Raman scattering is relaxed and phonon scattering is not being limited to the center of Brillouin zone.52 In these cases, the phonon dispersion around the zone center should also be considered. Therefore, not only the first-order vibration modes should appear with shift and broadening but also some vibration modes will exist in the symmetry-forbidden geometries. As a result, the wurtzite ZnO nanoparticles have six Raman-active phonon modes at 101 cm−1 (E2 low), 381 cm−1 (A1 TO), 407 cm−1 (E1 TO), 437 cm−1 (E2 high viz. E2H), 574 cm−1 (A1 LO), and 583 cm−1 (E1 LO) respectively.55,56 Fig. 12 represents the room-temperature normalized Raman spectra of Zn1−xCrxO (0 ≤ x ≤ 0.06) nanocrystals. It should be pointed out here that the Raman spectra are normalized by min/max method [using the relation: Inom = (IImin)/Imax, where, I is unnormalized intensity]. The assignments of the Raman modes of ZnO and Zn1−xCrxO nanoparticles obtained for different Cr-concentration (x) are summarized in Table S4 of the ESI and the salient features are summarized as follows:
image file: c6ra15685a-f12.tif
Fig. 12 Room-temperature Raman spectra of Zn1−xCrxO (0 ≤ x ≤ 0.06) respectively.

It has been observed that all the prominent Raman peaks of ZnO are also observed in Cr-doped nanocrystals, but as Cr-content increases, some of the Raman modes become relatively less intense without appreciable shift in frequencies. Decrease in the peak intensity may be related to crystal size effects and/or increase of the structural disorder (as stated latter). The sharpest and strongest peak at about 434 cm−1 can be attributed to the non-polar high-frequency optical phonon branch of E2 mode (E2H), which involves the motion of oxygen and is the characteristic of wurtzite structure. With increasing Cr-concentration pronounced weakening in peak height of this nonpolar E2H mode for the Cr-doped ZnO samples, as compared to undoped ZnO, has been observed without any appreciable shifting and broadening in frequency of this mode. This result can be attributed to the fact that Cr2+ substitution induces the microscopic structural disorder in the periodic zinc atomic sub-lattice and reduces the translational symmetry giving rise to local distortions in the lattice. Such local distortion and disorder disrupt the long-range ordering in ZnO and weakens the electric field associated with a mode.57 Close observation shows two very weak peaks at 408 cm−1 [E1 (TO) mode] and 585 cm−1 [E1 (LO) mode] in pure ZnO only. The peak at about 329 cm−1 and a broad shoulder centered at about 658 cm−1 for ZnO (Fig. 12) seemed to have originated from a two-phonon process.58 The peak at about 329 cm−1 can be attributed to single crystalline nature of ZnO54,55 and assigned as a difference mode between the E2 high and E2 low frequencies59,60 viz. (E2H − E2L). This mode is not affected much for doped samples and the height and frequency of this peak remains unaffected with Cr-doping (Fig. 12). This suggests that the single crystalline nature of the nanoparticles remains unaffected due to Cr-doping and it corroborates with the TEM results. It has also been observed from Fig. 12 that with increasing Cr-concentration the shoulder centered at about 658 cm−1 (2nd order mode for ZnO) gradually becomes a peak at around 684 cm−1 without any appreciable shift in the peak position (see Table S4). The mode at 658 cm−1 in pure ZnO nanostructure can be ascribed to the multi-phonon processes [2(E2H − E2L)].61,62 For Cr-doped ZnO samples, this peak (at 658 cm−1 in pure ZnO) is shifted to 682 cm−1 with increase in Cr concentration. The other 2nd order mode at around 1142 cm−1 for ZnO remains unshifted with increasing Cr concentration. It should be noted here that we have assigned the modes as 2nd order whose frequency is close to the double of any one 1st order mode. Further work should be carried to confirm the 2nd order modes. The weak mode A1 (TO) at 378 cm−1 for ZnO remains unchanged in Cr doped samples. Besides the first-order and second-order phonon modes of ZnO, two additional new modes mainly NM1 and NM2 centered at about 475 cm−1 and 525 cm−1 have been observed for samples x ≥ 0.02 (Fig. 12) which do not appear in Raman spectrum of samples with lower Cr concentration. These modes do not have any appreciable shift in frequency with increase in Cr concentration. Ye et al.63 considered two possible mechanisms to ascribe the origin of this anomalous mode: disorder-activated Raman scattering (DARS) and local vibrational modes (LVMs). It was said that the DARS be induced by the breakdown of the translation symmetry of the lattice caused by defects or impurities due to the nature of the dopant or due to the growth conditions. Therefore, it can be presumed that NM1 and NM2 in our samples could arise due to either or both of these two mechanisms. The mode at 547 cm−1 can be assigned to the quasi-longitudinal-optical (LO) phonon mode,52 due to the shallow donor defects, such as zinc interstitials and/or oxygen vacancies, bound on the tetrahedral Cr-sites. Ahmed et al.64 described this mode as 2B1 (low) which contributes to local vibrations of Cr ions in ZnO lattice. In Zn1−xCrxO nanocrystals, host Zn ions are partially substituted by Cr ions, which introduces lattice defects and disorder in host ZnO crystals disturbing the long range ionic ordering in ZnO.

3.1.5 Fourier transform infrared spectroscopy. Since Fourier transform infrared spectroscopy (FTIR) gives information about functional groups present in a compound, the molecular geometry and inter- or intra-molecular interactions, we have employed FTIR to study the vibrational bands of the Zn1−xCrxO samples at room temperature. Normally, the band frequencies within 1000 cm−1 could be attributed to the bonds related to inorganic elements. Fig. 13 shows the FTIR spectra of Zn1−xCrxO samples. The most prominent band at around 480 cm−1 and the negligibly weak band at around 660 cm−1 are assigned to stretching vibration of Zn–O bonds35 in the tetrahedral and octahedral coordination respectively.12 This also confirms wurtzite structure of the samples.8,65 It should be pointed out here that the negligibly weak band at around 660 cm−1 (octahedral coordination) gradually becomes stronger due to higher Cr doping (Cr > 2%) which suggests that Cr-ions enter also in the octahedron. These results corroborate those of the EXFAS and XANES studies. All the other bands are given in Table S5 of the ESI.
image file: c6ra15685a-f13.tif
Fig. 13 FTIR spectra of Zn1−xCrxO (0 ≤ x ≤ 0.06) samples showing different modes.

Peaks observed at 1385 cm−1 and 1610 cm−1 can be attributed to the stretching vibration of C[double bond, length as m-dash]C (asymmetric stretching due to Lewis acidity) and C[double bond, length as m-dash]O (symmetric stretching due to Brownsted acidity) groups in citrate species present on the surfaces of the nanocrystallites. The peak around ∼2345 cm−1 is due to CO2 molecules present in the citrate and in air. The peaks around 2925 cm−1 are due to C–H bond stretching. It should be pointed out here that presence of such band has not been considered as the contamination of the nanoparticles65,66 rather it suggests the presence of absorbed species on the surface (surface modification) of nanocrystals. The broad absorption peak at ∼3465 cm−1 is attributed to –OH group of H2O, indicating the existence of water absorbed on the surface of nanocrystalline powders. Due to the rich surface hydroxyl groups, these Cr-doped ZnO colloids can be easily dispersed into many polar and nonpolar solvents (e.g., water, alcohol, CHCl3, etc.), and the dispersions show good stability. In addition, the surface hydroxyl can provide functional groups to react with functional organic molecules with optical or electrical properties (e.g., dyes, cluster compounds), which may generate novel organic–inorganic hybrids.65,66

3.2 Optical properties

3.2.1 UV-visible spectroscopy. The UV-visible spectra of the samples, obtained by dispersing ZnO nanoparticles in distilled water and using distilled water as the reference are shown in Fig. 14. The optical band gap has been evaluated using the relation:35,67
 
(αhν)2 = A(Eg) (7)
where A is a constant, h is the Planck's constant, ν is the frequency of light, and Eg is the bandgap of the material. The direct transitions in this system have been confirmed from the linear fitting of the (αhν)2 vs. hν plot (inset of Fig. 14 for typical Cr0 sample). UV-vis measurements show that blue shift (increase) in the optical band gap occurs up to x ≤ 0.02 (viz. Zn0.98Cr0.02O) after that for higher Cr-doping (x ≥ 0.02) the band gap decreases with increasing Cr concentration. Since the particle sizes of the present samples are much larger than the sizes for which quantum confinement effect is significant, the observed shift cannot be assigned to the size effect. Therefore, increase of the band gap can be interpreted mainly with the 4s–3d and 2p–3d exchange interactions in which the decrease of Zn 3d electron density and the increase of Cr 3d electron density below the valence band leads to higher binding energy of the valence band-maximum giving rise to the larger band gap.68 This blue shift behavior or broadening in the band gap for Cr-doped samples may also be due to the Burstein–Moss band filling effect.69,70 ZnO is an n-type material and when ZnO is doped with Cr-ions, the Fermi level will shift inside the conduction band (by ξn).70 Since the states below ξn in the conduction band are filled, due to Cr doping the absorption edge shifts to the higher energy giving the blue shift or widening the band gap.70 The red shift of the band gap observed for higher Cr doping can be interpreted to be due to the sp–d exchange interactions between the band electrons (in conduction and valence bands) of ZnO and the localized d electrons of the Cr-ions.71 The s–d and p–d exchange interactions lead to a negative and a positive correction to the conduction-band and the valence-band edges respectively, resulting in a band gap narrowing.72

image file: c6ra15685a-f14.tif
Fig. 14 Absorption spectra of Zn1−xCrxO samples. Inset (i) shows calculation of bandgap by using Tauc's formula for typical Cr0 sample and (ii) shows variation of the optical band gap (Eg) with the Cr-concentration (x).
3.2.2 Photoluminescence spectroscopy. Photoluminescence (PL) spectroscopy is also a sensitive non-destructive technique to study the optical properties and to investigate the intrinsic and extrinsic defects in semiconductors. PL intensity may be directly correlated with the defect density in a fluorescent material. It provides information about the energy states of impurities and defects, even at very low densities, which is helpful for understanding structural defects in semiconductors. The room temperature PL spectra of Cr doped ZnO nanocrystalline samples measured by exciting at 320 nm are shown in Fig. 15. From the figure it is clear that the PL peaks are broad possibly because of the presence of several recombination sites and defects. The asymmetric nature of the PL spectra is ascribed to the presence of other inherent emission peaks due to distributed defect states on the surface and in the interior of a given nanostructured system. In these asymmetrically broadened PL spectra, the defect-related emissions dominate the band-edge emission of ZnO and hence the band-edge emission (∼380 nm) is only weakly resolved. The PL spectra (Fig. 15) show six peaks occurring around 380 nm, 410 nm, 434 nm, 464 nm, 485 nm and 525 nm. The first peak is in the ultraviolet (UV) region, while other five peaks correspond to violet, violet-blue, blue, blue-green, and green respectively. The peak in the UV region has been assigned to the near band edge excitonic emission (NBE) because the energy corresponding to this peak is almost equal to the band gap energy of ZnO73 (estimated by UV-vis measurements). The UV emission band can be explained by a near band edge (NBE) transition originates from the recombination of carriers bound within excitons. For ZnO nanoparticles at room temperatures (T ≥ 150 K), it is mostly due to recombination of the donor-bound excitons.74 The energy interval between the bottom of the conduction band and the zinc vacancy (VZn) level (∼3.06 eV) tells that the violet emission around 410 nm may be related to zinc vacancies. The energy interval between interstitial Zn level (Zni) and the valence band is consistent with the energy (∼2.9 eV) of the violet-blue emission at 434 nm observed in our experiment. Shi et al. have stated that the violet-blue (423 nm) emission might be possibly due to radiative defects related to traps existing at grain boundaries. This emission comes from the radiative transition between this level and the valance band.75 The weak blue emission around 464 nm may be attributed to the defect related positively charged Zn vacancies.76 Two new emission bands viz. a blue-green band (∼485 nm) and a green band (∼525 nm) have been evolved due to Cr doping which are absent in pure ZnO. The blue-green band emission (∼485 nm) is possibly due to surface defects.77 This green band (∼525 nm) emission is attributed to the oxygen vacancies (Vo) which results from the recombination of electrons with photo-generated holes trapped in singly ionized oxygen vacancies.78 Due to the enhancement in the density of singly ionized oxygen vacancies (Vo) with increasing Cr doping, the density of surface dangling bonds increases. This increase of dangling bonds increases the probability of visible emission, whereas decreases the probability of UV emission. This seems to be the main cause behind the enhanced green emission with increasing Cr-doping. This result of increasing oxygen vacancies (Vo) corroborates the result from EXAFS measurement.
image file: c6ra15685a-f15.tif
Fig. 15 Room temperature PL spectra of the Zn1−xCrxO (0 ≤ x ≤ 0.06) samples.

4. Summary and conclusions

We have presented here the extensive study on sol–gel derived Cr-doped ZnO diluted magnetic semiconductors (DMSs) nanoparticles by using different complementary experimental techniques. XRD with Rietveld refinement, HRTEM, and micro-Raman analysis shows that Cr-doped ZnO nanoparticles have wurtzite structure as that of pure ZnO. XRD and HRTEM results show that estimated size of the crystallites decreases linearly with the increase of Cr doping concentration while there is an increase in tensile strain in the ZnO lattice due to Cr incorporation. The above results clearly indicate that Cr-ions have substituted Zn ions in the ZnO lattice of the nanocrystals. EXAFS results show that there is a reduction in oxygen coordination and increase in oxygen vacancies with increase in Cr doping concentration in the samples, however the substitution of Zn ions by Cr ions of almost similar size does not cause any significant change in the host lattice as manifested in the values of the bond distances. XANES study clearly rules out the presence of metallic Cr clusters in the samples. These observations corroborate to those of XRD study. Raman measurement reveals that the local symmetry in the Cr doped nanocrystals is different from that of undoped sample, though the crystal structure remains the same as that of the wurtzite structure of pure ZnO, which further supports the incorporation of Cr-ions in the ZnO lattice. Wurtzite structure has been confirmed by FTIR analysis. FTIR result also indicates the increase in octahedral coordination around Cr site with increase in Cr doping concentration in the samples and thus corroborates the results obtained from pre-edge structures of XANES measurements at Cr K-edge.

UV-vis measurements show blue shift (increase) in the optical band gap occurs up to x ≤ 0.02 (viz. Zn0.98Cr0.02O) after that for higher Cr-doping (x ≥ 0.02) the band gap decreases with increasing Cr concentration. This increase (blue shift) of the band gap can be interpreted mainly with the 4s–3d and 2p–3d exchange interactions and the Moss–Burstein effect while the decrease (red shift) of the band gap can be interpreted to be due to the sp–d exchange interactions between the band electrons of ZnO and the localized d electrons of the Cr-ions. The room temperature PL measurements illustrate NBE emission and violet, violet-blue, blue, blue-green, and green emissions are in visible region. The UV emission (NBE) peak originates from the radiative recombination of carriers bound within excitons while the other emissions may be attributed to the Zn-vacancies, interstitial Zni levels, radiative defects related to traps existing at grain boundaries, defects related to positively charged Zn vacancies, surface defects and singly ionized oxygen vacancies (Vo) respectively. It has also been observed that increasing Cr doping increases the density of singly ionized oxygen vacancies (Vo) enhancing the green emission.

Thus in summary XRD, HRTEM and Raman measurements show clear signature of changes in ZnO lattice upon Cr doping though the overall wurtzite structure remains unaffected. XANES measurements show that Cr is present in the samples in Cr3+ oxidation state while pre-edge peaks in XANES spectra and FTIR results show that local structure around Cr is increasingly becoming octahedral with increase in Cr doping concentration. EXAFS and PL measurements show that Cr incorporation in ZnO lattice is accompanied by creation of more and more oxygen vacancies.

Acknowledgements

AKG is thankful to DAE-BRNS, India; CSIR, India; and UGC, India for financial support (Grant no. 2011/37P/11/BRNS/1038-1, 03(1302)/13/EMR-II, and F: 42-787/2013 (SR) respectively); to the Bio-Physics lab, Dept. of Physics for FTIR, UV-vis and PL facilities, and to Prof. Ranjan Kr. Singh for Raman Spectroscopy facility. Authors acknowledge the help of Dr S. Basu in recording the EXAFS spectra.

References

  1. J. K. Furdyna, J. Appl. Phys., 1988, 64, R29–R64 CrossRef CAS.
  2. S. Wolf, D. Awschalom, R. Buhrman, J. Daughton, S. Von Molnar, M. Roukes, A. Y. Chtchelkanova and D. Treger, Science, 2001, 294, 1488–1495 CrossRef CAS PubMed.
  3. H. Ohno, Science, 1998, 281, 951–956 CrossRef CAS PubMed.
  4. Y. Ohno, D. Young, B. a. Beschoten, F. Matsukura, H. Ohno and D. Awschalom, Nature, 1999, 402, 790–792 CrossRef CAS.
  5. J. Coey, M. Venkatesan and C. Fitzgerald, Nat. Mater., 2005, 4, 173–179 CrossRef CAS PubMed.
  6. J. Sans, J. Sánchez-Royo, A. Segura, G. Tobias and E. Canadell, Phys. Rev. B: Condens. Matter Mater. Phys., 2009, 79, 195105 CrossRef.
  7. B. Panigrahy, M. Aslam and D. Bahadur, Nanotechnology, 2012, 23, 115601 CrossRef PubMed.
  8. S. Kumar, S. Chatterjee, K. Chattopadhyay and A. K. Ghosh, J. Phys. Chem. C, 2012, 116, 16700–16708 CAS.
  9. I. Djerdj, G. Garnweitner, D. Arčon, M. Pregelj, Z. Jagličić and M. Niederberger, J. Mater. Chem., 2008, 18, 5208–5217 RSC.
  10. J. Chaboy, R. Boada, C. Piquer, M. Laguna-Marco, M. García-Hernández, N. Carmona, J. Llopis, M. Ruíz-González, J. González-Calbet and J. Fernández, Phys. Rev. B: Condens. Matter Mater. Phys., 2010, 82, 064411 CrossRef.
  11. I. Balti, A. Mezni, A. Dakhlaoui-Omrani, P. Leone, B. Viana, O. Brinza, L.-S. Smiri and N. Jouini, J. Phys. Chem. C, 2011, 115, 15758–15766 CAS.
  12. S. Kumar, S. Basu, B. Rana, A. Barman, S. Chatterjee, S. Jha, D. Bhattacharyya, N. Sahoo and A. K. Ghosh, J. Mater. Chem. C, 2014, 2, 481–495 RSC.
  13. S. Pearton, C. Abernathy, M. Overberg, G. Thaler, D. Norton, N. Theodoropoulou, A. Hebard, Y. Park, F. Ren and J. Kim, J. Appl. Phys., 2003, 93, 1–13 CrossRef CAS.
  14. S. A. Chambers, Surf. Sci. Rep., 2006, 61, 345–381 CrossRef CAS.
  15. K. Sebastian, M. Chawda, L. Jonny and D. Bodas, Mater. Lett., 2010, 64, 2269–2272 CrossRef CAS.
  16. A. Meng, J. Xing, Z. Li and Q. Li, ACS Appl. Mater. Interfaces, 2015, 7, 27449–27457 CAS.
  17. K. Vijayalakshmi and D. Sivaraj, RSC Adv., 2015, 5, 68461–68469 RSC.
  18. T. Dietl, H. Ohno, F. Matsukura, J. Cibert and D. Ferrand, Science, 2000, 287, 1019–1022 CrossRef CAS PubMed.
  19. K. Sato and H. Katayama-Yoshida, Jpn. J. Appl. Phys., Part 1, 2000, 39, L555 CrossRef CAS.
  20. Y. Liu, J. Yang, Q. Guan, L. Yang, H. Liu, Y. Zhang, Y. Wang, D. Wang, J. Lang, Y. Yang, L. Fei and M. Wei, Appl. Surf. Sci., 2010, 256, 3559–3562 CrossRef CAS.
  21. K. Jayanthi, S. Chawla, A. G. Joshi, Z. H. Khan and R. K. Kotnala, J. Phys. Chem. C, 2010, 114, 18429–18434 CAS.
  22. B.-Z. Lin, L. Zhou, S. U. Yuldashev, D.-J. Fu and T.-W. Kang, Appl. Surf. Sci., 2014, 315, 124–130 CrossRef CAS.
  23. M. Venkatesan, C. Fitzgerald, J. Lunney and J. Coey, Phys. Rev. Lett., 2004, 93, 177206 CrossRef CAS PubMed.
  24. K. Ueda, H. Tabata and T. Kawai, Appl. Phys. Lett., 2001, 79, 988 CrossRef CAS.
  25. H. Liu, X. Zhang, L. Li, Y. Wang, K. Gao, Z. Li, R. Zheng, S. Ringer, B. Zhang and X. Zhang, Appl. Phys. Lett., 2007, 91, 072511 CrossRef.
  26. Y. Liu, Y. Yang, J. Yang, Q. Guan, H. Liu, L. Yang, Y. Zhang, Y. Wang, M. Wei, X. Liu, L. Fei and X. Cheng, J. Solid State Chem., 2011, 184, 1273–1278 CrossRef CAS.
  27. W. Jin, I. Lee, A. Kompch, U. Dorfler and M. Winterer, J. Eur. Ceram. Soc., 2007, 27, 4333–4337 CrossRef CAS.
  28. L. Schneider, S. V. Xaitsev, W. Jin, A. Kompch, M. Winterer, M. Acet and G. Bacher, Nanotechnology, 2009, 20, 135604 CrossRef CAS PubMed.
  29. J. Goodenough, J. Phys. Chem. Solids, 1959, 10, 87 CrossRef.
  30. P. D. Borges, L. M. R. Scolfaro, H. W. L. Alves, E. F. daSilva Jr and L. V. C. Assali, Nanoscale Res. Lett., 2012, 7, 540 CrossRef PubMed.
  31. S. Basu, C. Nayak, A. Yadav, A. Agrawal, A. Poswal, D. Bhattacharyya and S. Jha, Int. J. Mod. Phys.: Conf. Ser., 2014, 493(1), 012032 CrossRef.
  32. A. K. Zak, W. A. Majid, M. E. Abrishami and R. Yousefi, Solid State Sci., 2011, 13, 251–256 CrossRef.
  33. B. D. Cullity, Elements of X-ray diffraction, Addison-Wesley Inc., USA, 1959 Search PubMed.
  34. A. Patterson, Phys. Rev., 1939, 56, 978 CrossRef CAS.
  35. M. M. Hassan, W. Khan, A. Azam and A. H. Naqvi, J. Ind. Eng. Chem., 2015, 21, 283–291 CrossRef.
  36. J. Humphreys and M. G. Ardakani, Acta Mater., 1996, 44, 2717 CrossRef.
  37. E. Prince and J. Stalick, Accuracy in Powder Diffraction II, 1992 Search PubMed.
  38. B. B. Straumal, A. A. Mazilkin, S. G. Protasova, P. B. Straumal, A. A. Myatiev, G. Schütz, E. J. Goering, T. Tietze and B. Baretzky, Philos. Mag., 2013, 93, 1371–1383 CrossRef CAS.
  39. B. B. Straumal, S. Protasova, A. Mazilkin, G. Schütz, E. Goering, B. Baretzky and P. Straumal, JETP Lett., 2013, 97, 367–377 CrossRef CAS.
  40. D. C. Konigsberger and R. Prince, X-Ray Absorption: Principles, Applications, Techniques of EXAFS, SEXAFS and XANES, Wiley, New York, 1988 Search PubMed.
  41. M. Newville, B. Ravel, D. Haskel, J. Rehr, E. Stern and Y. Yacoby, Phys. B, 1995, 208, 154–156 CrossRef.
  42. http://abulafia.mt.ic.ac.uk/shannon/ptable.php.
  43. S. Basu, D. Inamdar, S. Mahamuni, A. Chakrabarti, C. Kamal, G. R. Kumar, S. Jha and D. Bhattacharyya, J. Phys. Chem. C, 2014, 118, 9154–9164 CAS.
  44. S. Kumar, N. Tiwari, S. N. Jha, S. Chatterjee, D. Bhattacharyya, N. K. Sahoo and A. K. Ghosh, RSC Adv., 2015, 5, 94658–94669 RSC.
  45. A. K. Yadav, S. M. Haque, D. Shukla, R. J. Choudhary, S. N. Jha and D. Bhattacharyya, AIP Adv., 2015, 5, 117138 CrossRef.
  46. E. S. Jeong, H. J. Yu, Y. J. Kim, G. C. Yi, Y. D. Choi and S. W. Han, J. Nanosci. Nanotechnol., 2010, 10, 3562–3565 CrossRef CAS PubMed.
  47. N. Tiwari, S. Doke, A. Lohar, S. Mahamuni, C. Kamal, A. Chakrabarti, R. Choudhary, P. Mondal, S. Jha and D. Bhattacharyya, J. Phys. Chem. Solids, 2016, 90, 100–113 CrossRef CAS.
  48. I. Brown and D. Altermatt, Acta Crystallogr., Sect. B: Struct. Sci., 1985, 41, 244–247 CrossRef.
  49. W. Jin, I. Lee, A. Kompch, U. Dorfler and M. Winterer, J. Eur. Ceram. Soc., 2007, 27, 4333–4337 CrossRef CAS.
  50. L. Schneider, S. V. Xaitsev, W. Jin, A. Kompch, M. Winterer, M. Acet and G. Bacher, Nanotechnology, 2009, 20, 135604 CrossRef CAS PubMed.
  51. A. Singhal, S. Achary, J. Manjanna, S. Chatterjee, P. Ayyub and A. Tyagi, J. Phys. Chem. C, 2010, 114, 3422–3430 CAS.
  52. L. Yang, X. Wu, G. Huang, T. Qiu and Y. Yang, J. Appl. Phys., 2005, 97, 014308 CrossRef.
  53. D. Mead and G. Wilkinson, J. Raman Spectrosc., 1977, 6, 123–129 CrossRef CAS.
  54. S. Singh and M. R. Rao, Phys. Rev. B: Condens. Matter Mater. Phys., 2009, 80, 045210 CrossRef.
  55. J. Calleja and M. Cardona, Phys. Rev. B: Condens. Matter Mater. Phys., 1977, 16, 3753 CrossRef CAS.
  56. X. Wang, J. Xu, X. Yu, K. Xue, J. Yu and X. Zhao, Appl. Phys. Lett., 2007, 91, 031908 CrossRef.
  57. J. Wang, G. Huang, X. Zhong, L. Sun, Y. Zhou and E. Liu, Appl. Phys. Lett., 2006, 88, 252502 CrossRef.
  58. T. C. Damen, S. Porto and B. Tell, Phys. Rev., 1966, 142, 570 CrossRef CAS.
  59. J. Serrano, A. Romero, F. Manjon, R. Lauck, M. Cardona and A. Rubio, Phys. Rev. B: Condens. Matter Mater. Phys., 2004, 69, 094306 CrossRef.
  60. R. Cuscó, E. Alarcón-Lladó, J. Ibáñez, L. Artús, J. Jiménez, B. Wang and M. J. Callahan, Phys. Rev. B: Condens. Matter Mater. Phys., 2007, 75, 165202 CrossRef.
  61. S. Chen, Y. Liu, C. Shao, R. Mu, Y. Lu, J. Zhang, D. Shen and X. Fan, Adv. Mater., 2005, 17, 586–590 CrossRef CAS.
  62. Y. Xing, Z. Xi, Z. Xue, X. Zhang, J. Song, R. Wang, J. Xu, Y. Song, S. Zhang and D. Yu, Appl. Phys. Lett., 2003, 83, 1689–1691 CrossRef CAS.
  63. J. Ye, S. Gu, S. Zhu, S. Liu, Y. Zheng, R. Zhang, Y. Shi, Q. Chen, H. Yu and Y. Ye, Appl. Phys. Lett., 2006, 88, 101905 CrossRef.
  64. F. Ahmed, S. Kumar, N. Arshi, M. Anwar, B. H. Koo and C. G. Lee, Microelectron. Eng., 2012, 89, 129–132 CrossRef CAS.
  65. Y. Guo, X. Cao, X. Lan, C. Zhao, X. Xue and Y. Song, J. Phys. Chem. C, 2008, 112, 8832–8838 CAS.
  66. P. D. Cozzoli, M. L. Curri, A. Agostiano, G. Leo and M. Lomascolo, J. Phys. Chem. B, 2003, 107, 4756–4762 CrossRef CAS.
  67. J. Tauc, Amorphous and Liquid Semiconductors, Plenum, New York, 1974 Search PubMed.
  68. S. Gilliland, J. Sans, J. Sánchez-Royo, G. Almonacid, B. García-Domene, A. Segura, G. Tobias and E. Canadell, Phys. Rev. B: Condens. Matter Mater. Phys., 2012, 86, 155203 CrossRef.
  69. E. Burstein, Phys. Rev., 1954, 93, 632 CrossRef CAS.
  70. F. Shan and Y. Yu, J. Eur. Ceram. Soc., 2004, 24, 1869–1872 CrossRef CAS.
  71. R. Bylsma, W. Becker, J. Kossut, U. Debska and D. Yoder-Short, Phys. Rev. B: Condens. Matter Mater. Phys., 1986, 33, 8207 CrossRef CAS.
  72. P. Koidl, Phys. Rev. B: Condens. Matter Mater. Phys., 1977, 15, 2493 CrossRef CAS.
  73. Y. Wang, S. Lau, H. Lee, S. Yu, B. Tay, X. Zhang and H. Hng, J. Appl. Phys., 2003, 94, 354–358 CrossRef CAS.
  74. V. A. Fonoberov, K. A. Alim, A. A. Balandin, F. Xiu and J. Liu, Phys. Rev. B: Condens. Matter Mater. Phys., 2006, 73, 165317 CrossRef.
  75. L. Shi, H. Shen, L. Jiang and X. Li, Mater. Lett., 2007, 61, 4735–4737 CrossRef CAS.
  76. T. Kataoka, Y. Yamazaki, Y. Sakamoto, A. Fujimori, F.-H. Chang, H.-J. Lin, D. Huang, C. Chen, A. Tanaka and S. Mandal, Appl. Phys. Lett., 2010, 96, 252502 CrossRef.
  77. E. Gür, S. Tüzemen, K. Meral and Y. Onganer, Appl. Phys. A, 2009, 94, 549–554 CrossRef.
  78. K. Vanheusden, C. Seager, W. T. Warren, D. Tallant and J. Voigt, Appl. Phys. Lett., 1996, 68, 403–405 CrossRef CAS.

Footnotes

PACS No. 61.05.J-, 73.61.Ga, 73.63.Bd, 74.25.nd, 78.20.Ci, 78.30.-J.
Electronic supplementary information (ESI) available. See DOI: 10.1039/c6ra15685a

This journal is © The Royal Society of Chemistry 2016
Click here to see how this site uses Cookies. View our privacy policy here.