
 Open Access Article
 This Open Access Article is licensed under a
 Creative Commons Attribution 3.0 Unported Licence
Determination of side products in the photocatalytic generation of hydrogen with copper photosensitizers by resonance Raman spectroelectrochemistry†
Ying Zhang‡
ab,
Martin Heberle‡c,
Maria Wächtlerb,
Michael Karnahl*c and
Benjamin Dietzek*abd
aInstitute of Physical Chemistry, Friedrich Schiller University Jena, Helmholtzweg 4, 07743 Jena, Germany. E-mail: benjamin.dietzek@uni-jena.de
bLeibniz Institute of Photonic Technology Jena (IPHT), Albert-Einstein-Straße 9, 07745 Jena, Germany. E-mail: benjamin.dietzek@leibniz-ipht.de
cUniversity of Stuttgart, Institute of Organic Chemistry, Pfaffenwaldring 55, 70569 Stuttgart, Germany. E-mail: michael.karnahl@oc.uni-stuttgart.de
dCentre for Energy and Environmental Chemistry, Friedrich Schiller University Jena, Lessingstrasse 10, 07743 Jena, Germany
First published on 26th October 2016
Abstract
A combination of UV-Vis and resonance Raman spectroscopy in conjunction with electrochemistry is employed to reveal the nature of a side product formed when using heteroleptic Cu(I)-photosensitizers [(P^P)Cu(N^N)]+ for photocatalytic hydrogen generation. It is shown that homoleptic [Cu(N^N)2]+ complexes are formed under oxidative conditions confirming a proposed deactivation pathway.
Introduction
For decades, mankind has mainly relied on fossil fuels such as coal, oil and natural gas.1,2 However, concerns regarding the greenhouse effect, environmental pollution and resource depletion have driven the search for renewable and more sustainable energy carriers. In this respect, molecular hydrogen, which is generated by the photocatalytic splitting of water, is considered to be an efficient (high energy density of 119 kJ g−1) and clean energy carrier.3 Therefore, great efforts have been made to design suitable photosensitizers, which can be applied for the light-driven production of hydrogen from water by using the energy of the sun.4,5In order to bring molecular photosensitizer into practice, conventional noble metal based systems need to be replaced by cheaper and more abundant ones.4,6,7 In particular, heteroleptic Cu(I)-complexes of the type [(P^P)Cu(N^N)]+, composed of a diimine N^N and bulky diphosphine P^P ligand, are promising alternatives.8–10 In contrast to traditional homoleptic bisdiimine Cu(I)-complexes this class of photosensitizers enables emission lifetimes in the microsecond range and (together with Fe-based molecular catalysts) high catalytic activities, which can even exceed those of the commonly used Ru(II)- and Ir(III)-complexes.
By systematically changing the nature, size and bulkiness of the ligand environment, the heteroleptic copper photosensitizers (CuPS) can be modified in a wide range.8,9,11,12 Most popular are variations of the diphosphine ligand backbone and of the substituents at the diimine ligand in order to tune the energetics and lifetimes of excited states as well as to increase the chemical stability of the complexes.9,12 As a result, [(Xant)Cu(Me2phenPh2)](PF6) (with Xant = xantphos and Me2phenPh2 = 2,9-dimethyl-4,7-diphenyl-1,10-phenanthroline, abbr. as 2 within this report) was found as one of the most efficient CuPS so far.9 In combination with [Fe3(CO)12] as water reduction catalyst (WRC) and triethylamine as sacrificial reductant (SR) 2 achieved a turnover number of 862.9 Furthermore, it represents the first fully noble metal-free system which is capable to generate hydrogen by the reduction of protons after an intermolecular electron transfer from the CuPS to the iron-based catalyst (Scheme 1).
 | ||
| Scheme 1 General reaction scheme for the photocatalytic production of hydrogen using a heteroleptic copper photosensitizer (CuPS), an iron-based water reduction catalyst (WRC) and a sacrificial reductant (SR). The catalytic cycle of the CuPS is dominated by an oxidative pathway. | ||
Previous studies revealed, that the excited CuPS* is able to undergo electron transfer with both, the SR (reductive quenching) and the WRC (oxidative quenching, Scheme 1), resulting in CuPS− or CuPS+ as intermediates of the catalytic cycle.9 However, oxidative quenching was identified as the dominant pathway for catalytic activity (Scheme 1). Nevertheless, upon oxidative quenching of the photosensitizer a slow decomposition of the initial CuPS during the course of the reaction was observed.9,12,13 Previously, a dissociation of the diphosphine ligand from the heteroleptic CuPS under catalytic conditions was suggested, forming a homoleptic bisdiimine Cu(I)-species, which contributes to the end of catalysis.12,13 So far, the existence of catalytic intermediates or side products arising from the CuPS has only been inferred by using UV-Vis spectroelectrochemistry (UV-Vis-SEC), mass spectrometry and 31P-NMR spectroscopy.12,13 Therefore, to provide a deeper understanding of the photocatalytic system the present study aims for the verification of the respective side products. To this end and for the first time resonance Raman spectroelectrochemistry (RR-SEC), which allows for an observation of detailed structurally sensitive vibrational modes that are coupled to an electronic transition,14 was applied to directly identify different copper species. Thereby, RR-SEC provides structurally sensitive data on electrochemically induced species by means of Raman active vibrations.15–17
Results and discussions
A series of four different copper photosensitizers, consisting of two heteroleptic CuPS and their respective homoleptic counterparts were investigated (Fig. 1). All compounds bear methyl substituents in the 2,9-position of the 1,10-phenanthroline (phen) ligand, as it was found that alkyl substituents at this position are beneficial for long excited state lifetimes.9 In contrast, the complexes differ with respect to their substitution at the 4,7-position of the phen ligand (Fig. 1), where additional phenyl groups effect the emission intensity.18 | ||
| Fig. 1 General structure of the heteroleptic Cu(I)-complexes 1 and 2 and their homoleptic analogues 1′ and 2′ applied in this study. | ||
The respective absorption spectra of 1/1′ and 2/2′ dissolved in acetonitrile are depicted in Fig. 2 and summarised in Table 1. The strong features between 250 and 350 nm originate from π–π* ligand-centred (LC) transitions within the phen ligands. Furthermore, at wavelengths above 350 nm metal-to-ligand charge transfer (MLCT) transitions cause moderately intense absorption bands. For the heteroleptic complexes 1 and 2 the MLCT transitions involve mainly acceptor orbitals of the phen ligand.19
 | ||
| Fig. 2 Absorption spectra of the complexes 1/1′ and 2/2′ in acetonitrile. Inset: normalised absorption (solid lines) and emission spectra (dashed lines) for 1 and 2 in acetonitrile solution at room temperature. | ||
Comparison of 1 and 2 revealed a bathochromic shift of the MLCT and LC bands for 2 due to the increased π-system upon introduction of two additional phenyl substituents at the 4,7-position (+M-effect). Significant differences are observed for the homoleptic complexes 1′ and 2′, where two diimine ligands contribute to the MLCT transitions causing an additional bathochromic and hyperchromic shift of the respective absorption bands. Moreover, the absorption maxima are considerably red-shifted by 78 nm (1′ vs. 1, 4525 cm−1) and 89 nm (2′ vs. 2, 4831 cm−1), respectively, with much higher extinction coefficients.
Emission is observed with maxima at 545 nm for 1 and 552 nm for 2 (Fig. 2). In accordance with literature,21 the emission of 1′ and 2′ is completely quenched in acetonitrile solution. This quenching is explained by the interaction of the solvent with the Cu(II)* metal centre forming an exciplex due to the donor properties of the acetonitrile and offering a pathway for efficient radiationless deactivation.6,21,22 This quenching mechanism appears to be much less pronounced for the heteroleptic complexes 1 and 2, which reflects well the inhibition of flattening distortion upon photoexcitation and the effective shielding of the copper centre against nucleophilic attack by the bulky and rigid xantphos ligand.
For 1/1′ and 2/2′ cyclic voltammetry (CV) and differential pulse voltammetry (DPV) were carried out in acetonitrile solution (Fig. 3A and S1†). The CVs of 1′ and 2′ exhibit a fully reversible oxidation peak at 0.92 and 0.91 V vs. NHE, while the oxidation of the heteroleptic complexes 1 and 2 is irreversible and occurs at higher potentials (Table 1). Combining the electrochemical results with optical spectroscopy the excited state redox potentials can be predicted (Fig. 3B and S1†).6,23 For this purpose, the energy of the lowest lying excited states is estimated by the intersection of the normalised absorption and emission spectra, i.e. 2.64 (for 1) and 1.87 eV (for 1′). It should be noted that the energy of the excited state determined as described above presents only an estimate as structural reorganization appears in the excited state upon photoexcitation.19,22,24 Nevertheless, both 1* and 1′* appear to be potent photoreductants with redox potentials of −1.19 V and −0.95 V vs. NHE, respectively. Similarly, 2* and 2′* possess a strong reducing ability as well (−1.17 and −0.90 V vs. NHE, Fig. S1†). In consequence, the heteroleptic CuPS 1 and 2 appear to be stronger reducing agents in their excited state compared to their homoleptic analogues 1′ and 2′.
 | ||
| Fig. 3 (A) Electrochemical potentials of ground state and excited state of 1 and 1′ in acetonitrile, vs. NHE. (B) Cyclic voltammetry curves (black) of the complexes 1 and 1′ in 0.1 M TBABF4/acetonitrile. Differential pulse voltammetry (red) were applied for better analysis. | ||
To structurally characterise the oxidised species and to check for potential side products in the photocatalytic cycle (Scheme 1)9,12 we aim for resonance Raman spectroelectrochemistry. Therefore, an initial characterisation of 1′ and 2′ by UV-Vis-SEC, where comparable spectral features could be observed for both complexes, is mandatory. Upon electrochemical oxidation the intensity of the MLCT absorption band is significantly decreased (Fig. S2†). The reversibility of this process was also checked by measuring UV-Vis spectra during a CV (Fig. S3†). For both complexes the UV-Vis spectra are completely recovered after a full oxidative cycle, i.e. oxidation followed by re-reduction.
The heteroleptic complexes 1 and 2 show decreasing MLCT bands and enhanced as well as red-shifted LC bands upon electrochemical oxidation (Fig. 4). However, as expected from our previous work the MLCT bands of 1 and 2 do not fully recover after the oxidative cycle.13 At the same time new bands centred at 456 (for 1) and 476 nm (for 2) are appearing. Notably, the position and shape of the new bands exactly match with the MLCT bands of the respective homoleptic complexes (Fig. 4, insets). Furthermore, the spectra obtained after the oxidative cycle both for 1 and 2, can be quantitatively explained as a linear superposition of the spectra of the heteroleptic complexes (1 and 2) and their respective homoleptic counter parts (1′ and 2′). This is a strong indication that oxidative conditions lead to a ligand exchange reaction, which results in the dissociation of the heteroleptic complexes and the formation of the homoleptic bisdiimine Cu(I)-complexes and generalises the previously obtained results from UV-Vis-SEC of complex 2.13 Furthermore, when running multiple oxidative CV cycles on the respective heteroleptic complexes the appearance of the redox signals, which can be assigned to the homoleptic compounds, also indicates the formation of the homoleptic species (Fig. S4 and S5†). In the meantime, the anodic peak of heteroleptic complexes decreases, signifying the decomposition of 1 and 2 under oxidative condition.
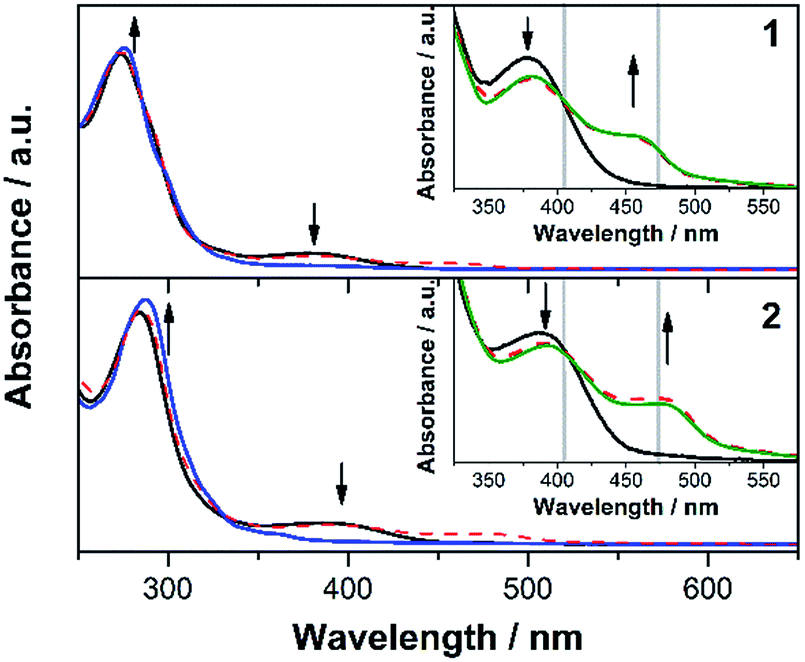 | ||
| Fig. 4 UV-Vis spectra of 1 (upper panel) and 2 (lower panel) under open circuit potential (black solid lines), upon electrochemical oxidation (blue solid lines) and after an oxidative cycle (red dashed lines) in 0.1 M TBABF4/acetonitrile. The insets show an enlarged view on the spectral region of the MLCT absorption bands. The simulated spectra (green solid lines) are linear combinations of the absorption spectra of the heteroleptic complex and its corresponding homoleptic analogue. The applied RR excitation wavelengths (405 and 473 nm) are displayed as grey vertical lines. | ||
To gain detailed structural insights into the formed reaction products, finally resonance Raman spectroscopy was utilised. Therefore, an excitation wavelength of 473 nm was chosen to selectively obtain the resonance Raman signals of the electrochemically formed side products of 1 and 2. At this wavelength the absorption of 1 and 2 is rather low and, hence, almost no resonance Raman signals are recorded from these starting compounds. As a result, the resonance Raman spectra of 1 and 2 after electrochemically oxidation closely resemble the corresponding features of the homoleptic counterparts 1′ and 2′ (Fig. 5 and S6†). For both the homoleptic complex 1′ and the oxidation product of 1 the same resonance Raman bands are observed, i.e. at 1589, 1502, 1439, 1420, 1304, 1293, 1214 and 1146 cm−1. An electrochemically oxidative cycle of 2 yields Raman bands at 1604, 1571, 1427, 1285, 1269, 1172 and 1101 cm−1, which coincide with the resonance Raman bands of the homoleptic complex 2′. These bands are exclusively associated with vibrations of the phen ligand, e.g. the breathing modes of the phenanthroline rings contribute to the bands at 1439 and 1420 cm−1 for 1′, and 1427 cm−1 for 2′.25 Similarly, the methyl deformation relates to the Raman bands at 1017 and 1022 cm−1 as observed for 1′ and 2′, respectively. Furthermore, excitation with 405 nm, which is in the blue-edge of the MLCT band for 1′ and 2′, probes Raman active vibrations, which are coupled to electronic transitions to higher lying excited states. However, the Raman band positions observed with an excitation wavelength of 405 nm are identical to those obtained upon excitation at 473 nm (Fig. S7 and S8†). Also for 1 and 2 an excitation wavelength of 405 nm falls into the red flank of the MLCT absorption band, and the Raman vibration modes are assigned to phen ligands, which is in agreement with results from DFT calculations, i.e. that the charge transfer occurs from the central Cu(I) to the phen ligands.19 When performing RR-SEC upon 405 nm excitation, only minor spectral changes are observed upon oxidation (Fig. S7 and S8†), which is in accordance with the UV-Vis-SEC spectral features, that only a decrease of the absorption band occurs but no new features emerge at 405 nm.
 | ||
| Fig. 5 Resonance Raman spectra of 1 (upper panel) under open circuit potential (black line), after an oxidative cycle (red line) and 1′ (lower panel, blue line) in 0.1 M TBABF4/acetonitrile, excited at 473 nm. | ||
Therefore, the structural sensitivity of RR-SEC proves the prevalent degradation pathway of the CuPS 1 and 2 under oxidative conditions. It reveals that dissociation of the xantphos ligand and subsequent formation of the homoleptic complexes 1′ and 2′ likely cause the partial deactivation of 1 and 2 under catalytic conditions.12,13
Conclusions
In summary, the combination of UV-Vis and resonance Raman spectroscopy in conjunction with electrochemistry enabled the decisive proof that the original heteroleptic copper photosensitizer [(P^P)Cu(N^N)]+ is transformed to a homoleptic bisdiimine species [Cu(N^N)2]+ under oxidative conditions, which are also present during photocatalysis. In particular, resonance Raman spectroscopy in combination with electrochemistry served as a sensitive tool for the identification of the spectral signatures of complexes and side products in catalytic systems. Thereby, a deactivation pathway for the light-driven production of hydrogen by using a heteroleptic copper photosensitizer along with an iron-based water reduction catalyst could be confirmed.Acknowledgements
M. K. thanks the University of Stuttgart for a starting grant, M. K. and B. D. acknowledge financial support by the Fonds der Chemischen Industrie (FCI) and Y. Z. by the DAAD. The authors thank the COST Action CM1202.Notes and references
- N. Armaroli and V. Balzani, Angew. Chem., Int. Ed., 2007, 46, 52 CrossRef CAS PubMed.
- Q. Schiermeier, J. Tollefson, T. Scully, A. Witze and O. Morton, Nature, 2008, 454, 816 CrossRef CAS PubMed.
- S. Styring, Faraday Discuss., 2012, 155, 357 RSC.
- W. T. Eckenhoff and R. Eisenberg, Dalton Trans., 2012, 41, 13004 RSC.
- P. D. Frischmann, K. Mahata and F. Würthner, Chem. Soc. Rev., 2013, 42, 1847 RSC.
- N. Armaroli, Chem. Soc. Rev., 2001, 30, 113 RSC.
- M. Schulz, F. Dröge, F. Herrmann-Westendorf, J. Schindler, H. Görls and M. Presselt, Dalton Trans., 2016, 45, 4835 RSC.
- S.-P. Luo, E. Mejía, A. Friedrich, A. Pazidis, H. Junge, A.-E. Surkus, R. Jackstell, S. Denurra, S. Gladiali, S. Lochbrunner and M. Beller, Angew. Chem., 2013, 125, 437 CrossRef.
- E. Mejía, S. P. Luo, M. Karnahl, A. Friedrich, S. Tschierlei, A. Surkus, H. Junge, S. Gladiali, S. Lochbrunner and M. Beller, Chem.–Eur. J., 2013, 19, 15972 CrossRef PubMed.
- M. S. Lazorski and F. N. Castellano, Polyhedron, 2014, 82, 57 CrossRef CAS.
- M. Karnahl, E. Mejía, N. Rockstroh, S. Tschierlei, S.-P. Luo, K. Grabow, A. Kruth, V. Brüser, H. Junge, S. Lochbrunner and M. Beller, ChemCatChem, 2014, 6, 82 CrossRef CAS.
- A. J. J. Lennox, S. Fischer, M. Jurrat, S.-P. Luo, N. Rockstroh, H. Junge, R. Ludwig and M. Beller, Chem.–Eur. J., 2016, 22, 1233 CrossRef CAS PubMed.
- S. Fischer, D. Hollmann, S. Tschierlei, M. Karnahl, N. Rockstroh, E. Barsch, P. Schwarzbach, S.-P. Luo, H. Junge, M. Beller, S. Lochbrunner, R. Ludwig and A. Brückner, ACS Catal., 2014, 4, 1845 CrossRef CAS.
- M. Wächtler, J. Guthmuller, L. González and B. Dietzek, Coord. Chem. Rev., 2012, 256, 1479 CrossRef.
- L. Zedler, S. Kupfer, I. R. de Moraes, M. Wächtler, R. Beckert, M. Schmitt, J. Popp, S. Rau and B. Dietzek, Chem.–Eur. J., 2014, 20, 3793 CrossRef CAS PubMed.
- L. Zedler, J. Guthmuller, I. R. de Moraes, S. Kupfer, S. Krieck, M. Schmitt, J. Popp, S. Rau and B. Dietzek, Chem. Commun., 2014, 50, 5227 RSC.
- Y. Zhang, S. Kupfer, L. Zedler, J. Schindler, T. Bocklitz, J. Guthmuller, S. Rau and B. Dietzek, Phys. Chem. Chem. Phys., 2015, 17, 29637 RSC.
- T. Tsubomura, K. Kimura, M. Nishikawa and T. Tsukuda, Dalton Trans., 2015, 44, 7554 RSC.
- S. Tschierlei, M. Karnahl, N. Rockstroh, H. Junge, M. Beller and S. Lochbrunner, ChemPhysChem, 2014, 15, 3709 CrossRef CAS PubMed.
- A. K. Ichinaga, J. R. Kirchhoff, D. R. McMillin, C. O. Dietrich-Buchecker, P. A. Marnot and J. P. Sauvage, Inorg. Chem., 1987, 26, 4290 CrossRef CAS.
- W. Lafayette, C. Studies, M. W. Blaskie and D. R. McMillin, Inorg. Chem., 1980, 19, 3519 CrossRef.
- L. X. Chen, G. B. Shaw, I. Novozhilova, T. Liu, G. Jennings, K. Attenkofer, G. J. Meyer and P. Coppens, J. Am. Chem. Soc., 2003, 125, 7022 CrossRef CAS PubMed.
- J. Windisch, M. Orazietti, P. Hamm, R. Alberto and B. Probst, ChemSusChem, 2016, 9, 1719 CrossRef CAS PubMed.
- M. Sandroni, Y. Pellegrin and F. Odobel, C. R. Chim., 2016, 19, 79 CrossRef CAS.
- S. J. Lind, K. C. Gordon and M. R. Waterland, J. Raman Spectrosc., 2008, 39, 1556 CrossRef CAS.
Footnotes |
| † Electronic supplementary information (ESI) available: General information on the setup, further electrochemical data as well as UV-Vis and resonance Raman spectroelectrochemistry. See DOI: 10.1039/c6ra21469j |
| ‡ Both authors contributed equally to this work. |
| This journal is © The Royal Society of Chemistry 2016 |