 Open Access Article
Creative Commons Attribution 3.0 Unported Licence
Trapping and isolation of single prokaryotic cells in a micro-chamber array using dielectrophoresis
K.
Mogi
a,
C.
Shirataki
b,
K.
Kihara
b,
H.
Kuwahara
b,
Y.
Hongoh
b and
T.
Yamamoto
*a
aDepartment of Mechanical Engineering, Tokyo Institute of Technology, 2-12-1 Ookayama, Meguro-ku, Tokyo 152-8552, Japan. E-mail: yamamoto.t.ba@m.titech.ac.jp
bDepartment of Life Science and Technology, Tokyo Institute of Technology, 2-12-1 Ookayama, Meguro-ku, Tokyo 152-8552, Japan
First published on 22nd November 2016
Abstract
The vast majority of prokaryotic species are difficult or impossible to culture in laboratories, which makes it difficult to study these organisms using conventional biochemical techniques. Methods that enable the physical isolation of single prokaryotic cells would thus facilitate the characterization of previously unstudied organisms by eliminating or reducing the need for cultivation. Most current methods for single-cell isolation were designed for eukaryotic cells mainly of mammals, which are non-motile and much larger than prokaryotic cells. We therefore developed a micro-chamber array-based method for the isolation of single prokaryotic cells using dielectrophoresis. Here, we demonstrated the applicability of the method using two prokaryotic species, Escherichia coli (bacteria) and Haloferax volcanii (archaea), which differ both in size and biochemical composition. Our results showed that cells of either organism are trapped with an applied electric field of 5 to 20 MV m−1 and 50 kHz to 3 MHz, and that the optimum combination of dielectrophoresis voltage and frequency depends on the cell type. We suggest that this technique is useful for trapping single cells of diverse prokaryotic species.
1. Introduction
Microorganisms have adapted by a variety of means to diverse environments. Many prokaryotes exhibit industrially useful functions and their application in food production, pharmaceuticals, energy production, and many other areas are growing rapidly. For example, a microbial community present in the termite gut, can decompose recalcitrant plant polysaccharides to monomeric sugars and ferment them to hydrogen, methane, and other compounds, which might be applicable as biofuel.1 Basic scientific elucidation of the multiplex symbiotic mechanism of this community is expected to facilitate important applications in the energy industry. Effective utilization of a given microorganism's function, however, requires identification of the enzymes and other biomolecules involved and the determination of their roles in that function.More than 99% of the microorganisms that inhabit the earth are difficult or impossible to culture and study experimentally using conventional biochemical techniques. Molecular ecological techniques involving rRNA sequence analyses2–4 and metagenomics5,6 can be used to investigate the taxonomic composition and functions of a complex microbial community, but functional analysis of individual members of such communities remains still challenging. Single-cell genomics is an approach in which an individual cell is the analytical unit for genome sequencing; the functions of individual microorganisms can be predicted without the need for cultivation.7 This in turn gives rise to a new set of technical requirements, including an improvement of DNA sequencing techniques together with techniques to physically isolate individual cells. In addition, the single-cell isolation must be followed by DNA extraction and amplification of the DNA to a quantity sufficient for sequencing. Furthermore, in order to overcome the amplification bias among genome regions, recent researches have shown that reducing the reaction volume to the nanoliter-scale dramatically increases the completeness of single-cell genomes.8,9 Research into the reasons for this positive effect of miniscule volumes on the reactions is in progress. To successfully exploit this effect, a technique for capturing a single cell in a chamber with subsequent effective control of the intra-chamber solution is undoubtedly a prerequisite for microbial single-cell sequencing.
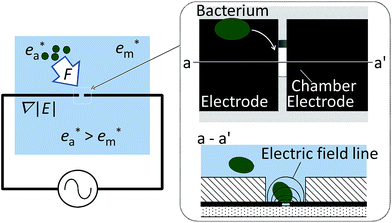
Various methods have been proposed for single-cell isolation,10 including the transport of individual cells using a micropipette,11 statistics-guided capture of single cells in micro-chambers by dilution,12,13 and the use of a microfluidic device in combination with an optical tweezer.14 In all of these techniques, however, the primary focus is on medical applications, and thus, the target cells are mainly of mammals. Typical mammalian cells are large in size, approximately 10–20 μm, and incapable of self-propulsion; therefore, relatively easy to retain.15–17 Prokaryotic cells, in contrast, are sub-micrometer to several micrometers in size, smaller in volume than eukaryotic cells by a factor of 1000 or more. Many prokaryotes are also capable of self-propulsion, thus posing the possibility of their escape following entrapment. In the design of a prokaryote-trapping device, both cell processing and cell trapping pose a high degree of difficulty and require a strategy different from those used to trap eukaryotic cells. We therefore investigated the possibility of using electrostatic forces to trap and retain single prokaryotic cells, as the scaling law indicates that these forces remain effective in miniscule spaces.18 We previously verified an array technique for entrapping single eukaryotic or prokaryotic cells using dielectrophoretic forces.19 However, the trapping chambers consisted of closed spaces with electrodes placed above and below (Fig. 1a), which precluded access to the cells from the outside and thus impeded the operations necessary for biochemical treatment of the trapped cells.20
In the present study, we developed a micro-chamber array technique to entrap single prokaryotic cells, with both of the electrodes placed at the bottom of each chamber, as shown in Fig. 1b. This arrangement facilitates access to the trapped cells from above. We tested the effectiveness of the array for capturing single prokaryotic cells and investigated the voltages and frequencies most conducive to the entrapment. We used a bacterial and archaeal species that differ markedly in size, habitat, and internal composition and may therefore be expected to require different trapping conditions. In this work, we tried to isolate single cell from cell population consisting of a single species of E. coli and H. volcanii, respectively, as the starting point.
2. Experimental
2.1 Principle of dielectrophoresis
The dielectrophoretic force acts on particles in solution upon application of a non-uniform electric field as a result of differences between the solution and the particles in complex permittivity. The force varies with the square of the gradient of the electric field strength/intensity, as| F = 2πr3ε0εmRe[K]∇E2 | (1) |
 | (2) |
 represents the complex permittivity of the particle, and
  represents the complex permittivity of the solution. The force acts in the direction of a steep electric field gradient if the Clausius–Mossotti relation shown in eqn (2) is positive and in the opposite direction if it is negative.
2.2 Method for single-prokaryotic cell trapping using the dielectrophoretic force
The dielectrophoretic device for trapping single prokaryotic cells that was constructed and used in this study (as shown schematically in Fig. 2) consists of an array of chambers, each of which contains a pair of electrodes designed to trap and retain a single cell. The chamber body is made of an insulating material, and the electric field therefore tends to be concentrated in the regions where the electrodes in the opening are in contact with the solution. Upon the generation of a strong, high-frequency electric field between the electrodes, the resulting dielectrophoretic force tends to move a prokaryotic cell through the solution and capture it in the chamber. Optimal chamber size relative to that of the cell as well as optimal applied voltage and frequency are presumably essential for single-cell trapping, as the dielectrophoretic force may fail to trap any prokaryotic cells if it is too weak, and the dielectrophoretic force may entrap an excessive number of cells if it is too strong.2.3 Sample organisms
Escherichia coli strain K12 as a model of bacteria and the extreme halophile Haloferax volcanii strain NBRC14742 as a model of archaea were chosen as the target prokaryotic species in this study in view of their differing sizes and electrification characteristic such as the composition of charged substances e.g. DNA, RNA and ions. The high conductivity of cell culture medium would require the application of an excessively strong electric field to induce dielectrophoresis; therefore, the culture medium containing E. coli cells was replaced by ion exchange – treated water after collection of the cells with centrifugation (2000 × g, 5–10 min), and the concentration was adjusted to 1.8 × 10⁶ cells per mL. These E. coli cells were used within 1 h. For H. volcanii, the culture medium was replaced with 67 mM sucrose solution and the concentration was adjusted to 7.5 × 10⁶ cells per mL. Replacement with ion exchange – treated water immediately ruptured the cells of this extreme halophile due to the osmotic pressure. The position and movement of the cells during the experiments were assessed visually by fluorescent staining with 100 nM SYBR Gold (S11494, Thermo Fisher Scientific).The permittivity and conductivity of solution was measured by a commercially available impedance analyzer (SI 1260 + 1296, Solartron), however, the remarkable difference in permittivity between pure water and the suspension includes E. coli or H. volcanii have not confirmed. The conductivity of both the suspensions differed from 1 μS cm−1 to 200 mS m−1 depending on the condition of samples. Our trapping condition was worked well regardless of the validation in conductivity. It is therefore supposed that the generated dielectrophoresis would be mainly caused by the property of E. coli and H. volcanii themselves, such as size, shape cell permittivity, etc.
2.4 Device fabrication
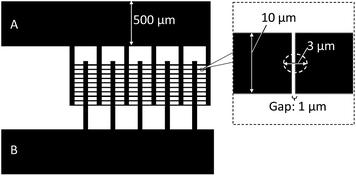
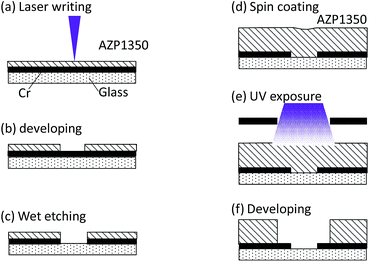
In the basic design, as shown schematically in Fig. 3, the dielectrophoretic prokaryote-trapping device consists of a two-layer structure of electrodes underlying an array of trapping chambers. The device was fabricated by patterning interdigital electrodes as the first layer on a quartz substrate and then patterning the chambers using a second-layer photoresist. The inset in Fig. 3 shows a magnified image of the cell-trapping area between the electrode gaps. The size of an E. coli cell was approximately 0.5 μm × 2 μm; a trapping chamber with 3 μm diameter and 2 μm height, placed on a 1 μm gap between electrodes with 10 μm width was designed. A large electrode width relative to the chamber diameter was adopted to provide tolerance for positional errors due to vertical displacement during chamber fabrication. To minimize the background reflection of fluorescence excitation emission (10% reflection ratio at 436 nm) and the electrode reaction, during device fabrication, we used an electrode substrate consisting of a CrO film of 30 nm thickness deposited on Cr of 62 nm thickness on a quartz plate (CBL5006Du-AZP, Clean Surface Technology Co.). The CrO film was coated on the quartz by rf-magnetron sputtering (Model CFS-4EP-LL, Shibaura Mechatronics Co.). As shown in Fig. 4, fabrication proceeded in the following steps: film formation on the Cr/CrO plate by spin coating positive photoresist (AZP1350, AZ Electronic Materials plc) to 540 nm thickness for 60 s at 3000 rpm, with direct writing of the electrode pattern on the plate (Fig. 4a) using a laser writing system (DWL66fs, Heidelberg Instruments); pattern formation by development (Fig. 4b) and etching (Fig. 4c); spin coating by AZP1350 photoresist at 2000 rpm for 30 s (Fig. 4d); thermal curing at 100 °C for 1 min; trapping chamber pattern exposure (Fig. 4e); and chamber formation by AZP1350 development (Fig. 4f). Fig. 5 shows the photo of the fabricated device.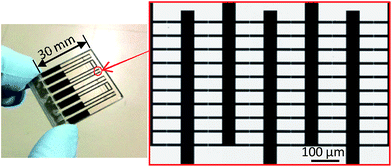 | ||
| Fig. 5 Photo of the fabricated device. Several pattern of electrode units are assembled on the device. | ||
2.5 Experimental setup
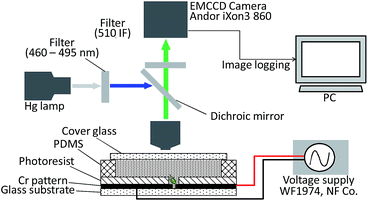
Fig. 6 shows the setup used in the experiments. The device was placed on a fluorescence microscope (BX51, Olympus) stage, and each experiment was performed under fluorescence imaging. The fluorescent images of the cells were acquired as 16 bit Tiff images using an EM-CCD camera (iXon Ultra, Andor). Electric power for dielectrophoresis was supplied by a function generator (WF1974, NF Corp.). To retain the sample solution and permit observation of the trapping chamber, a silicone film of 50 μm thickness (10186-0001-9, MORITEQ co ltd.) containing a hole with 3 mm in diameter by a punch (Seiken Torepan, Kai Industries) centered above the chamber was placed on the device; the hole was sealed with a cover glass following an addition of sample solution, and the interior was observed through the cover glass during the experiment. There was no leakage observed between the silicone film and chamber surface by an optical microscope, thus it was confirmed that the hermetic sealing by the inherent natural stickiness of silicone was enough to seal between them.3. Results and discussion
3.1 Trapping of E. coli cells
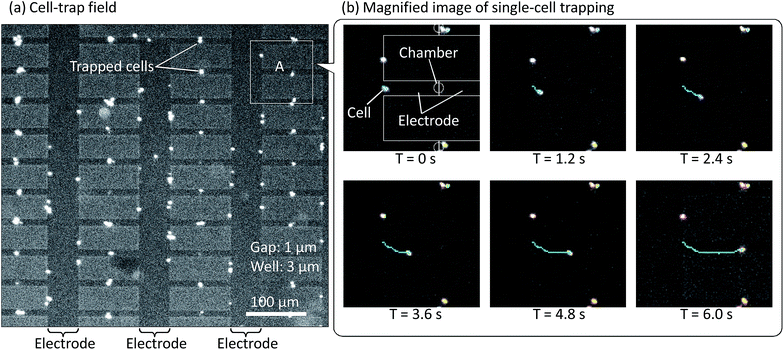
Given that trapping of prokaryotic cells using dielectrophoretic forces is dependent on the conductivity, permittivity, and other physical properties of the microorganisms and the solution as well as on the intensity, frequency, and other parameters of the electric field, we first tried capture of E. coli cells in water and investigated the dependence of trapping on the electric field strength and frequency. We dripped 10 μL of E. coli cell suspension onto the substrate electrodes, applied voltages in the range of 0 to 20 V and frequencies in the range of 20 kHz to 3 MHz to generate differing dielectrophoretic forces, and observed the effects on E. coli trapping. The success of trapping and its ratio were determined from the intensity of fluorescence emitted by the cells. Effect of the direct dropping is negligible error. We have never confirmed direct dropping for the experiment time; 10 min at a maximum.Fig. 7 shows the results of E. coli trapping with 20 V at 100 kHz in the lattice-array chambers. E. coli cells, shown as the white dots in Fig. 7, were trapped in 33 of the 40 chambers. Fig. 7b shows video snapshots of the entrapment in chamber A, which is indicated by a white square in Fig. 7a. The time series of these snapshots shows that an E. coli cell was drawn toward and into the chamber from an initial position approximately 50 μm away. As shown by the traces in this snapshot sequence, which indicates the direction and distance of cell travel, the speed of cell movement increased as the cell approaches and enters the chamber, presumably due to the increasing dielectrophoretic force. Trapping also occurred at the electrode edges outside the chamber, as an effect of the direction of the dielectrophoretic force toward the edges, which is the direction of increasing electric field gradient. The effect of the electrode edges was strongest for those edges within the chamber, which face the solution, but even for those edges outside the chamber and unexposed to the solution, the force leakage was presumably sufficient for cell entrapment. These experimental results clearly indicate that in the course of movement ending in the chamber, the cell tended to move first to the nearest electrode edge and then along that edge toward the chamber until it was finally drawn into the region of the electrode gap, where the dielectrophoretic force was strongest.
Fig. 8 shows the relationship between the number of prokaryotic cells trapped in a chamber and the average fluorescent intensity in the chamber. Although E. coli cells are not spherical and the fluorescence intensity therefore can vary with its orientation, the results showed good linearity between the number of trapped E. coli cells and the luminance taken as the intensity of the chamber area. When five or more cells were trapped in a single chamber, however, accurate measurement became difficult and measurement error increased, apparently as a result of overlapping cells.
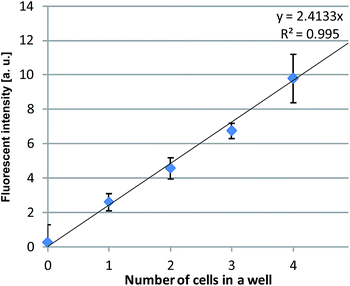 | ||
| Fig. 8 Relationship between the number of trapped cells in the trapping chamber and the averaged fluorescent intensity in the chamber. The error bar shows the standard deviation of the intensity. | ||
In summary, these results showed that during trapping of single to a few number of prokaryotic cells, the number of cells trapped in each chamber can be precisely quantified based on the fluorescence intensity of that chamber.
We next investigated the conditions under which trapping is facilitated, in terms of applied electric field strength (volts per μm) and frequency. Quantitative determination of the generated trapping strength is difficult, and we therefore proceeded by dividing the applicable field strengths and frequencies into several different practical regions, assessing the possibility of trapping for each region and then narrowing in on the optimum region. In the assessment, we simply entered a checkmark (as shown in Table 1) for each case in which trapping occurred without assessing the number of trappings in each chamber or the proportion of chambers in which trapping occurred, and we found that with an electric field strength of ≥5 MV m−1, trapping was successful over the frequency region 50 kHz to 3 MHz.
| 20 kHz | 50 kHz | 100 kHz | 500 kHz | 3 MHz | |
|---|---|---|---|---|---|
| 5 V | — | — | — | — | — |
| 10 V | — | ✓ | ✓ | ✓ | ✓ |
| 20 V | — | ✓ | ✓ | ✓ | ✓ |
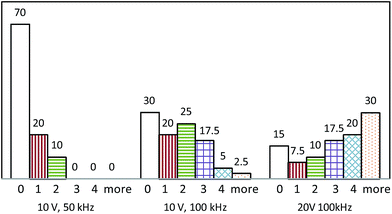
As shown by the histograms in Fig. 8, for chambers each trapping a given number of cells, normalized to the total number of chambers at various voltage and frequency combinations, 20% of chambers trapped just one cell at 10 V/50 kHz and 10 V/100 kHz, but only 7.5% of chambers trapped one cell at 20 V/100 kHz. In addition, the proportion of chambers trapping no cells rose to 70% at 10 V/50 kHz, thus revealing a trend in which the proportion of chambers with no trapped cell decreased with an increase in either the applied voltage or applied frequency, and the proportion of chambers trapping three or more cells increased with an increase in either voltage or frequency and was highest at 20 V/100 kHz. As shown in eqn (1), the dielectrophoretic force is proportional to ∇E2, and on this basis, the magnitude of the force can be controlled by changing the level of applied voltage.
With regard to frequency dependence, on the other hand, the optimum frequency is presumably determined by the balance between the complex permittivities of the prokaryotic cells and the solvent. The assessment of optimum frequency would require a different device design and measurement apparatus, and therefore was not within the scope of the present study. Our results nonetheless show that the number of trapped cells can be increased by increasing the applied voltage and thus the dielectrophoretic force, and that the applied voltage and frequency are key parameters for controlling the number of prokaryotic cells trapped in individual chambers. Although the experimental data are not shown here, the number of cells trapped in the chambers is also strongly affected by the solvent composition and the concentration of cells in solution; for optimization of the trapping conditions, it will be necessary to consider various parameters in addition to the applied voltage and frequency.
3.2 H. volcanii trapping
We also investigated the trapping of an archaeon, H. volcanii, which differs from E. coli in both size and electrical properties. H. volcanii is a Gram-negative extreme halophile with a cell size of approximately 1–2 μm, which is smaller than that of E. coli. The internal composition and concentrations of electrolytes in H. volcanii may also be expected to differ from E. coli as a result of its adaptation to environments with high salt concentrations, and therefore, the optimum frequency for trapping H. volcanii cells would be expected to differ from that for trapping E. coli.As described in the Experimental section, this investigation was performed using H. volcanii cells in a sucrose solution in order to avoid the rupturing of cells due to the high osmotic pressure that would occur in the ion exchange – treated water used in the E. coli experiments. Cell aggregation tended to occur in the sucrose solution, presumably as a result of viscous liquid secretion, which impeded accurate cell counting. Quantitative determinations such as those shown for E. coli in Fig. 9 were therefore impractical. H. volcanii trapping was nevertheless successful at the applied voltages and frequencies indicated by the checkmarks in Table 2. In comparison with the result of E. coli trapping, it is remarkable difference that H. volcanii trapping required a higher applied voltage at 50 and 100 kHz. In other words, trapping force of H. volcanii was weaker at those frequencies. At frequencies of 500 kHz and higher, however, trapping occurred even at applied voltages of 5 and 10 V. These results indicate that, as expected, an optimum frequency region exists for H. volcanii trapping, and this optimum frequency is higher than for E. coli.
| 20 kHz | 50 kHz | 100 kHz | 500 kHz | 3 MHz | |
|---|---|---|---|---|---|
| 5 V | — | — | — | ✓ | ✓ |
| 10 V | — | — | — | ✓ | ✓ |
| 20 V | — | ✓ | ✓ | ✓ | ✓ |
In summary, the results obtained for E. coli and H. volcanii showed that the optimum frequency and electric field for successful single-cell trapping with this method vary according to the morphology and the electrical properties (permittivity and conductivity) of the cell and the solvent. Our results do provide a basic guideline of 5 to 20 MV m−1 and 50 kHz to 3 MHz as electric field strengths and frequencies, respectively, at which trapping is possible.
4. Conclusions
This study clarified the relationship between applied voltage and frequency for trapping two different types of prokaryotic cells (E. coli and H. volcanii) in a newly designed and constructed micro-chamber array. Our results showed that the optimum voltage and frequency combination depends on the cell type, although cells of either organism can be trapped with an applied electric field of 5 to 20 MV m−1 and 50 kHz to 3 MHz, which strongly suggests that other prokaryotes can also be trapped in that range.Quantification of the chamber trapping ratio was impracticable for H. volcanii because of its cell aggregation, but for E. coli, the results showed a probability of up to 20% for trapping a single cell in a chamber and a ratio of 82.5% (33 of 44 chambers) for successful trapping of one or more cells per chamber.
Further studies will include assessment and optimization of the relative size between the chamber and the microbial cell, in order to reduce the occurrence of multi-cell trapping by single chambers and thus increase the efficiency of single-cell trapping. Further studies will also involve refinements based on cell and solvent permittivity and conductivity as well as cell size and shape in order to increase the degree of certainty of single-cell trapping. With progress in these studies, the single-cell trapping technique that we describe here could become a key component of single-cell analyses.
Acknowledgements
This study was supported by JST-CREST (JY261005).References
- Y. Hongoh, Cell. Mol. Life Sci., 2011, 68, 1311–1325 CrossRef CAS PubMed.
- D. A. W. Soergel, N. Dey, R. Knight and S. E. Brenner, ISME J., 2012, 6, 1440–1444 CrossRef CAS PubMed.
- A. Klindworth, E. Pruesse, T. Schweer, J. Peplies, C. Quast, M. Horn and F. O. Glockner, Nucleic Acids Res., 2013, 41, e1Je1 CrossRef PubMed.
- B. Snel, P. Bork and M. A. Huynen, Nat. Genet., 1999, 21, 108–110 CrossRef CAS PubMed.
- M. G. I. Langille, J. Zaneveld, J. G. Caporaso, D. McDonald, D. Knights, J. A. Reyes, J. C. Clemente, D. E. Burkepile, R. L. V. Thurber, R. Knight, R. G. Beiko and C. Huttenhower, Nat. Biotechnol., 2013, 31, 814–821 CrossRef CAS PubMed.
- J. J. Qin, Y. R. Li, Z. M. Cai, S. H. Li, J. F. Zhu, F. Zhang, S. S. Liang, W. W. Zhang, Y. L. Guan, D. Q. Shen, Y. Q. Peng, D. Y. Zhang, Z. Y. Jie, W. X. Wu, Y. W. Qin, W. B. Xue, J. H. Li, L. C. Han, D. H. Lu, P. X. Wu, Y. L. Dai, X. J. Sun, Z. S. Li, A. F. Tang, S. L. Zhong, X. P. Li, W. N. Chen, R. Xu, M. B. Wang, Q. Feng, M. H. Gong, J. Yu, Y. Y. Zhang, M. Zhang, T. Hansen, G. Sanchez, J. Raes, G. Falony, S. Okuda, M. Almeida, E. LeChatelier, P. Renault, N. Pons, J. M. Batto, Z. X. Zhang, H. Chen, R. F. Yang, W. M. Zheng, S. G. Li, H. M. Yang, J. Wang, S. D. Ehrlich, R. Nielsen, O. Pedersen, K. Kristiansen and J. Wang, Nature, 2012, 490, 55–60 CrossRef CAS PubMed.
- C. Gawad, W. Koh and S. R. Quake, Nat. Rev. Genet., 2016, 17, 175–188 CrossRef CAS PubMed.
- Y. Marcy, T. Ishoey, R. S. Lasken, T. B. Stockwell, B. P. Walenz, A. L. Halpern, K. Y. Beeson, S. M. D. Goldberg and S. R. Quake, PLoS Genet., 2007, 3, 1702–1708 CAS.
- J. Gole, A. Gore, A. Richards, Y. J. Chiu, H. L. Fung, D. Bushman, H. I. Chiang, J. Chun, Y. H. Lo and K. Zhang, Nat. Biotechnol., 2013, 31, 1126–1132 CrossRef CAS PubMed.
- A. Gross, J. Schoendube, S. Zimmermann, M. Steeb, R. Zengerle and P. Koltay, Int. J. Mol. Sci., 2015, 16, 16897–16919 CrossRef CAS PubMed.
- R. Ungai-Salanki, T. Gerecsei, P. Furjes, N. Orgovan, N. Sandor, E. Holczer, R. Horvath and B. Szabo, Sci. Rep., 2016, 6, 20375 CrossRef CAS PubMed.
- T. Thorsen, S. J. Maerkl and S. R. Quake, Science, 2002, 298, 580–584 CrossRef CAS PubMed.
- N. Yoshimoto, A. Kida, X. Jie, M. Kurokawa, M. Iijima, T. Niimi, A. D. Maturana, I. Nikaido, H. R. Ueda, K. Tatematsu, K. Tanizawa, A. Kondo, I. Fujii and S. Kuroda, Sci. Rep., 2013, 3, 1191 Search PubMed.
- A. Wolff, I. R. Perch-Nielsen, U. D. Larsen, P. Friis, G. Goranovic, C. R. Poulsen, J. P. Kutter and P. Telleman, Lab Chip, 2003, 3, 22–27 RSC.
- S. Yamamura, H. Kishi, Y. Tokimitsu, S. Kondo, R. Honda, S. R. Rao, M. Omori, E. Tamiya and A. Muraguchi, Anal. Chem., 2005, 77, 8050–8056 CrossRef CAS PubMed.
- A. Y. Fu, C. Spence, A. Scherer, F. H. Arnold and S. R. Quake, Nat. Biotechnol., 1999, 17, 1109–1111 CrossRef CAS PubMed.
- A. R. Liberski, J. T. Delaney and U. S. Schubert, ACS Comb. Sci., 2011, 13, 190–195 CrossRef CAS PubMed.
- T. Yamamoto and T. Fujii, Nanotechnology, 2007, 18, 495503 CrossRef PubMed.
- S. H. Kim, T. Yamamoto, D. Fourmy and T. Fujii, Biomicrofluidics, 2011, 5, 024114 Search PubMed.
- S. H. Kim, T. Yamamoto, D. Fourmy and T. Fujii, Small, 2011, 7, 3239–3247 CrossRef CAS PubMed.
| This journal is © The Royal Society of Chemistry 2016 |


