Controlled synthesis of porous Co3O4 nanofibers by spiral electrospinning and their application for formaldehyde oxidation

Yuxiao Wu, Ming Ma, Bing Zhang, Yunhua Gao, Weipeng Lu* and Yanchuan Guo*
Key Laboratory of Photochemical Conversion and Optoelectronic Material, Technical Institute of Physics and Chemistry, Chinese Academy of Sciences, Beijing 100190, China. E-mail: luweipeng@mail.ipc.ac.cn; Fax: +86-10-62554670; Tel: +86-10-82543445

Received 23rd August 2016 , Accepted 12th October 2016

First published on 12th October 2016


Abstract

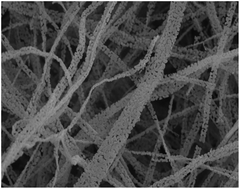
Nanofiber mats have been widely used in various fields owing to their high porosity, high specific area and three-dimensional architecture. Porous cobaltosic oxide (Co3O4) nanofiber mats were mass-produced by spiral electrospinning and controlled calcination, after which the three-dimensional scaffold still existed and consisted of well-twisted continuous nanofibers. The nanofiber was composed of neat Co3O4 nanoparticles with a necklace-like arrangement. The mechanism for the formation of porous Co3O4 necklaces was proposed by investigating the structural evolution of the calcined fibers, their elemental composition, crystal structure and the presence or absence of different functional groups. Moreover, the porous Co3O4 nanofiber mats exhibited high catalytic activity (98 °C, 100% conversion) and catalytic stability (160 h, nearly 100% conversion) for the oxidation of formaldehyde, which was mostly attributed to the increases in the porosity and the specific area.

Introduction

Metal-oxide nanofiber mats have attracted intensive interest owing to their unique catalytic, optical and physicochemical properties.1–5 These properties are closely related to their shape, high special area and high porosity.6–9 Conventional synthetic approaches that have been applied for the fabrication of nanofibers include drawing, self-assembly, electrospinning, phase separation and template synthesis.10–14 Among these, electrospinning has attracted more academic attention owing to its noticeable advantages over other techniques, including simplicity, adaptability, cost effectiveness and easy fabrication.12–14 Metal-oxide nanofibers prepared from electrospinning have found many important applications in various fields, such as catalysis, adsorption, chemical gas sensors and lithium ion batteries.15–20 However, the inability to design and mass-produce neat nanostructures are still two important factors that limit the catalytic efficiency and practical application of metal-oxide nanofibers.

In recent years, many high-throughput configurations have been designed for the mass-production of nanofibers. Single-needle electrospinning, as a standard electrospinning setup, is inefficient for commercial applications of nanofibers owing to the low production rate (0.01–0.1 g h−1).21 Simply increasing the nozzle number may improve the production rate of nanofibers, but a complicated interaction between the nozzles would lead to non-uniform nanofibers.22 Therefore, needleless electrospinning setups have attracted much attention over the past decades. Lu et al. designed a metal rotating cone as the spinneret to electrospin a polyvinylpyrrolidone (PVP) solution.23 Lomov et al. presented a novel technique using a needle-disk as the spinneret to enhance nanofiber throughput and maintain high quality nanofibers.24 Bhattacharyya et al. produced poly(vinyl alcohol) nanofibers by the method of free surface electrospinning from a wire electrode.25 Moreover, a number of researchers have made great efforts to design new nanostructured fibers by electrospinning. For example, Wang et al. prepared porous Fe2O3 nanotubes by generic electrospinning and calcining;26 Li et al. synthesized hollow ZnO–SnO2 core–shell nanofibers by electrospinning and a hydrothermal method;27 Mauro et al. obtained SiO2 microsphere nanofibers by combing electrospinning and sol–gel processes;28 Zhan et al. synthesized magnetic mesoporous γ-Fe2O3@Ti0.9Si0.1O2 core–shell nanofibers using sol–gel chemistry combined with coaxial electrospinning.29 The nanofibers with unique nanostructures suitably met the demands of the specific application. However, the formation mechanism of the microstructure needs to be further investigated to achieve controllable fabrication of nanofibers.

Formaldehyde (HCHO) has been regarded as an indoor air pollutant owing to its serious and hazardous effects on human health.30 Various methods have been used to combat formaldehyde pollution, such as adsorption, photo-catalysis, plasma technology and catalytic oxidation.31–33 Among these methods, low-temperature catalytic oxidation, which degrades formaldehyde into carbon dioxide and water, has been regarded as the most promising method; the choice of catalytic materials is important. Currently, transition-metal oxides and composite oxides have been tested for catalytic oxidation of formaldehyde, but high reaction temperatures and moderate catalytic efficiency are the obstacles to their application. There are two ways to enhance their catalytic activity. One way is to dope with a noble metal to provide sufficient metal active sites for the oxidation of HCHO, such as Pt/TiO2, Ag/MnO2, Au/ZrO2, Au/Fe2O3, Au/Co3O4–CeO2 and Ag/SBA-15.34–39 These catalysts possess higher HCHO catalytic activity at low temperature. However, the high cost of the supported noble metals limits their widespread application. The other way is to change the nanostructure or morphology to enhance the catalytic activity and expose more active sites to the reactants, such as with mesoporous Co–Mn, 3D-Co3O4 and 3D mesoporous Cr2O3.40–42 Nevertheless, these nanomaterials still face a common challenge to improve the structure control and the catalytic efficiency.

In this study, Co3O4 “nano-necklaces” were mass-produced by spiral electrospinning and controlled calcination. The productivity was ∼20 g h−1, which was hundreds of times higher than that of traditional needle electrospinning. A possible mechanism for the formation of the controllable Co3O4 nanomaterials was proposed based on the sequential structural evolution from nanofibers to necklaces. To evaluate the catalytic properties of these porous Co3O4 necklaces for the treatment of indoor air pollution, samples acquired at different calcining temperatures were applied for the catalytic oxidation of formaldehyde.

Experimental

Chemical and materials

Cobaltous nitrate hexahydrate (Co(NO3)2·6H2O), ethanol (>99.7%) and polyvinylpyrrolidone (PVP, Mw = 30[thin space (1/6-em)]000) were purchased from Beijing Chemical Reagent Company (Beijing, China). All the chemicals were analytical grade reagents and used without further purification.

Preparation of Co3O4 nanofibers

A PVP solution was prepared by dissolving 30.0 g of PVP powder in 270 g of ethanol at ambient temperature under continuous mechanical stirring for 2 h. Then 29.1 g of Co(NO3)2·6H2O was added to the solution. After complete dissolution, the solution was poured into the Teflon reservoir and electrospun for 2 hours. A positive potential of 65 kV was applied between the spinneret and the grounded collector with a distance of approximately 16 cm. Finally, the fibers were dried in an oven for 4 h at 60 °C. We obtained 41.2 g of electrospun nanofibers and the productivity was 21.6 g h−1.

The as-spun nanofibers were annealed from room temperature to the final temperatures (180 °C, 350 °C, 500 °C, 600 °C, and 800 °C) in a ceramic crucible with a heating rate of 10 °C min−1, and then the tube furnace was cooled to room temperature. The samples were denoted as S20, corresponding to the spun nanofibers themselves, and S180, S350, S500, S600 and S800, corresponding to the nanofibers annealed at 180 °C, 350 °C, 500 °C, 600 °C and 800 °C, respectively. Six parallel tests were carried out to analyze the properties of the nanofibers.

Characterization

Morphological investigations of the samples were made by an S-4800 scanning electron microscope (SEM, Hitachi, Japan). The functional groups in the samples were characterized by FT-IR. X-ray diffraction (XRD) patterns were obtained on a Bruker D8 Focus X-ray diffractometer using Cu-Kα radiation; the data were collected at a scanning rate of 0.1 s per step over the 2θ range from 10° to 80°. The transmission electron microscope (TEM) images were recorded on a JEOL JEM-2100 instrument at a voltage of 200 kV. Thermogravimetric analysis (TGA) was performed on a Rigaku Standard Model thermal analyzer in air with a heating rate of 10 °C min−1. Specific surface areas were calculated by the Brunauer–Emmett–Teller (BET) method and the average pore sizes were estimated from the adsorption branch of the isotherm by the Barrett–Joyner–Halenda (BJH) formula. The elemental analysis was performed on an Elementar Vario MICRO CUBE (Germany) and ICP-OES, and the oxygen content was calculated by difference.

Catalytic oxidation of HCHO

The catalytic oxidation of formaldehyde was performed in a quartz tubular fixed-bed reactor (Φ = 10 mm) with 100 mg of catalyst. HCHO was generated using a controlled purified air flow that passed through a HCHO-saturated solution in an incubator maintained at 0 °C. The total flow rate was 50 mL min−1 and contained 400 ppm of HCHO. The space velocity was 30[thin space (1/6-em)]000 mL (gcat h)−1. The products of the reaction were analyzed with an online Agilent 6890 gas chromatograph using Propark-Q as the separation column equipped with an FID and Ni catalyst converter, which was used to quantitatively convert the carbon oxides into methane in the presence of hydrogen before the detector. The HCHO conversion was calculated based on the yield of CO2 content as follows:
image file: c6ra21172k-t1.tif
where [CO2]out and [HCHO]in represent the CO2 concentration in the products and the HCHO concentration in the flow gas, respectively.

Results and discussion

TGA and SEM were carried out to investigate the decomposition process of the Co(NO3)2/PVP composite nanofibers. As shown in Fig. 1 and 2, the as-spun nanofibers possessed a continuous fibrous morphology and smooth surfaces without any pores or structural defects. During annealing, the nanofibers underwent four stages of weight loss. The first stage occurred from 20 °C to 180 °C and was associated with a 16.48% weight loss, which was attributed to the loss of physisorbed water. However, the weight loss had little effect on the fiber morphology; only small projections appeared on the smooth surface of the nanofibers. The second stage occurred from 180 °C to 340 °C and was associated with a weight loss of 26.36%, which was mainly attributed to the decomposition of cobalt nitrate and the degradation of PVP. The decomposition of cobalt nitrate led to the formation of Co3O4 nanocrystals, which were aggregated in a confined area to form nanoparticles. The degradation of PVP resulted in shrinkage of the polymer into a small area, and these changes caused the formation of extensive micropores on the fiber surface and the decrease of the fiber diameter (Fig. 2c). The third stage was from 340 °C to 500 °C and was associated with a mass loss of 31.82%, which was ascribed to the oxidation of residual PVP and carbon from the residue remaining after the decomposition of PVP. The nanofibers were transformed into “necklaces” composed of interconnected nano-sized particles (Fig. 2d). There was almost no weight loss as the calcining temperature was increased to 600 °C; the only change that occurred during this stage was the merging and growth of the particles (Fig. 2e). At temperatures above 600 °C the Co3O4 nanoparticles merged with adjacent particles, and the prominent shrinkage along the nanofibers caused the fracture of the fibers (Fig. 2f).
image file: c6ra21172k-f1.tif
Fig. 1 TGA curve of electrospun Co(NO3)2/PVP nanofibers.

image file: c6ra21172k-f2.tif
Fig. 2 SEM images of the Co(NO3)2/PVP nanofibers calcined at different temperatures (a: S20, b: S180, c: S350, d: S500, e: S600, f: S800).

To further elucidate the changes in the structure of the nanofibers, the TEM images of S350, S500, and S600 were analyzed. Fig. 3a (S350) clearly shows the formation of Co3O4 nanoparticles and the porous surface structure, which was consistent with the SEM analysis. Notably, a layer (3–5 nm) covered the surface of the particles was formed by the residual PVP and the residues from the decomposition of PVP. The TEM images of S500 were investigated to better understand the crystal structure of Co3O4 (Fig. 3b), and the disappearance of the PVP layer suggested the complete decomposition of PVP. The high-resolution transmission electron microscopy (HRTEM) image of S500 (inset of Fig. 3b and d) showed clear lattice fringes of 0.467 nm corresponding to the crystallographic (111) plane of Co3O4, which indicated that the S500 sample was structurally uniform and well crystallized. Due to the high temperature and particle growth, S600 (Fig. 3c) possessed a filled structure with negligible pore volume between the nanoparticles.


image file: c6ra21172k-f3.tif
Fig. 3 TEM images of (a) S350, (b) S500, (c) S600 and (d) HRTEM image of S500.

X-ray diffraction (XRD) was performed to investigate the structural evolution of the fibers, which proceeded from a smooth fiber to a nano-necklace. As shown in Fig. 4, there was almost no diffraction peak in the spectra of S20 and S180, which indicated that amorphous Co(NO3)2 was evenly dispersed throughout the entire cross-section of the nanofibers. PVP was the major constituent of the sample. Several small peaks appeared in the spectrum of S350, suggesting that Co had started to gather. Co3O4 nucleated gradually and grew preferentially on the (311) plane. As the temperature increased, Co3O4 nanocrystals (S500, S600) nucleated gradually and grew preferentially on the (111), (220), (311), (511) and (400) planes, which was similar to previous literature reports, where Co3O4 crystallized at temperatures above 300 °C.43,44 The diffraction peaks of Co3O4 nanocrystals became sharper and the intensity was stronger as the temperature increased, indicating that Co3O4 possessed a highly crystalline structure. All the diffraction peaks were well indexed to the spinel-type structure (JCPDS no. 65-3103).


image file: c6ra21172k-f4.tif
Fig. 4 XRD spectra of the as-spun nanofibers and the electrospun nanofibers calcined at different temperatures.

The change in composition and nanostructural evolution of the samples could also be confirmed by FT-IR. As shown in Fig. 5, the characteristic peaks at approximately 3433 cm−1 were assigned to the –OH group and H–O–H stretching vibrations of the water molecules. The peak was more prominent in S20 and S180 owing to the presence of combined water molecules. There was no distinct difference between the spectra of S20 and S180, which suggested that the decomposition of PVP did not occur at a temperature below 180 °C. The adsorption peaks at 2927 cm−1 and 2956 cm−1 were assigned to the stretching vibrations of the C–H band of PVP, and the peaks between 1250 cm−1 and 1500 cm−1 originated from the bending vibrations of C–H and C–N, respectively. The peaks resulting from PVP tended to decrease as the temperature increased, and almost disappeared above 500 °C, which indicated that PVP started to decompose between 180 °C and 350 °C and was completely decomposed at 500 °C. The intensity of the band at 1648 cm−1, attributed to the C[double bond, length as m-dash]O stretching vibrations of PVP, decreased and even disappeared as the calcining temperature increased from 180 °C to 500 °C, suggesting that the decomposition of PVP was accompanied by the formation of carbon dioxide. The adsorption bands at 660 cm−1 and 789 cm−1, assigned to Co–O, were more apparent as the temperature increased, particularly above 350 °C. Combined with the XRD analysis, these results show that the crystallization of Co3O4 was accompanied by the degradation of PVP.


image file: c6ra21172k-f5.tif
Fig. 5 FTIR spectra of the as-spun nanofibers and electrospun nanofibers calcined at different temperatures.

The elemental analysis of the samples is provided in Table 1 and the EDS spectra of S20 and S500 are shown in Fig. 6. For all the samples, the Co content increased from 18.01% to 73.42% as the temperature increased from 20 to 800 °C because of the loss in weight of the sample, whereas the total mass of Co did not vary. A large amount of N (12.04%) and H (4.06%) was present in the as-spun nanofibers. It would be impossible for each element to be entirely derived from only one constituent (for example, if N was entirely from PVP, the PVP content would be over 100 wt%); therefore, H2O, Co(NO3)2 and PVP coexisted in the S20 sample (Fig. 6a). Compared with S20, only the mass of hydrogen and oxygen decreased in S180, which confirmed that only water evaporated below 180 °C. As the temperature increased, the content of C, H and N decreased sharply and even disappeared at higher temperatures (500–800 °C). Finally, only Co and O remained at a Co[thin space (1/6-em)]:[thin space (1/6-em)]O molar ratio of approximately 3[thin space (1/6-em)]:[thin space (1/6-em)]4 (Fig. 6b). These findings indicate that the decomposition of Co(NO3)2 was accompanied by the degradation of PVP.

Table 1 Ultimate analysis of the as-spun nanofibers and the electrospun nanofibers calcined at different temperatures
Ultimate analysis (%) S20 S180 S350 S500 S600 S800
Carbon 17.95 21.49 32.06      
Hydrogen 4.06 2.69 3.58      
Oxygen 47.93 40.06 19.90 26.58 26.58 26.58
Nitrogen 12.04 14.21 6.20      
Cobalt 18.01 21.56 38.26 73.42 73.42 73.42


image file: c6ra21172k-f6.tif
Fig. 6 EDS spectra of (a) S20 and (b) S500.

To characterize these porous nanofibers further, the N2 adsorption–desorption isotherms and the pore diameter distributions of all the samples are shown in Fig. 7, and a summary of the specific surface area, pore volume and average pore diameter data is shown in Table 2. All the samples exhibited the characteristic type IV isotherms with H3-type hysteresis loops, indicating the presence of uniform micro-porous structure. The specific areas of the S20, S180, S350, S500, S600 and S800 nanofibers were 72.16, 93.35, 306.77, 561.32, 450.99 and 406.34 m2 g−1, respectively, and the corresponding pore volumes were 0.035, 0.057, 0.344, 0.636, 0.511 and 0.338 cm3 g−1. It is evident that the as-spun nanofibers had a lower surface area and pore volume, which suggested that mesoporous channels did not exist in the S20 nanofibers. With the increase of calcining temperature, the surface area and pore volumes first increased owing to the formation of mesoporous channels and then decreased because of the particle growth and destruction of the mesopores at higher temperatures (600 °C and 800 °C). Therefore, S500 had the largest surface area and pore volume, which indicated that the material should exhibit higher catalytic activity owing to the increase of catalytic sites. This was confirmed by the subsequent formaldehyde oxidation reactions. Moreover, the pore size distribution of the samples was 4.27–6.52 nm, suggesting that the calcining temperature had an effect on the pore diameter.


image file: c6ra21172k-f7.tif
Fig. 7 (a) N2 adsorption–desorption isotherms and (b) pore diameter distribution of the as-spun nanofibers and electrospun nanofibers calcined at different temperatures.
Table 2 Specific area distribution, pore volume distribution and pore diameter distribution of the spun nanofibers and the electrospun nanofibers calcined at different temperatures
Materials S20 S180 S350 S500 S600 S800
Specific area (m2 g−1) 72.16 93.35 306.77 561.32 450.99 406.34
Pore volume (cm3 g−1) 0.035 0.057 0.344 0.636 0.511 0.338
Pore diameter (nm) 6.52 5.91 4.83 4.27 4.54 4.89


The catalytic activities of the samples were evaluated for the oxidation of HCHO, as shown in Fig. 8a. At temperatures below 70 °C, all the HCHO conversions were quite low (<20.1%). At higher temperatures, the S20 and S180 displayed the lowest catalytic activity, whereby the HCHO conversion was less than 28.69% at 200 °C. The S500 exhibited the best catalytic oxidation activity, entirely converting HCHO at 98 °C. For the catalytic mechanism of HCHO oxidation, adsorption of substrate was the first step. The HCHO adsorbed on the Co3O4 surface and Co3+ in Co3O4 was reduced to Co2+ with the formation of ·CHO surface species. With nucleophilic attack of surface oxygen species, the ·CHO species were oxidized to generate HCOO species and further oxidized to form HCO·3− species. Then, H2CO3 was generated from HCO·3− species by combination with H+ and finally decomposed into CO2 and H2O.45–47 The mesoporous structure composed of porous nanofibers was favorable for the oxidation of formaldehyde. The larger surface area and pore volume could enhance the adsorption of HCHO molecules, provide more catalytic sites (Co3+) and have abundant surface oxygen species that result from the lattice defects and oxygen vacancies. Thus S500, which had the largest surface area and pore volume, exhibited the highest catalytic oxidation activity. S350, S600 and S800 displayed moderate oxidation activity, entirely converting HCHO at 155 °C, 120 °C and 127 °C, respectively, which could be because of the formation, or the disappearance, of mesoporous channels. In addition, the catalytic stability of S500 was investigated at a temperature of 98 °C (Fig. 8b). The results indicated that the conversion of formaldehyde remained at ∼100% after 160 h suggesting that S500 possessed good catalytic stability.


image file: c6ra21172k-f8.tif
Fig. 8 (a) Catalytic activity of S20, S180, S350, S500, S600 and S800 at different temperatures and (b) catalytic stability of S500 at 98 °C (reaction conditions: HCHO concentration = 400 ppm, 20 vol% O2, N2 as balance gas, GSHV = 30[thin space (1/6-em)]000 mL (gcat h)−1).

Conclusions

In this study, porous Co3O4 nano-necklaces were prepared by spiral electrospinning and controlled calcination, and a possible mechanism for the formation of porous morphologies was investigated. The results showed that the formation of a mesoporous structure resulted from the migration and decomposition of the components and could be controlled by adjusting the calcining conditions. In addition, the porous “necklace” was used to catalyze the oxidation of formaldehyde and displayed superior catalytic performance at 98 °C. This study provides a practical method for the mass-production of mesoporous nanofibers, which are good candidates as catalysts in practical applications.

Acknowledgements

The authors acknowledge the financial support of programs of International Science and Technology Corporation, China (Project No. 2013DFA50920) and Science and Technology of Beijing, China (Project No. Z131100005213007) and State Natural Sciences Fund, China (Project No. 21506236, 51372276).

References

  1. Y. Cao, B. P. Lin, Y. Sun, H. Yang and X. Q. Zhang, J. Alloys Compd., 2015, 624, 31 CrossRef CAS.
  2. N. A. M. Barakat, M. H. El-Newehy, A. S. Yasin, Z. K. Ghouri and S. S. Al-Deyab, Appl. Catal., A, 2016, 510, 180 CrossRef CAS.
  3. N. A. M. Barakat, A. Taha, M. Motlak, M. M. Nassar, M. S. Mahmoud, S. S. Al-Deyab, M. El-Newehy and H. Y. Kim, Appl. Catal., A, 2014, 481, 19 CrossRef CAS.
  4. M. S. Cortes, A. Martinez-Luevanos, L. A. Garcia-Cerda, O. S. Rodriguez-Fernandez, A. F. Fuentes, J. Romero-Garcia and S. M. Montemayor, J. Alloys Compd., 2015, 653, 290 CrossRef CAS.
  5. Z. D. Wei, Y. Li, S. L. Luo, C. B. Liu, D. S. Meng, M. Y. Ding and G. S. Zeng, Sep. Purif. Technol., 2014, 122, 60 CrossRef CAS.
  6. B. Vidyadharan, I. I. Misnon, J. Ismail, M. M. Yusoff and R. Jose, J. Alloys Compd., 2015, 633, 22 CrossRef CAS.
  7. K. X. Tang, Y. P. Li, Y. J. Li, H. B. Cao, Z. S. Zhang, Y. Zhang and J. Yang, Electrochim. Acta, 2016, 209, 709–718 CrossRef CAS.
  8. S. Xu, K. Kan, Y. Yang, C. Jiang, J. Gao, L. Q. Jing, P. K. Shen, L. Li and K. Y. Shi, J. Alloys Compd., 2015, 618, 240 CrossRef CAS.
  9. S. Zali, F. Jalali, A. Es-Haghi and M. Shamsipur, J. Chromatogr. B: Anal. Technol. Biomed. Life Sci., 2015, 1002, 387 CrossRef CAS PubMed.
  10. A. Bucko, S. Zielinska, E. Ortyl, M. Larkowska and R. Barille, Opt. Mater., 2014, 38, 179 CrossRef CAS.
  11. W. T. Koo, S. J. Choi, N. H. Kim, J. S. Jang and I. D. Kim, Sens. Actuators, B, 2016, 223, 301–310 CrossRef CAS.
  12. A. E. Erickson, D. Edmondson, F. C. Chang, D. Wood, A. Gong, S. L. Levengood and M. Q. Zhang, Carbohydr. Polym., 2015, 134, 467 CrossRef CAS PubMed.
  13. J. H. Chen, X. N. Yu, X. C. Zhu, C. H. Zheng, X. Gao and K. F. Cen, Appl. Catal., A, 2015, 507, 99 CrossRef CAS.
  14. S. Agarwal, A. Greiner and J. H. Wendorff, Prog. Polym. Sci., 2013, 38, 963 CrossRef CAS.
  15. L. Y. Ren, R. Ozisik and S. P. Kotha, J. Colloid Interface Sci., 2014, 425, 136 CrossRef CAS PubMed.
  16. H. P. Li, L. H. Xue and Y. W. Yan, J. Alloys Compd., 2014, 611, 38 CrossRef CAS.
  17. N. Bhardwaj and S. C. Kundu, Biotechnol. Adv., 2010, 28, 325 CrossRef CAS PubMed.
  18. S. Shahgaldi, Z. Yaakob, N. M. Jalil and S. M. Tasirin, J. Alloys Compd., 2012, 541, 335 CrossRef CAS.
  19. M. S. Kolathodi, S. N. H. Rao, T. S. Natarajan and G. Singh, J. Mater. Chem. A, 2016, 4, 7883–7891 CAS.
  20. P. Singh, K. Mondal and A. Sharma, J. Colloid Interface Sci., 2013, 394, 208 CrossRef CAS PubMed.
  21. J. S. Varabhas, G. G. Chase and D. H. Reneker, Polymer, 2008, 49, 4226 CrossRef CAS.
  22. C. J. Angammana and S. H. Jayaram, IEEE Trans. Ind. Appl., 2011, 47, 1028 CrossRef.
  23. B. A. Lu, Y. J. Wang, Y. X. Liu, H. G. Duan, J. Y. Zhou, Z. X. Zhang, Y. Q. Wang, X. D. Li, W. Wang, W. Lan and E. Q. Xie, Small, 2010, 6, 1612 CrossRef CAS PubMed.
  24. S. V. Lomov and K. Molnar, eXPRESS Polym. Lett., 2016, 10, 25–35 CrossRef.
  25. I. Bhattacharyya, M. C. Molaro, R. D. Braatz and G. C. Rutledge, Chem. Eng. J., 2016, 289, 203–211 CrossRef CAS.
  26. X. Wang, X. W. Hu, X. C. Qiu, X. Y. Huang, D. Z. Wu and D. H. Sun, Mater. Lett., 2013, 99, 21 CrossRef CAS.
  27. W. Q. Li, S. Y. Ma, Y. F. Li, G. J. Yang, Y. Z. Mao, J. Luo, D. J. Gengzang, X. L. Xu and S. H. Yan, Sens. Actuators, B, 2015, 211, 392 CrossRef CAS.
  28. A. Di Mauro and M. E. Fragala, Superlattices Microstruct., 2015, 81, 265 CrossRef CAS.
  29. S. H. Zhan, D. D. Zhu, G. Y. Ren, Z. Q. Shen, M. Y. Qiu, S. S. Yang, H. B. Yu and Y. Li, ACS Appl. Mater. Interfaces, 2014, 6, 16841 CAS.
  30. Y. C. Huang, B. Long, M. N. Tang, Z. B. Rui, M. S. Balogun, Y. X. Tong and H. B. Ji, Appl. Catal., B, 2016, 181, 779–787 CrossRef CAS.
  31. C. B. Zhang, Y. B. Li, Y. F. Wang and H. He, Environ. Sci. Technol., 2014, 48, 5816 CrossRef CAS PubMed.
  32. Y. Chen, J. H. He, H. Tian, D. H. Wang and Q. W. Yang, J. Colloid Interface Sci., 2014, 428, 1 CrossRef CAS PubMed.
  33. Y. C. Liao, C. S. Xie, Y. Liu and Q. W. Huang, J. Alloys Compd., 2013, 550, 190 CrossRef CAS.
  34. L. F. Qi, B. Cheng, J. G. Yu and W. K. Ho, J. Hazard. Mater., 2016, 301, 522–530 CrossRef CAS PubMed.
  35. B. B. Chen, X. B. Zhu, M. Crocker, Y. Wang and C. Shi, Appl. Catal., B, 2014, 154, 73–81 CrossRef.
  36. B. C. Liu, Y. Liu, C. Y. Li, W. T. Hu, P. Jing, Q. Wang and J. Zhang, Appl. Catal., B, 2012, 127, 47 CrossRef CAS.
  37. B. Y. Bai, Q. Qiao, H. Arandiyan, J. H. Li and J. M. Hao, Environ. Sci. Technol., 2016, 50, 2635–2640 CrossRef CAS PubMed.
  38. B. C. Liu, Y. Liu, C. Y. Li, W. T. Hu, P. Jing, Q. Wang and J. Zhang, Appl. Catal., B, 2012, 127, 47 CrossRef CAS.
  39. X. X. Xu, P. T. Wang, W. C. Xu, J. L. Wu, L. M. Chen, M. L. Fu and D. Q. Ye, Chem. Eng. J., 2016, 283, 276–284 CrossRef CAS.
  40. B. Y. Bai, H. Arandiyan and J. H. Li, Appl. Catal., B, 2013, 142, 677 CrossRef.
  41. Y. S. Xia, H. X. Dai, L. Zhang, J. G. Deng, H. He and C. T. Au, Appl. Catal., B, 2010, 100, 229 CrossRef CAS.
  42. Y. Wang, A. M. Zhu, B. B. Chen, M. Crocker and C. Shi, Catal. Commun., 2013, 36, 52 CrossRef CAS.
  43. D. Alburquenque, E. Vargas, J. C. Denardin, J. Escrig, J. F. Marco, J. Ortiz and J. L. Gautier, Mater. Charact., 2014, 93, 191 CrossRef CAS.
  44. J. Zeng, C. Francia, J. Amici, S. Bodoardo and N. Penazzi, J. Power Sources, 2014, 272, 1003 CrossRef CAS.
  45. D. Terribile, A. Trovarelli, C. de Leitenburg, G. Dolcetti and J. Llorca, Chem. Mater., 1997, 9, 2676–2678 CrossRef CAS.
  46. C. Y. Ma, D. H. Wang, W. J. Xue, B. J. Dou, H. L. Wang and Z. P. Hao, Environ. Sci. Technol., 2011, 45, 3628–3634 CrossRef CAS PubMed.
  47. B. Y. Bai and J. H. Li, ACS Catal., 2014, 4, 2753–2762 CrossRef CAS.

This journal is © The Royal Society of Chemistry 2016