DOI:
10.1039/C6RA20975K
(Paper)
RSC Adv., 2016,
6, 105476-105486
The effect of spermidine on the structure, kinetics and stability of proteinase K: spectroscopic and computational approaches
Received
20th August 2016
, Accepted 28th October 2016
First published on 31st October 2016
Abstract
Polyamines (such as spermidine) are low molecular weight compounds which can be used as cosolvents in biological and industrial applications. Cosolvents can interact with proteins and alter their stability and structure. We aimed to study the effect of spermidine (Spd) interaction with proteinase K (PK), with respect to its industrial and biological applications, using different spectroscopic methods of fluorescence, circular dichroism (CD) and UV-visible (UV-vis), as well as simulation methods. Fluorescence quenching data analysis demonstrated that PK had one binding site for Spd. The reduction of Stern–Volmer constant values by increasing the temperature suggested that binding between enzyme and Spd occurred in the ground state (static quenching) and the stability of the complex was decreased at higher temperatures. The values of enthalpy and entropy changes as well as simulation methods illustrated that hydrogen bonds and van der Waals forces played a major role in the PK–Spd complex formation. CD data analysis also showed the decrease in the β-sheet and the increase in the α-helix and β-turn of PK induced by Spd. UV-visible results indicated some alteration in the hydrophobicity of the Trp microenvironment of PK by adding Spd, confirming the intrinsic fluorescence emission results. The kinetic and thermal stability studies showed that Spd could increase the activity and stability of PK, and that this might be due to the changes in the secondary and tertiary structures of the enzyme after Spd modification.
1. Introduction
Research on the conformation, activity and stability changes of enzymes in cosolvents is essential in biological, pharmaceutical and industrial applications. Therefore, cosolvents are commonly used in the investigation of the stability, folding and structure of protein–ligand interactions.1,2 Cosolvents can alter the protein stability and structure due to their interaction with proteins and the change in the intramolecular interaction of the native conformation of the proteins. As a result, they can influence the activity of enzymes.3,4 The review of the literature reveals that some cosolvents such as natural polyamines can protect biological macromolecules (for instance, proteins) against thermal aggregation and inactivation of enzymes. Therefore, these organic molecules are used widely as an additive to keep enzymes from thermal aggregation and inactivation.5,6 The high contents of various polyamines (such as spermine, spermidine and putrescine) in hyperthermophiles creatures demonstrate the protective role of natural polyamines in enhancing the thermodynamic stability of hyperthermophilic proteins in high temperature conditions.6,7 The polymethylene backbone and the polycationic nature of polyamines enable them to interact with the polar, negatively charged and aromatic residues of proteins.8–10
Spermidine (Spd), NH2(CH2)3NH(CH2)4NH2, is a natural polyamine with a low molecular weight which plays important roles in both prokaryote and eukaryote biological systems.6,11 The level of Spd and other natural polyamines is different in various diseases such as cancer, Alzheimer's disease, inflammation, cystic fibrosis, etc.5
Spd, like other members of methylamines family, can interact with biomacromolecules such as proteins and enhance the stability of them due to the kosmotropic properties of polyamines, causing water molecules to conveniently interact with proteins and stabilize the intramolecular interactions of them.8,12
Proteinase K (PK) or endopeptidase K is a Tritirachium album serine proteinase that contains 279 amino acid residues in a single chain polypeptide. PK is a globular enzyme including one domain composed of six α helices, fifteen β strands and one 3/10 helices.13–15 This non-specific enzyme catalyzes the hydrolysis of covalent peptide bonds at the carboxylic end of hydrophobic and aromatic amine acid residues. The active site of PK consists of a catalytic triad with Ser 224, His 69 and Asp 39 residues. PK has one free Cys (Cys 73) close to His 69 of the catalytic triad and two disulfide bonds (Cys 34–Cys 123 and Cys 178–Cys 249), thereby stabilizing the tertiary structure of enzyme. Furthermore, PK has two Trp residues (8 and 212).13,16,17
PK, which readily hydrolyses native proteins, is widely used in the elimination of DNase and RNase for DNA or RNA preparation, washing powder for protein demolition, and in the biologic control against parasites.13,15,17–19 In addition to biological, industrial and agricultural applications, PK is commonly used in academic research for the investigation of the folded or unfolded state of proteins in the presence of different cosolvents such as alcohols.14,20 But, to this date, there is no report demonstrating the effect of natural polyamines such as Spd on the stability, activity and structure of PK. Therefore, in the present paper, attempts were made to investigate the alterations in the structure, stability and activity of PK induced by different concentrations of Spd at the pH 8. Different experimental and theoretical techniques such as fluorescence, UV-visible (UV-vis) absorption, circular dichroism (CD) spectroscopy, kinetic, molecular dynamic and docking studies were used to study the interaction between Spd and PK and demonstrate the binding mechanism of Spd as a small molecular additive for further biological and industrial applications.
2. Materials and methods
2.1. Materials
Proteinase K (E.C. 3.4.21.64) (cat. no. P8044, molecular weight: 28.9 kDa), spermidine trihydrochloride, p-nitrophenyl acetate, Tris–HCl, CaCl2 and methanol were obtained from Sigma chemical Company (USA). Enzyme solution was prepared in a Tris–HCl buffer 50 mM, pH 8 containing 10 mM CaCl2 (on the same day) and maintained at 0–4 °C. A stock solution of p-nitrophenyl acetate (5 mM) was prepared by dissolving in methanol and diluted using deionized water. Furthermore, the stock solution of Spd was prepared in deionized water.
2.2. Apparatus
All fluorescence emission studies were recorded on a Shimadzu RF-5301 fluorescence spectrophotometer with a temperature adjustable cell holder. All kinetic and stability studies, as well as absorption spectra, were performed using a Pharmacia 4000 UV-vis spectrophotometer equipped with an external thermostat. The CD spectra were obtained with an Aviv model 215 spectrophotometer (Lakewood, New Jersey, USA); then different secondary structures were performed by the CDNN program, version 2.1.0.223, with 33 complex spectra as the reference set.
2.3. Intrinsic fluorescence spectroscopy
The fluorescence quenching of PK at the increasing concentration of Spd was investigated with scanning between 290 and 450 nm after exciting the enzyme solution at 278 nm, using 5 nm and 3 nm as the slit width for emission and excitation, respectively. All measurements were recorded in a 10 mm cuvette at two temperatures of 298 and 308 K. The emission spectra of PK (0.1 mg ml−1) and PK–Spd mixtures were measured after 10 min incubation at the Tris–HCl buffer (50 mM, pH 8) and repeated at least three times. Furthermore, the Tris–HCl buffer was used as a blank and subtracted from the obtained spectra to correct for the fluorescence background. The mechanism of quenching was described using the Stern–Volmer constant. The thermodynamic parameters at different temperatures were also calculated from the binding constant data.
2.4. Absorption spectroscopy
UV-visible absorption spectra were carried out in some quarts cuvette containing 0.1 mg ml−1 PK and different concentrations of Spd (1–4 mM). The spectra's absorption of the enzyme was measured to be around 260–300 nm and absorbance value changes were demonstrated at the maximum absorption.
2.5. Circular dichroism (CD) spectroscopy
CD spectra were obtained in the far-UV (190–260 nm). All measurements were carried out in 0.15 mg ml−1 PK in the absence and presence of different concentrations of Spd at 298 K, after incubation for 15 min.
2.6. Thermal stability measurements
The changes in the absorbance of PK and PK–Spd complex were recorded in the temperature range of 293–363 K and the heating rate 1 K min−1. Before assays, PK (0.1 mg ml−1) was incubated in the Tris–HCl 50 mM with various Spd concentrations for about 15 min. Thermal denaturation of PK was observed by a sigmoidal curve of absorption with the temperature rise.
2.7. Enzyme activity measurements
The enzymatic activity of PK with and without Spd treatments were determined using the synthetic substrate p-nitrophenyl acetate by calculating the product generation of p-nitrophenol at the maximum absorbance of 405 nm. Michaelis–Menten constants and maximum velocities were determined from the Lineweaver–Burk plot. All hydrolysis activity assays of PK were in the 25 mg ml−1 enzyme concentration and 1–5 mM of Spd after 15 min incubation at 35 °C.
2.8. Molecular docking studies
Docking simulation between PK and Spd was performed using AutoDock 4.2 software (http://www.autodock.scripps.edu/). The three dimensional structure of PK with 1.27 Å resolution (as a receptor) with ID code 2ID8 was downloaded from the RCSB Protein Data Bank (http://www.rcsb.org). All crystal waters and hetero atoms such as Cl− were removed and the free PK was retained. The three dimensional structures of the Spd (as a ligand) were retrieved as the SDF format from Pubchem. Then opened the SDF file with Guass view software and save as PDB format. The search algorithm was used in AutoGrid program based on defining all molecules that were active and the grid parameter files were generated. The scoring algorithm in AutoDock program was used for the binding of Spd. Lamarckian genetic algorithm (LGA) was applied to search the best binding site.21 Ligplot plus was used to analyze the docking poses for hydrogen bonding and hydrophobic bonding.
2.9. Molecular dynamics simulation
Molecular dynamics simulations were performed using the GROMACS software, under Gromose98 (G43a1) force field.22,23 The calculations were carried out using the crystallographic structure of PK (PDB code: 2id8). The complex PK–Spd with the best position was obtained from docking and embedded into a box containing the 5709 spc model water and 14 Na+ 15 Cl− ions. At first, the entire system was minimized using the steepest descent followed by conjugate gradients algorithms; then the solvent and ions were allowed to evolve using minimization and molecular dynamics at NVT ensemble for 500 ps; this was also done at NPT ensemble for 1000 ps at 100 K, in which the initial configuration of the structures was kept fixed. Finally, in order to obtain equilibrium geometry at 300 K and 1 atm, the 10 ns MD simulation run was performed at the NPT ensemble. The time step for the simulation was 2 fs.
3. Results and discussion
The poor stability of free enzyme is one of the most important concerns in biological, industrial and agricultural applications.24,25 Therefore, there is a need to examine various ways to increment enzyme stability. The conformation of enzymes becomes more stable by medium alteration.24 In this study, before trying to reveal how Spd can affect the enzyme stability or activity of PK, their influence on the secondary and tertiary structure of enzyme was investigated.
3.1. Intrinsic fluorescence of PK
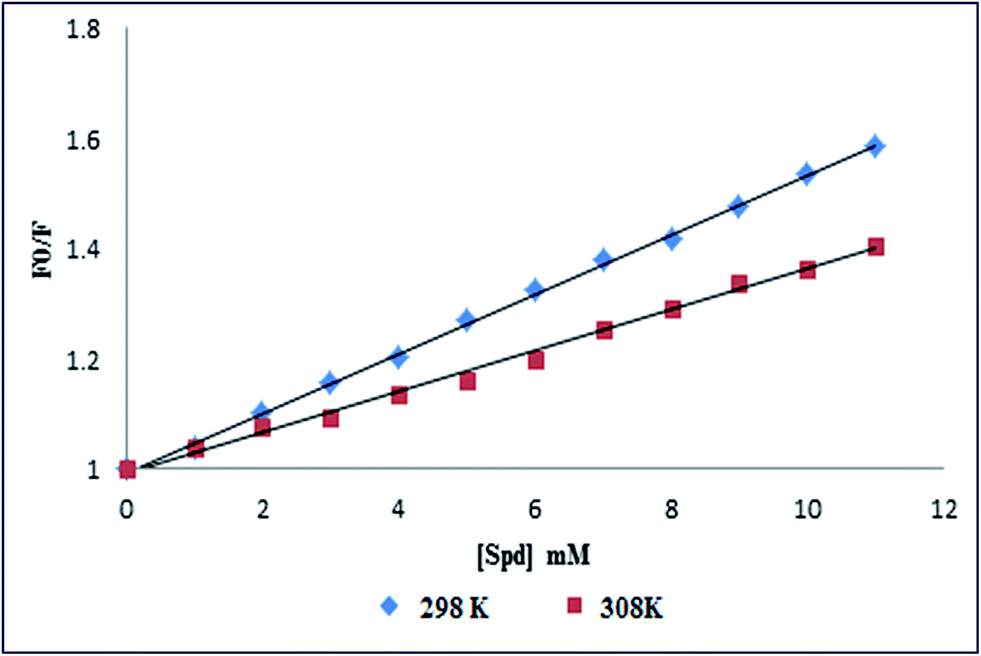
A wide variety of small molecules could quench the fluorescence of proteins as a ligand. In a broad sense, the decrease in the fluorescence is called fluorescence quenching.26–28 This process is usually caused by ligands through the microenvironmental changes of fluorophores (Trp, Tyr and Phe) in proteins. Phe residues have low quantum yield and fluorescence intensity of Trp residues is quenched when presented near a Trp residue, amino groups and/or carbonyl groups. Therefore, fluorescence observed in the intrinsic fluorescence assays of proteins contains Trp residues.26,29–31 PK has two tryptophans and its fluorescence is almost contributed by Trp residues.14,32 Fig. 1a displays the gradual decrease in enzyme's fluorescence emission when incubated with the increasing concentrations of Spd (0–11 mM) at 298 K. It is clear that the intensity of fluorescence peak at 334 nm was decreased without any red or blue shift.
 |
| | Fig. 1 (a) Representative fluorescence spectral profile of proteinase K in the presence of spermidine at 298 K, (b) the maximum fluorescence intensity of proteinase K at 334 nm and two temperatures. | |
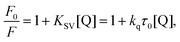
The maximum fluorescence emission of PK was decreased at 298 and 308 K (Fig. 1b), suggesting the conformational changes and the increase of the surface hydrophilicity of PK induced by Spd. At this stage, it is essential to demonstrate the mechanism of Spd-induced quenching of tryptophan fluorescence of PK. Fluorescence quenching is usually classified as dynamic (collisional) or static (complex formation) quenching.27,31,33,34 The interaction of fluorophore and quencher happens in the ground and excited states in static and dynamic quenching, respectively. These types of fluorescence quenching could be demonstrated by their differential dependence of fluorescence on temperature. Therefore, the Stern–Volmer constant values (KSV) at different temperatures were applied to distinguish the quenching mechanism. An inverse correlation of the calculated Stern–Volmer values with temperature suggested the static mechanism of quenching, but the direct correlation proposes that dynamic quenching mechanism was predominant. In order to calculate KSV and elaborate the probable fluorescence quenching mechanism observed in the PK–Spd binding reaction, the Stern–Volmer equation (eqn (1)) was used:26,27,35,36
| |
 | (1) |
where
F0 and
F are the steady-state fluorescence intensity and the quenched intensity of PK (Trp residues of PK) in the presence of Spd; also, [Q] is the concentration of Spd.
τ0 and
kq are the average life time of the biomolecule in the absence of quencher (Spd) and the biomolecular quenching rate constant.
The Stern–Volmer plots for the Spd-induced quenching of fluorescence emission of PK at different temperatures are shown in Fig. 2. The linear plots at both temperatures of 298 and 308 K revealed the single quenching mechanism induced by Spd. The Stern–Volmer quenching constant and the quenching rate constants for the Spd-induced quenching of PK are listed in Table 1. The inverse correlation of KSV with temperature suggested that the fluorescence quenching was controlled by a static quenching mechanism; therefore the stability of the PK–Spd complex was reduced at higher temperatures. Static quenching mechanism of Spd displayed that this polyamine could bind to PK to from a ground state PKSpd complex.
 |
| | Fig. 2 Stern–Volmer plot for the Spd-induced quenching of the intrinsic fluorescence of PK at 298 and 308 K. | |
Table 1 The Stern–Volmer quenching and quenching rate constants for the PK–Spd complex
| T (K) |
KSV (M−1) |
kq (M−1 s−1) |
R2 |
| 298 |
53.9 × 10² |
53.9 × 10¹⁰ |
0.999 |
| 308 |
36.9 × 10² |
36.9 × 10¹⁰ |
0.994 |
Because of the static mechanism could be distinguished for the quenching of PK with the binding Spd, a quantitative estimation for the Spd–PK binding interaction could be derived from the calculation of the binding parameters. Therefore, the binding constant (Kb) and the number of the binding sites (n) were calculated by the following equation (eqn (2)), which reports the equilibrium between free and bound molecules.26,27,35,36
| |
 | (2) |
A plot of log[(F0 − F)/F] versus log[Q] for Spd–PK complexation equilibrium is represented in Fig. 3; the calculated binding parameters are listed in Table 2. It could be suggested that Spd molecule was binding PK to form a 1![[thin space (1/6-em)]](https://www.rsc.org/images/entities/char_2009.gif) :1 complex. The values of Kb at different temperatures represented an inverse correlation demonstrating the formation of a ground state complex between PK and Spd and confirming the static mechanism of quenching. Therefore, with increasing the temperature, the PK–Spd combinations underwent partial dissociation. It was clear that the binding process was an exothermic reaction consistent with the KSV values, as described above.
:1 complex. The values of Kb at different temperatures represented an inverse correlation demonstrating the formation of a ground state complex between PK and Spd and confirming the static mechanism of quenching. Therefore, with increasing the temperature, the PK–Spd combinations underwent partial dissociation. It was clear that the binding process was an exothermic reaction consistent with the KSV values, as described above.
 |
| | Fig. 3 Double log plot of Spd quenching effect on PK fluorescence at 298 and 308 K. | |
Table 2 The binding constant and relative thermodynamic parameters for the PK–Spd complex
| T (K) |
Kb (M−1) |
n |
R2 |
ΔH° (kJ mol−1) |
ΔG° (kJ mol−1) |
ΔS° (J mol−1 K−1) |
| 298 |
44.82 × 10² |
1.08 |
0.995 |
−13.8 |
−9.42 |
−14.72 |
| 308 |
37.46 × 10² |
0.97 |
0.987 |
−13.8 |
−9.27 |
14.71 |
In general sense, there are four types of noncovalent interactions that can play a key role in the binding of various ligands to macromolecules; these include van der Waals interactions, and electrostatic, hydrophobic and hydrogen bonds.28,37–39 The dependence of the binding constant on temperature showed that the formation of protein–ligand combination was a thermodynamic process. Therefore, in order to distinguish the nature of the binding forces in the formation of the PK–Spd complex, the thermodynamic parameters were calculated.
By considering the constant values of enthalpy changes (ΔH°) over the temperature range studied, the enthalpy change was evaluated using the following equation (eqn (3)):27,36
| |
 | (3) |
here
R is the universal gas constant, and
Kb1 and
Kb2 are the binding constant values at
T1 and
T2 absolute temperatures, respectively. The free energy changes (Δ
G°) and entropy changes (Δ
S°) could be evaluated by the following thermodynamic equation (
eqn (4)):
27,36| | |
ΔG° = −RTlnKb = ΔH° − TΔS°
| (4) |
The obtained thermodynamic parameters for the formation of the PK–Spd complex are displayed in Table 2. Previous studies addressing the nature of the binding forces have revealed that the sign and magnitude of the thermodynamic parameters ΔH° and ΔS° could determine the model of the noncovalent interactions.27,38,39 If ΔH° > 0 and ΔS° > 0, hydrophobic forces play the key role in complex formation; if ΔH° < 0 and ΔS° > 0, electrostatic interaction is the main force and ΔH° < 0 and ΔS° < 0 correspond to hydrogen bonds and van der Waals forces.
According to Table 2, the negative value of ΔG° (∼−9 kJ mol−1) demonstrated the spontaneous process of PK–Spd complex formation. The negative values and ΔH° and ΔS° revealed that the enthalpy stabilized and entropy destabilized the binding process. Moreover, the negative values of binding suggested that the main binding interactions in PK–Spd complex should be hydrogen bonds and van der Waals interactions. As demonstrated from fluorescence studies, the binding and thermodynamic parameters (KSV, Kb, ΔH°, ΔS° and ΔG°) are one of the basic methods used for distinguishing the stability and nature of protein–ligand complexes.
3.2. UV visible absorption of PK
UV-visible absorption spectroscopy is a very convenient method in detecting the conformational alterations of proteins induced by ligand to detect the complex formation.40–42 Therefore, complex formation between PK and Spd was investigated using the data of UV-visible absorption spectra. As it is obvious in Fig. 4a and b, the maximum absorption peak of PK at 275 nm was increased as the Spd concentration was increased. The results illustrated that the binding of Spd with PK decreased the hydrophobicity of the local microenvironments of Trp, Tyr and Phe residues in the internal hydrophobic areas of the enzyme.43–45
 |
| | Fig. 4 (a) UV-vis spectra of PK upon the addition of Spd (b) the change in the maximum UV-vis spectra of PK at 275 nm upon the addition of Spd. | |
The slight hyperchromic effect of Spd on the absorption of PK suggested the formation of enzyme–Spd complex and also showed that the probable quenching mechanism of PK induced by Spd was the static quenching. The results were in agreement with those obtained in intrinsic fluorescence quenching.38,46
3.3. Circular dichroism (CD) of PK
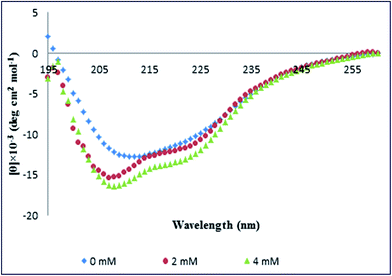
To understand whether the secondary structure of PK was changed upon the interaction with Spd, far-UV CD spectroscopy was employed. The far-UV spectral profiles of PK in the Tris–HCl buffer 50 mM, in the absence and presence of Spd at 298 K, are represented in Fig. 5. These spectra display the broad negative band with the minimum at 208 and 223 nm, which is typical of the α/β class of protein such as PK.14,32,47 The fraction content of various secondary structures of PK in the absence and presence of different concentrations of Spd was calculated by CDNN software, as summarized in Table 3. The results of secondary structural elements of pure PK represented 26.5% β-sheets, 21.5% β-turns and 16.3% α-helices; the rest included the random coils. As revealed in Fig. 5, at 2 mM and 4 mM Spd, the ellipticity of PK was increased without any distinguishable alteration in the shape of spectra. Furthermore, the results brought in Table 3 revealed that the percentage of α-regions in PK was increased upon the addition of Spd (to 19.5% for 4 mM Spd) also the percentage of β-turns increased; instead, the percentage of β-sheet was reduced at the higher concentrations of Spd (to 21.5% for 4 mM Spd), but the percentage of random coils were found to be unchanged. Briefly, Spd induced a secondary conformational switch from the β-sheet to the α-helix and β-turns in PK.
 |
| | Fig. 5 The far-UV CD spectra of PK in the absence and presence of Spd. | |
Table 3 The change in the secondary structure elements of PK with increasing Spd concentrations
| [Spd] mM |
% α-helix |
% β-sheet |
% β-turn |
% random coil |
| 0 |
16.3 |
26.5 |
21.5 |
35.7 |
| 2 |
17 |
23.3 |
23.6 |
35.1 |
| 4 |
19.5 |
21.5 |
23.3 |
35.7 |
3.4. Thermal stability of proteinase K
The thermal unfolding studies were executed by UV-vis spectrophotometer, by supposing the two-state folding mechanism: f (folded) ↔ u (unfolded). The stability of protein was demonstrated as the difference in the Gibbs free energy between the unfolded ( ) and folded state (
 ). Tm or transition temperature is temperature equidistance between the folded and unfolded state of protein. Transition temperature was calculated from the normalized absorption of the folded and unfolded state of PK, in the absence or presence of different concentrations of Spd. The fraction of the unfolded state of PK (Fu) at various concentrations of Spd was computed by the following equation (eqn (5)):48,49
| |
 | (5) |
here Y, Yf and Yu are the obtained absorption of PK, the absorption of the folded and unfolded conformation at a certain concentration of Spd, respectively. The curve of PK denaturation in various Spd concentrations is represented in Fig. 6. As shown, the increasing concentration of Spd led to shifting the curve to the higher temperatures. It showed that at the higher concentration of Spd, the stability of PK was increased. The Gibbs free energy, ΔG°, could be calculated by eqn (6):48,49| |
 | (6) |
Fu is the fraction of the unfolded protein. As illustrated in Fig. 7, the standard Gibbs free energy of PK in the absence of different concentrations of Spd was a function of Kelvin temperature; at different concentrations of Spd (0–5 mM), Gibbs free energy was equal zero. As represented in Table 4 and Fig. 7, the Tm value of PK was raised from 319.8 K (for the pure enzyme in the Tris–HCl buffer) to 324.7 K (for 5 mM Spd). In addition, thermodynamic parameters including standard entropy of transfer ( ) and standard enthalpy of transfer (
 ) were also used for the investigation of the stability of PK. Standard entropy of transfer was available from the slope of the curve of ΔG° against temperature and the standard enthalpy of transfer was computed from
  . As it is detectable in Table 4, the values of Tm,
  and
and  were increased with the rise of Spd concentration. Hence, Spd increased the stability of PK due to the favorable interactions with this enzyme. The results were consistent with those reported on the stabilization of proteins with polyamines.6,50
 |
| | Fig. 6 The unfolded fraction of PK in different concentrations of Spd. | |
 |
| | Fig. 7 The effect of Spd on free energy changes of PK in different concentrations of Spd. | |
Table 4 Tm,  and
and  changes of PK at the variable concentrations of Spd
| [Spd] (mM) |
Tm (K) |

(J mol−1 K−1) |

(kJ mol−1) |
| 0 |
319.8 |
654.8 |
209.4 |
| 1 |
321.6 |
695.5 |
223.7 |
| 2 |
322.2 |
719.0 |
231.7 |
| 3 |
323.6 |
686.0 |
221.9 |
| 4 |
324.3 |
688.2 |
223.2 |
| 5 |
324.7 |
690.2 |
224.1 |
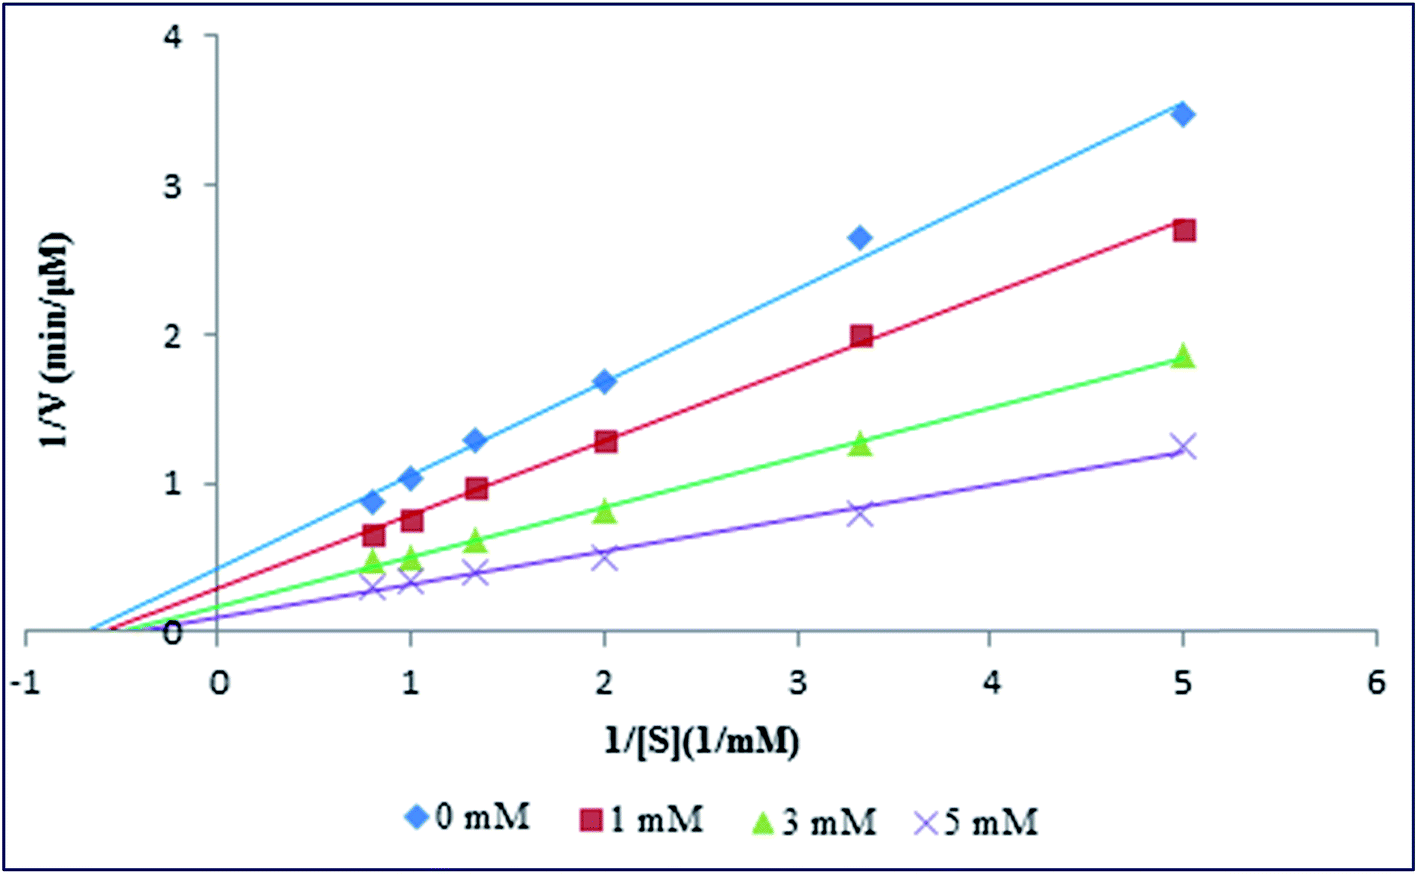
3.5. Enzyme activity of proteinase K
From the above experiment, it was demonstrated that Spd not only affected the secondary and tertiary structure of PK, but also a clear stabilizing effect on thermal stability of enzyme could be noted. To further investigations the effect of various amounts of Spd on the hydrolysis activity and the kinetic of PK, the UV-vis spectrophotometer was used. In the kinetic experiments, p-nitrophenyl acetate was used as a synthetic substrate for measuring the enzymatic activity of PK with or without Spd treatments. The hydrolysis activity of PK was evaluated by calculating the product generation of p-nitrophenol, as quantified via the molar absorption coefficient of product at 405 nm (ε = 18800 M−1 cm−1).51 Kinetic parameters (the Michaelis–Menten constant, Km and the maximum velocity, Vmax) were calculated by fitting the initial velocity and p-nitrophenyl acetate concentration to the double reciprocal Lineweaver–Burk plot (1/V0 vs. 1/[S]) (Fig. 8), as listed in Table 5. Vmax and Km are the maximum velocity of PK reaction and p-nitrophenyl acetate concentration when the enzymatic reaction rate is half of Vmax. As shown in Fig. 8 and Table 5, the maximum velocity of PK reaction was increased with the addition of Spd to enzyme solution. Therefore, the increase in the activity of PK could be as a result of the change in the conformation of the enzyme induced by Spd. In fact, the binding of Spd may lead to microenvironmental changes of the catalytic triad, as well as further exposure of the catalytic activity site of PK. In addition, the results represented the increase in the Km of enzyme (by reducing the affinity of p-nitrophenyl acetate) with the addition of Spd.44,52
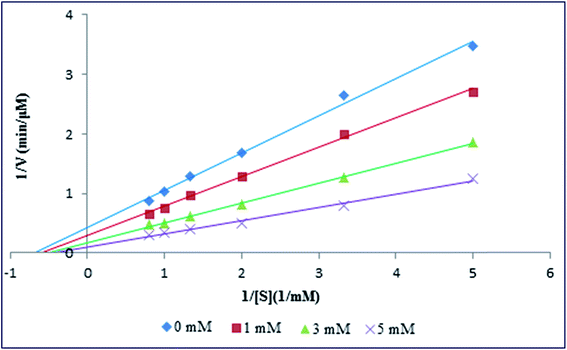 |
| | Fig. 8 Lineweaver–Burk plots for PK at different concentrations of Spd. | |
Table 5 Michaelis–Menten constant, maximum velocity, catalytic constant and catalytic efficiency of PK in the absence and presence of different concentrations of Spd
| [Spd] mM |
Km × 103 (μM) |
Vmax (μM min−1) |
kcat × 103 (min−1) |
kcat/Km (min−1 μM−1) |
| 0 |
1.47 |
2.34 |
2.71 |
1.83 |
| 1 |
1.70 |
3.44 |
3.98 |
2.34 |
| 3 |
2.01 |
5.99 |
6.92 |
3.44 |
| 5 |
2.36 |
10.58 |
12.23 |
5.16 |
The increase in the catalytic efficiency (kcat/Km) was almost three fold with the addition of Spd, as compared with pure enzyme in the Tris–HCl buffer; this showed that the restriction agent for the reaction of PK was the frequency of collisions of the enzyme with p-nitrophenyl acetate. Literature review showed that catalytic constant (kcat) alterations could be obtained from minor changes in the hydration and conformation of enzyme active site, as well as the change in the stability of the enzyme–product complex.53 Therefore, the increment in kcat with the increase in Spd suggested the active site conformational changes of PK induced by Spd. So, our investigations revealed that Spd changed the secondary and tertiary structure of PK and could act as an activator and stabilizer for the enzyme.
3.6. Molecular docking results
In order to investigate the various binding types of interaction and correct the binding site of Spd on PK, molecular docking could be used as one of the best theoretical methods.54 The docking results showed that Spd could bind to PK to from a 1:1 complex, which was in a good agreement with fluorescence spectroscopy results (Fig. 9).
 |
| | Fig. 9 Docked pose for Spd combined with PK in the single site. | |
The value of Gibbs free energy (ΔG°) for complex formation, as computed from docking, was estimated to be −6.55 kJ mol−1, thereby confirming the spontaneous complexation; it was also in agreement with the negative values calculated from fluorescence measurements. The best binding site with the lowest free energy between PK and Spd is shown in Fig. 10. As shown, there were four hydrogen bonds between Ser 176, Leu 199 and Asp 200 amino acid residues with the nitrogen atoms of Spd. The thermodynamic parameters analyses also revealed that hydrogen bond played a key role in the combination of Spd and PK. In addition to hydrogen bonds, hydrophobic interactions of Pro 175, Val 177, Ser 197, Val 198 and Cys 249 residues with Spd influenced the microenvironmental and conformational alterations in PK.
 |
| | Fig. 10 The surrounding amino acid residue of PK from the docked Spd (hydrogen bonds are shown in black and hydrophobic interactions are in red). | |
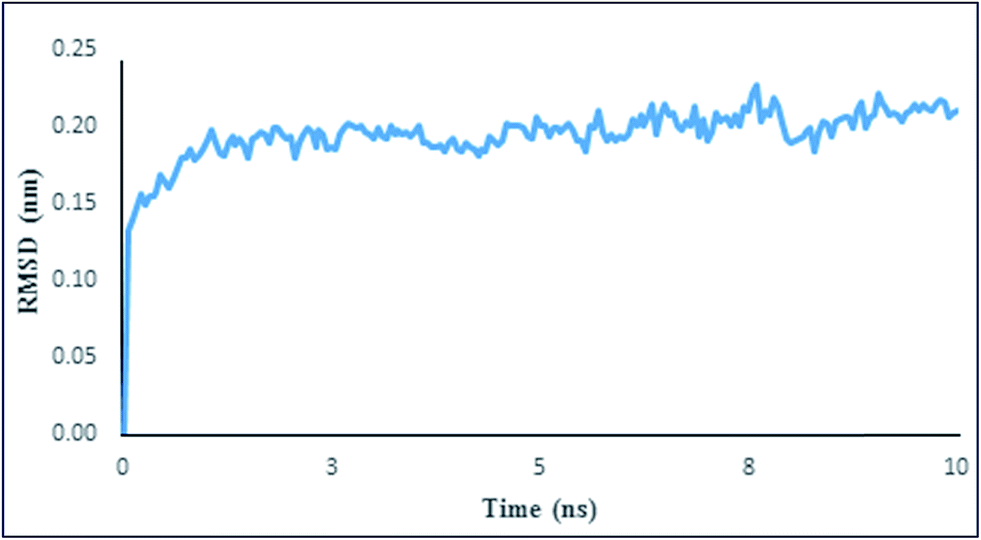
3.7. Molecular dynamics data analysis
Back bone structural stability and equilibration of PK in the presence of Spd were examined by root mean square deviation (RMSD) as a function of time. The average distance between the crystal structure of protein and the equilibrated structure could be defined as RMSD.55 The time evaluation of RMSD (during the 10 ns MD simulation) and the average RMSD at the last 4 ns MD simulation for the enzyme–Spd complex are shown in Fig. 11 and Table 6. Fig. 11 shows that in the complexation of PK–Spd, the back bone RMSD was steadily increased (about 0.1 nm); then it was stabilized and remained fixed until the end of the simulation. The low backbone RMSD values with low standard deviation (Fig. 11 and Table 6) illustrated that the complex of enzyme–Spd reached to equilibrium and remained in that state during the last 4 ns of simulation, suggesting the stability of PK after the addition of Spd.
 |
| | Fig. 11 RMSD plot of the PK–Spd complex at the 10 ns simulation time. | |
Table 6 Average values of RMSD, Rg and RMSF in the last 4 ns of 10 ns MD simulation for the PK–Spd complex
| Compound |
Rg (nm) |
Backbone RMSD (nm) |
RMSF (nm) |
| PK–Spd |
1.69 ± 0.0 |
0.21 ± 0.01 |
0.10 ± 0.06 |
The gyration radius (Rg) changes for PK in presence of Spd during the 10 ns MD simulation are depicted in Fig. 12. The average value of Rg with low standard deviation (Table 6) could show the structural stability of PK in the presence of Spd at the last 4 ns MD simulation. In order to demonstrate the local enzyme mobility or fluctuation of PK residues in the presence of Spd, Root Mean Square Fluctuations (RMSF) was used.15,56 The average RMSF value of PK–Spd combination was plotted versus the residue number based on the last 4 ns of 10 ns trajectory dada, as represented in Fig. 13. As shown, most regions of PK had minimum substantial fluctuation (stable complex) and the regions showing relatively large conformational arrangements were almost located either in the surface exposed or in the N-terminal and C-terminal of PK. The small standard deviation of RMSF showed that PK in the presence of Spd had low flexibility during the last 4 ns of 10 ns MD simulation (Table 6).
 |
| | Fig. 12 Time dependence radiation of gyration (Rg) of PK–Spd complex. | |
 |
| | Fig. 13 Average RMSF values for the residues of PK during simulation in the presence of Spd. | |
The low value of energy drift as well as the almost equal and opposite direction values of potential and kinetics energy could reveal that the law of conservation of energy in the system was established during the MD simulation (Table 7). Table 7 also shows the minimum distance between PK and Spd, unveiling the interaction between polyamine and PK during the last 4 ns simulation.
Table 7 Results of molecular dynamic simulation in the last 4 ns of 10 ns MD simulation for the PK–Spd complex
| Compound |
Potential (kJ mol−1) |
Kinetic (kJ mol−1) |
Temperature (K) |
Drift energy (kJ mol−1) |
Minimum distance (nm) |
| PK–Spd |
274650 ± 572 |
51755.11 ± 503 |
300 ± 2 |
0.0005 |
1.68 ± 0.05 |
4. Conclusion
To conclude, Spd was found to bind to PK. The information on the binding process and the effect of Spd on the structure, stability and enzyme activity of PK was obtained from different spectroscopic and theoretical studies. The intrinsic fluorescence of PK was quenched with the static mechanism. According to thermodynamic parameters, the main interactions between PK and Spd included hydrogen bond and van der Waals forces. A minor secondary structural change was distinguished by the conformational switch from the β-sheet to the α-helix. The increment in the intensity of the UV-vis spectrum confirmed the combination of PK and Spd and a decrease in the microenvironmental hydrophobicity of aromatic amino acid residues; this was in agreement with fluorescence studies. Furthermore, the thermal stability and kinetic studies showed that the transition temperature increase and hyperactivation of PK were induced by Spd. The molecular docking and fluorescence experiments revealed a negative value of ΔG°, demonstrating the spontaneous interaction process. Molecular dynamic simulations also confirmed the higher stability of PK in the presence of various concentrations of Spd.
These findings suggested that Spd could be a good agent for the increase in the activity and stability of PK, due to the conformational changes of enzyme induced with polyamines. Therefore, the present results suggested that natural polyamine (Spd) could be used in biological and industrial applications to increase enzyme stability and activity of PK.
References
- P. Attri, P. Venkatesu and M.-J. Lee, J. Phys. Chem. B, 2010, 114, 1471–1478 CrossRef CAS PubMed.
- Q. Zou, B. J. Bennion, V. Daggett and K. P. Murphy, J. Am. Chem. Soc., 2002, 124, 1192–1202 CrossRef CAS PubMed.
- P. Venkatesu, M.-J. Lee and H.-m. Lin, J. Phys. Chem. B, 2007, 111, 9045–9056 CrossRef CAS PubMed.
- P. Venkatesu, M.-J. Lee and H.-m. Lin, Arch. Biochem. Biophys., 2007, 466, 106–115 CrossRef CAS PubMed.
- R. K. Chowhan and L. R. Singh, J. Protein. Proteonomics, 2013, 3, 141–150 Search PubMed.
- M. Kudou, K. Shiraki, S. Fujiwara, T. Imanaka and M. Takagi, Eur. J. Biochem., 2003, 270, 4547–4554 CrossRef CAS PubMed.
- T. Oshima, N. Hamasaki, M. Senshu, K. Kakinuma and I. Kuwajima, J. Biol. Chem., 1987, 262, 11979–11981 CAS.
- N. Rezaei-Ghaleh, A. Ebrahim-Habibi, A. A. Moosavi-Movahedi and M. Nemat-Gorgani, Int. J. Biol. Macromol., 2007, 41, 597–604 CrossRef CAS PubMed.
- K. Igarashi and K. Kashiwagi, Biochem. Biophys. Res. Commun., 2000, 271, 559–564 CrossRef CAS PubMed.
- A. J. Geall, M. A. Eaton, T. Baker, C. Catterall and I. S. Blagbrough, FEBS Lett., 1999, 459, 337–342 CrossRef CAS PubMed.
- P. Chanphai, T. Thomas and H. Tajmir-Riahi, Int. J. Biol. Macromol., 2016, 92, 515–522 CrossRef CAS PubMed.
- S. Moelbert, B. Normand and P. De Los Rios, Biophys. Chem., 2004, 112, 45–57 CrossRef CAS PubMed.
- C. Betzel, S. Gourinath, P. Kumar, P. Kaur, M. Perbandt, S. Eschenburg and T. P. Singh, Biochemistry, 2001, 40, 3080–3088 CrossRef CAS PubMed.
- R. Tomar, V. K. Dubey and M. Jagannadham, Biochimie, 2009, 91, 951–960 CrossRef CAS PubMed.
- Y. Tao, Z.-H. Rao and S.-Q. Liu, J. Biomol. Struct. Dyn., 2010, 28, 143–157 CAS.
- C. Betzel, G. P. Pal and W. Saenger, Eur. J. Biochem., 1988, 178, 155–171 CrossRef CAS PubMed.
- J. J. Panek, R. Mazzarello, M. Novič and A. Jezierska-Mazzarello, Mol. Diversity, 2011, 15, 215–226 CrossRef CAS PubMed.
- H. Yang, C. Zhai, X. Yu, Z. Li, W. Tang, Y. Liu, X. Ma, X. Zhong, G. Li and D. Wu, Protein Expression Purif., 2016, 122, 38–44 CrossRef CAS PubMed.
- S.-Q. Liu, Z.-H. Meng, J.-K. Yang, Y.-X. Fu and K.-Q. Zhang, BMC Struct. Biol., 2007, 7, 1 CrossRef PubMed.
- M. Perham, J. Liao and P. Wittung-Stafshede, Biochemistry, 2006, 45, 7740–7749 CrossRef CAS PubMed.
- G. M. Morris, R. Huey, W. Lindstrom, M. F. Sanner, R. K. Belew, D. S. Goodsell and A. J. Olson, J. Comput. Chem., 2009, 30, 2785–2791 CrossRef CAS PubMed.
- C. Kutzner, D. Van Der Spoel, M. Fechner, E. Lindahl, U. W. Schmitt, B. L. De Groot and H. Grubmüller, J. Comput. Chem., 2007, 28, 2075–2084 CrossRef CAS PubMed.
- E. Lindahl, B. Hess and D. Van Der Spoel, J. Mol. Model., 2001, 7, 306–317 CrossRef CAS.
- J. Xu, J. Sun, Y. Wang, J. Sheng, F. Wang and M. Sun, Molecules, 2014, 19, 11465–11486 CrossRef PubMed.
- J. Kim, J. W. Grate and P. Wang, Chem. Eng. Sci., 2006, 61, 1017–1026 CrossRef CAS.
- X. Zhao, F. Hao, D. Lu, W. Liu, Q. Zhou and G. Jiang, ACS Appl. Mater. Interfaces, 2015, 7, 18880–18890 CAS.
- B. K. Paul, K. Bhattacharjee, S. Bose and N. Guchhait, Phys. Chem. Chem. Phys., 2012, 14, 15482–15493 RSC.
- B. K. Paul and N. Guchhait, Photochem. Photobiol. Sci., 2011, 10, 980–991 CAS.
- Y. Liu, F. Ji and R. Liu, Nanotoxicology, 2013, 7, 97–104 CrossRef CAS PubMed.
- P. Bourassa, C. Kanakis, P. Tarantilis, M. Pollissiou and H. Tajmir-Riahi, J. Phys. Chem. B, 2010, 114, 3348–3354 CrossRef CAS PubMed.
- G. Wang, D. Wang, X. Li and Y. Lu, Colloids Surf., B, 2011, 84, 272–279 CrossRef CAS PubMed.
- M. H. Koupaei, B. Shareghi, A. A. Saboury, F. Davar, A. Semnani and M. Evini, RSC Adv., 2016, 6, 42313–42323 RSC.
- B. Ghalandari, A. Divsalar, A. A. Saboury and K. Parivar, J. Iran. Chem. Soc., 2015, 12, 613–619 CrossRef CAS.
- M. D. Meti, S. T. Nandibewoor, S. D. Joshi, U. A. More and S. A. Chimatadar, J. Iran. Chem. Soc., 2016, 13, 1325–1338 CrossRef CAS.
- F. Pasban Ziyarat, A. Asoodeh, Z. Sharif Barfeh, M. Pirouzi and J. Chamani, J. Biomol. Struct. Dyn., 2014, 32, 613–629 CAS.
- M. Moradi, A. Divsalar, A. Saboury, B. Ghalandari and A. Harifi, J. Biomol. Struct. Dyn., 2015, 33, 2255–2266 CAS.
- D. Li, B. Ji and J. Jin, J. Lumin., 2008, 128, 1399–1406 CrossRef CAS.
- M. Saeidifar, H. Mansouri-Torshizi and A. A. Saboury, J. Lumin., 2015, 167, 391–398 CrossRef CAS.
- P. D. Ross and S. Subramanian, Biochemistry, 1981, 20, 3096–3102 CrossRef CAS PubMed.
- Q. Yang, J. Liang and H. Han, J. Phys. Chem. B, 2009, 113, 10454–10458 CrossRef CAS PubMed.
- X. Zhao, R. Liu, Z. Chi, Y. Teng and P. Qin, J. Phys. Chem. B, 2010, 114, 5625–5631 CrossRef CAS PubMed.
- M. Jing, W. Song and R. Liu, Spectrochim. Acta, Part A, 2016, 164, 103–109 CrossRef CAS PubMed.
- Z. Chi, R. Liu and H. Zhang, Biomacromolecules, 2010, 11, 2454–2459 CrossRef CAS PubMed.
- X. Hu, Z. Yu and R. Liu, Spectrochim. Acta, Part A, 2013, 108, 50–54 CrossRef CAS PubMed.
- Y. Liu and R. Liu, Food Chem. Toxicol., 2012, 50, 3298–3305 CrossRef CAS PubMed.
- D. Lu, X. Zhao, Y. Zhao, B. Zhang, B. Zhang, M. Geng and R. Liu, Food Chem. Toxicol., 2011, 49, 3158–3164 CrossRef CAS PubMed.
- S. Koutsopoulos, K. Patzsch, W. T. Bosker and W. Norde, Langmuir, 2007, 23, 2000–2006 CrossRef CAS PubMed.
- A. Saboury and A. Moosavi-Movahedi, Biochem. Educ., 1995, 23, 164–167 CrossRef CAS.
- A. Saboury and F. Karbassi, Thermochim. Acta, 2000, 362, 121–129 CrossRef CAS.
- H. Hamada, R. Takahashi, T. Noguchi and K. Shiraki, Biotechnol. Prog., 2008, 24, 436–443 CrossRef CAS PubMed.
- G. N. Bowers, R. B. McComb, R. Christensen and R. Schaffer, Clin. Chem., 1980, 26, 724–729 CAS.
- V. V. Mozhaev, Y. L. Khmelnitsky, M. V. Sergeeva, A. B. Belova, N. L. Klyacho, A. V. Levashov and K. Martinek, Eur. J. Biochem., 1989, 184, 597–602 CrossRef CAS PubMed.
- T. Q. Luong and R. Winter, Phys. Chem. Chem. Phys., 2015, 17, 23273–23278 RSC.
- A. Kumar, A. Rani and P. Venkatesu, New J. Chem., 2015, 39, 938–952 RSC.
- H. Monhemi, M. R. Housaindokht and A. Nakhaei Pour, J. Phys. Chem. B, 2015, 119, 10406–10416 CrossRef CAS PubMed.
- F. S. Mohseni-Shahri, M. R. Housaindokht, M. R. Bozorgmehr and A. A. Moosavi-Movahedi, Biomacromol. J., 2015, 1, 154–166 Search PubMed.
|
| This journal is © The Royal Society of Chemistry 2016 |
Click here to see how this site uses Cookies. View our privacy policy here. 


 ) and folded state (
 ). Tm or transition temperature is temperature equidistance between the folded and unfolded state of protein. Transition temperature was calculated from the normalized absorption of the folded and unfolded state of PK, in the absence or presence of different concentrations of Spd. The fraction of the unfolded state of PK (Fu) at various concentrations of Spd was computed by the following equation (eqn (5)):48,49
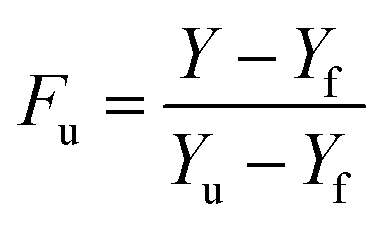

 ) and standard enthalpy of transfer (
 ) were also used for the investigation of the stability of PK. Standard entropy of transfer was available from the slope of the curve of ΔG° against temperature and the standard enthalpy of transfer was computed from
  . As it is detectable in Table 4, the values of Tm,
  and
and  were increased with the rise of Spd concentration. Hence, Spd increased the stability of PK due to the favorable interactions with this enzyme. The results were consistent with those reported on the stabilization of proteins with polyamines.6,50


 and
and  changes of PK at the variable concentrations of Spd