DOI:
10.1039/C6RA20970J
(Paper)
RSC Adv., 2016,
6, 88010-88029
Bromine substituted aminonaphthoquinones: synthesis, characterization, DFT and metal ion binding studies†
Received
20th August 2016
, Accepted 31st August 2016
First published on 7th September 2016
Abstract
Bromine substituted aminonaphthoquinone ligands viz. 2-(2′-aminomethylpyridyl)-3-bromo-naphthalene-1,4-dione; (2MPA), 2-(3′-aminomethylpyridyl)-3-bromo-naphthalene-1,4-dione; (3MPA), 2-(2′-aminoethylpyridyl)-3-bromo-naphthalene-1,4-dione; (2EPA) and 2-(2′-aminomethylthiophenyl)-3-bromo-naphthalene-1,4-dione (2AMT) and 2-(2′-aminoethylthiophenyl)-3-bromo-naphthalene-1,4-dione (2AET) have been synthesized and characterized by single-crystal X-ray diffraction experiments in conjunction with long range corrected density functional theory. The heterocyclic amines on the naphthoquinone ring render diverse crystal structures. It has been shown that bromine substitution influences the planarity and mutual orientation of naphthoquinone and heterocycles in aminonaphthoquinone ligands. The 2MPA, 3MPA, 2EPA, 2AET aminonaphthoquinone ligands crystallize in the monoclinic space group whereas 2AMT led to the triclinic space group P![[1 with combining macron]](https://www.rsc.org/images/entities/char_0031_0304.gif) . Furthermore, molecular packing of 2MPA and 2EPA revealed dimeric structures while 3MPA and 2AMT are rendered with ‘stair-case’ arrangements of molecules. 2AET, when viewed down c-axis, showed a ‘butterfly like’ arrangement. A broad charge transfer band (400–600 nm) was observed in the UV-visible spectra of these ligands. Besides 2MPA and 2EPA exhibit remarkable selectivity toward Cu2+ ions, accompanied by a color change from orange to blue in methanol and methanol–water mixture.
. Furthermore, molecular packing of 2MPA and 2EPA revealed dimeric structures while 3MPA and 2AMT are rendered with ‘stair-case’ arrangements of molecules. 2AET, when viewed down c-axis, showed a ‘butterfly like’ arrangement. A broad charge transfer band (400–600 nm) was observed in the UV-visible spectra of these ligands. Besides 2MPA and 2EPA exhibit remarkable selectivity toward Cu2+ ions, accompanied by a color change from orange to blue in methanol and methanol–water mixture.
Introduction
1,4-Naphthoquinones containing an amino or a substituted amino group, have been the focus of attention owing to their use as therapeutics1,2 in a variety of medicinal and biological applications encompassing antituberculars,3 antimalarials4,5 anticancer agents,6 antitumor agents,7–9 antifungals,10 and antiparasitic and phytotoxic activities.11,12 The biological activity of quinones stems from their ability to accept one or two electrons to form the corresponding radical anion or dianion species and their acid base behaviour.13,14 It has been recognised that electron attracting or donating substituents modulate the redox15 properties of quinones. The molecular basis of quinone toxicity suggested that enzyme catalyzed reduction to semiquinone radicals is followed by reduction of oxygen to superoxide anion radicals16–18 regenerating the quinone. The electron donor effect of amine substituent on 1,4-naphthoquinones and the hydrogen bond between the –NH group and quinone carbonyl groups significantly influences the electron acceptor capability19 of the quinone nucleus and subsequently electron transfer from the analyte to electroactive quinone nucleus. The presence of nitrogen atom modulates electronic properties of quinone which further induces structural modification of neutral molecules or reduction intermediate. Optical characteristics of quinone derivatives are governed by hydrogen bonding as well as other intermolecular interactions. The present work aims deriving the molecular insights accompanying such molecular interactions.
Aminonaphthoquinones owing to their biological importance serve as chemical sensors. The functionalisation of 1,4-naphthoquinone with amines facilitate a variety of interaction sites for metal ion binding. In this regard aminonaphthoquinones are known to bring about intramolecular charge transfer (ICT)20 transitions; the intensity of which largely depends on the substituent21 attached to amine moiety in particular, the charge density near nitrogen centre. The receptor molecules to be used as chemosensors should absorb and emit at longer wavelengths and show selective response to specific ions. It has been conjectured that the amine moiety being electron donor when present in the quinone ring at C(2) position facilitate strong charge-transfer22,23 (CT) to the carbonyl group which can be attributed to intramolecular hydrogen bonding between carbonyl oxygen and the hydrogen of the substituent on C(1) position, which reflects as π–π* absorption band in the visible region of its absorption spectrum.
Naphthoquinone and anthraquinone based sensing by functionalization of the quinone moiety using nitrogen containing receptors such as amines for cation sensing for example, 1,2 and 1,8-diaminoanthroquinones has been reported.24,25 To this direction ureas,26,27 thioureas28,29 incorporated into anthraquinone as hydrogen bonding receptors have been employed for sensing inorganic and organic anions30,31 those include halide, acetate, malate, fumarate, tartarate, aconitate and citrate to distinguish isomeric forms, since the urea forms strong hydrogen bonds. Urea anthraquinone assemblies where in the metal cation deprotonate the donor amine or amide have further been explored in metal ion detection.32 Likewise imidazole moiety serves as excellent hydrogen bond donor in anion receptor systems33–35 where the reactivity of the NH proton can be tuned by varying the electronic properties of the substituent at the ring. The presence of a donor pyridine like nitrogen atom within the ring capable of selectively binding cationic species converts imidazoles into excellent metal ion sensors.36–38 The naphthoquinone based sensing has been focus of attraction for quite some time. The naphthoquinone molecules substituted with heterocyclic amines,39–43 thiourea44 and imidazole45 receptors are reported as sensors for metal cations such as Cu2+ and the anions as well. It has further been demonstrated that Schiff base46 of aminonaphthoquinone acts as a dual sensor for F− anion as well as Co2+, Ni2+, and Cu2+ cations. Naphthoquinone based probes are also being used for sensing biomolecules44 such as arylamine N-acetyltransferase (potential breast cancer biomarker). Bromine containing chemosensors were scarce in the literature. With our growing interest to develop naphthoquinone based redox active chemosensors, in the present work we carried out the syntheses of naphthoquinone based chemosensors, the thiophene and pyridyl ring bearing bromo derivatives of 1,4-naphthoquinone (Scheme 1). These ligands have further been characterized in terms of, molecular structure and their metal ion binding abilities combining experiment with the density functional theory.
 |
| | Scheme 1 Molecular structures of aminonaphthoquinones under investigation. | |
Results and discussion
The aminonaphthoquinone ligands were synthesized with high % yield via Michael addition of respective amines to the starting precursor 2,3-dibromo-1,4-naphthoquinone (DBrNQ) as shown in the Scheme S1 in ESI.† There was formation of side product observed in the synthesis of 2MPA and 3MPA and that of 2MPA has been isolated and characterized as 2-amino-3-methyl-1,4-naphthoquinone. All the aminonaphthoquinones were characterized by elemental analysis, FT-IR, 1H, 13C NMR, gDQCOSY, DEPT, gHSQCAD NMR and single crystal X-ray diffraction studies.
FT-IR, NMR and UV-visible studies
FT-IR spectra of aminonaphthoquinone ligands reveal characteristic –N–H stretching follows the order: 2EPA (3321 cm−1) > 2AMT (3284 cm−1) > 3MPA (3267 cm−1) > 2AET (3263 cm−1) > 2MPA (3242 cm−1) and sensitive to inter and intramolecular hydrogen bonding interactions (cf. Fig. S1, S2 and Table S1 in ESI†). The carbonyl stretching frequency was observed at 1676 cm−1 for the parent starting material DBrNQ, which exhibit a frequency up-shift from 2 to 9 cm−1 respectively except for the 2EPA in which a marginal shift of 4 cm−1 in the opposite direction can be noticed. The characteristic para-naphthoquinone (p-NQ) vibrations observed at 1292 cm−1 and 1250 ± 9 cm−1 in the aminonaphthoquinones ligands. The νC–Br vibration reveals a largest blue-shift of 56 cm−1 for 2AET which decreases steadily on traversing from 2EPA, 2MPA to 3MPA. The ligand 2AMT, on the other hand shows a marginal decrease of 4 cm−1 in 2AMT compared to the 627 cm−1 vibration in parent DBrNQ.
As shown in Scheme 2, 1H and 13C chemical shifts were assigned based on the 1H, 13C, DEPT, gHSQCAD, gDQCOSY experiments (Fig. S3–S7, Tables S2 and S3 in ESI†). The proton chemical shift of –N(1)–H(1) proton observed at ∼δ = 6.2 ppm in 3MPA, 2AMT and 2AET, however it showed downfield signal in 2EPA (δ = 7.12 ppm) as well as 2MPA (δ = 7.91 ppm). The 13C chemical shifts in these ligands are affected significantly as evidenced from 2MPA, 3MPA and 3AMT which emerge with the signals near 155.21, 134.11 and 148.99 ppm, respectively. Further 3MPA and 2MPA can be distinguished from the C(15) and C(16) signals in 3MPA emerge near δ = 148.99 and 149.18 ppm, respectively.
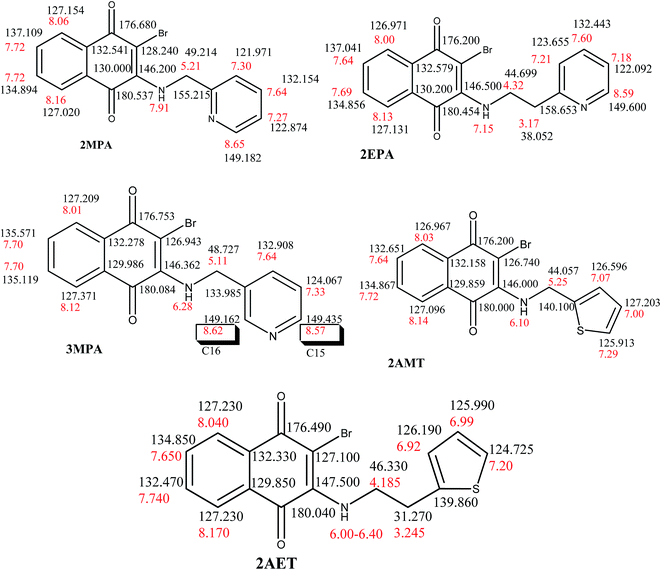 |
| | Scheme 2 1H and 13C chemical shift (ppm) of aminonaphthoquinone ligands. | |
The UV-visible spectra of all compounds and the starting materials DBrNQ were recorded at 5 × 10⁻⁴ M concentrations in DMSO (Fig. S8 in ESI†). The absorption in the visible region was observed in DBrNQ as well as in 2MPA, 3MPA, 2AMT, 2EPA and 2AET owing to a fully conjugated cyclic dione system,47 where the π–π* transitions are well pronounced in the UV region, sharp intense band near 336 nm of the starting material appears as a only as a hump in the ligands studied in this work. The nonbonding electrons of the amino group bring about n–π* transition in the visible region. A low energy band centred ∼440–477 nm has been observed in the visible, which is characteristic for the amino substituted quinones which stem from charge transfer (CT) band and weak n–π* transitions of the carbonyl of the quinone.
Single crystal X-ray diffraction studies
ORTEP plots of 2MPA, 3MPA, 2AMT, 2EPA and 2AET are shown in Fig. 1 and the crystallography data has been summarized in Table 1. Except for the 2AMT which crystallizes in triclinic space group P, the rest of aminonaphthoquinone ligands crystallize in monoclinic space group. The oxidation number of aminonaphthoquinones can be gauged from the bond distance parameters in quinonoid ring.47–55 The carbonyl bond distances C(1)–O(1) and C(4)–O(2) are ∼1.22 Å in all aminonaphthoquinone ligands except 3AMT the C(4)–O(2) distance observed to be 1.24(2) Å. Thus, the ligands are in their oxidized form. The C(3)–N(1) and C(2)–Br distances respectively, were observed to be ∼1.32–1.34 Å and ∼1.88–1.90 Å.
 |
| | Fig. 1 ORTEP plots of 2MPA, 3MPA, 2AMT, 2EPA and 2AET. The ellipsoid was drawn with 50% of probability. | |
Table 1 Single crystal X-ray data for 2MPA, 3MPA, 2AMT, 2EPA and 2AET
| Identification code |
2MPA |
3MPA |
2AMT |
2EPA |
2AET |
| CCDC no. |
1446762 |
1446761 |
1446759 |
1446760 |
1446920 |
| Empirical formula |
C16H11BrN2O2 |
C16H11BrN2O2 |
C15H10BrNO2S |
C17H13BrN2O2 |
C16H12BrNO2S |
| Formula weight |
343.18 |
343.18 |
348.21 |
357.2 |
362.24 |
| Temperature |
296(2) K |
296(2) K |
296(2) K |
296(2) K |
296(2) K |
| Wavelength |
1.54178 Å |
0.71073 Å |
0.71073 Å |
0.71073 Å |
1.54178 Å |
| Crystal system, space group |
Monoclinic, P21/n |
Monoclinic, P21/c |
Triclinic, P |
Monoclinic, C2/c |
Monoclinic, Cc |
| Unit cell dimensions |
a = 4.9001(3) Å |
a = 12.9287(2) Å |
a = 7.3322(2) Å |
a = 25.2419(4) Å |
a = 23.3217(11) Å |
| b = 14.5285(8) Å |
b = 7.70260(10) Å |
α = 91.4380(6)° |
b = 4.46860(10) Å |
b = 4.4264(2) Å |
| β = 96.875(2)° |
β = 109.1800(5)° |
b = 7.7451(2) Å |
β = 108.0900(8)° |
β = 91.381(3)° |
| c = 19.5250(10) |
c = 14.6188(2) Å |
β = 90.0420(7)° |
c = 27.7323(4) Å |
c = 14.6193(7) Å |
| |
|
c = 12.5621(3) Å |
|
|
| |
|
γ = 96.9860(7)° |
|
|
| Volume |
1380.01(13) Å3 |
1375.00(3) Å3 |
707.86(3) Å3 |
2973.47(9) Å3 |
1508.73(12) Å3 |
| Z, calculated density |
4, 1.652 Mg m−3 |
4, 1.658 Mg m−3 |
2, 1.634 Mg m−3 |
8, 1.596 Mg m−3 |
4, 1.595 Mg m−3 |
| Absorption coefficient |
4.116 mm−1 |
2.995 mm−1 |
3.050 mm−1 |
2.773 mm−1 |
5.037 mm−1 |
| F(000) |
688 |
688 |
348 |
1440 |
728 |
| Crystal size |
0.46 × 0.11 × 0.063 mm |
0.256 × 0.241 × 0.193 mm |
0.268 × 0.143 × 0.122 mm |
0.431 × 0.184 × 0.063 mm |
0.180 × 0.119 × 0.103 mm |
| Theta range for data collection |
3.802 to 68.386° |
2.873 to 28.535° |
2.650 to 28.396° |
3.029 to 28.277° |
3.792 to 68.470° |
| Limiting indices |
−5 ≤ h ≤ 5, −17 ≤ k ≤ 17, −23 ≤ l ≤ 23 |
−17 ≤ h ≤ 17, −10 ≤ k ≤ 10, −19 ≤ l ≤ 19 |
−9 ≤ h ≤ 9, −10 ≤ k ≤ 10, −16 ≤ l ≤ 16 |
−33 ≤ h ≤ 33, −5 ≤ k ≤ 5, −36 ≤ l ≤ 36 |
−28 ≤ h ≤ 28, −5 ≤ k ≤ 5, −17 ≤ l ≤ 17 |
| Reflections collected/unique |
19![[thin space (1/6-em)]](https://www.rsc.org/images/entities/char_2009.gif) 383/2515 [R(int) = 0.1625] 383/2515 [R(int) = 0.1625] |
58520/3490 [R(int) = 0.0787] |
25998/3546 [R(int) = 0.0688] |
19705/3640 [R(int) = 0.0966] |
7556/2600 [R(int) = 0.0646] |
| Completeness to theta = 25.242° |
99.60% |
99.90% |
100.00% |
99.90% |
99.10% |
| Refinement method |
Full-matrix least-squares on F2 |
Full-matrix least-squares on F2 |
Full-matrix least-squares on F2 |
Full-matrix least-squares on F2 |
Full-matrix least-squares on F2 |
| Data/restraints/parameters |
2515/0/190 |
3490/0/190 |
3546/0/181 |
3640/0/199 |
2600/2/190 |
| Goodness-of-fit on F2 |
1.065 |
1.07 |
1.023 |
1.058 |
1.055 |
| Final R indices [I > 2 sigma(I)] |
R1 = 0.0811, wR2 = 0.2057 |
R1 = 0.0501, wR2 = 0.1206 |
R1 = 0.0553, wR2 = 0.1033 |
R1 = 0.0625, wR2 = 0.1064 |
R1 = 0.0623, wR2 = 0.1471 |
| R indices (all data) |
R1 = 0.0978, wR2 = 0.2260 |
R1 = 0.0650, wR2 = 0.1281 |
R1 = 0.0977, wR2 = 0.1181 |
R1 = 0.1200, wR2 = 0.1240 |
R1 = 0.0861, wR2 = 0.1642 |
| Extinction coefficient |
n/a |
n/a |
n/a |
n/a |
n/a |
| Largest diff. peak and hole |
1.021 and −1.674 e Å−3 |
0.581 and −0.959 e Å−3 |
0.700 and −0.625 e Å−3 |
0.780 and −0.809 e Å−3 |
0.322 and −0.623 e Å−3 |
Aminonaphthoquinones are comprised of C–H⋯O, N–H⋯O and others include C–H⋯N, N–H⋯N, C–H⋯Cl, C–H⋯π, π⋯π stacking interactions.54,55 A charge transfer has also been observed subsequent to such noncovalent interactions. The chloro analogs containing pyridine functionalities studied in our laboratory serve as chemosensor, which bind to metal ions via bi- or tri-dentate coordination depending on the planarity of the ligand.48,49 These chemosensors are known for specific detection of Cu2+ ions in methanol–water mixture, also are explored to detect other metal ions under mild basic conditions in the presence of triethylamine. X-ray crystallography experiments further provide the coordination sites of these ligands. The present endeavour concerns with how bromo substitution influences the planarity of naphthoquinone and the heteroatom rings in aminonaphthoquinones.
Intra as well as intermolecular hydrogen bonding interactions are observed in the aminonaphthoquinone ligands studied in this investigation. The hydrogen bond parameters including selected bond-distances and angles are given in Table 2. Except the 2MPA, the rest of ligands suggest the presence of the N(1)–H(1)⋯O(2) intramolecular hydrogen bonding. The N(1)–H(1)⋯N(2) along with intramolecular H(1)⋯Br(1) (2.515 Å) interactions are inferred in 2MPA. The bond angle ∠N(1)–H(1)⋯O(2) was observed to be ∼114°, which shows a closure to ∼105° in 3AMT which signifies the change of hybridization from the sp2 to sp3 for the amino nitrogen.
Table 2 Hydrogen bonding geometries of compoundsa
| Com. |
D–H⋯A |
D–H (Ǻ) |
H⋯A (Ǻ) |
D⋯A (Ǻ) |
∠D–H⋯A (°) |
| (i) −x, −y, 1 − z; (ii) −1.5 + x, 1/2 − y, −1/2 + z; (iii) x, −1 + y, z; (iv) 1 − x, −y, 2 − z; (v) −1 + x, −1 + y, z; (iv) −x, 1 − y, −z; (vi) 1/2 − x, −1/2 + y, 1/2 − z; (vii) 1/2 − x, −1/2 − y, −z; (viii) x, 1 − y, −1/2 + z; (ix) x, 1 − y, −1/2 + z; (x) x, 2 − y, −1/2 + z. |
| 2MPA |
C(5)–H(5)⋯O(2)(i) |
0.929 |
2.511 |
3.42(1) |
165.6 |
| C(14)–H(14)⋯O(1)(ii) |
0.930 |
2.647 |
3.43(1) |
142.6 |
| N(1)–H(1)⋯N(2)(intra) |
0.859 |
2.129 |
2.601(9) |
114.1 |
| ∠C(3)–N(1)–C(11)–C(12) |
|
|
|
−177.2(7) |
| 3MPA |
N(1)–H(1)⋯O(1)(iii) |
0.860 |
2.290 |
3.036(4) |
145.1 |
| C(8)–H(8)⋯O(2)(iii) |
0.930 |
2.298 |
3.214(5) |
168.2 |
| C(16)–H(16)⋯O(1)(iii) |
0.930 |
2.536 |
3.347(4) |
146 |
| C(14)–H(14)⋯Br(1)(iv) |
0.930 |
2.689 |
3.396(4) |
133.3 |
| N(1)–H(1)⋯O(2)(intra) |
0.860 |
2.126 |
2.570(4) |
111.6 |
| ∠C(3)–N(1)–C(11)–C(12) |
|
|
|
−85.1(5) |
| 2AMT |
N(1)–H(1)⋯O(1)(iii) |
0.860 |
2.321 |
3.020(5) |
138.6 |
| C(8)–(H8)⋯O(2)(iii) |
0.930 |
2.254 |
3.163(4) |
165.7 |
| C(15)–(H15)⋯O(1)(v) |
0.930 |
2.662 |
3.508(4) |
151.5 |
| N(1)–H(1)⋯O(2)(intra) |
0.860 |
2.208 |
2.577(3) |
105.7 |
| ∠C(3)–N(1)–C(11)–C(12) |
|
|
|
73.3(4) |
| 2EPA |
N(1)–H(1)⋯O(2)(vi) |
0.861 |
2.230 |
2.987(3) |
146.8 |
| C(5)–H(5)⋯N(2)(vi) |
0.929 |
2.570 |
3.406(5) |
149.8 |
| C(7)–H(7)⋯O(1)(vii) |
0.929 |
2.621 |
3.403(4) |
142.2 |
| C(15)–(H15)⋯O(1)(viii) |
0.930 |
2.707 |
3.542(6) |
149.8 |
| N(1)–H(1)⋯O(2)(intra) |
0.861 |
2.099 |
2.575(4) |
114.2 |
| ∠C(3)–N(1)–C(11)–C(12) |
|
|
|
−94.8(4) |
| ∠C(13)–C(12)–C(11)–N(1) |
|
|
|
−170.2(3) |
| 2AET |
N(1)–H(1)⋯O(1)(ix) |
0.86 |
2.13 |
2.79(2) |
133.2 |
| C(14)–H(14)⋯Br(1)(x) |
0.93 |
2.912 |
3.57(1) |
128.7 |
| N(1)–H(1)⋯O(2)(intra) |
0.86 |
2.12 |
2.58(2) |
113.6 |
| ∠C(3)–N(1)–C(11)–C(12) |
|
|
|
83.0(2) |
| ∠C(13)–C(12)–C(11)–N(1) |
|
|
|
−175(1) |
The intermolecular interactions with similar neighbouring molecules, type of interaction and interplanar angles of naphthoquinone ring with pyridine/thiophene ring are represented in Table 3.
Table 3 Molecular interaction of aminonaphthoquinone ligands
| Com. |
Type of interaction |
Figure |
Number of similar neighbouring molecules |
Angle between naphthoquinone ring plane and pyridine or thiophene ring plane (°) |
| 2MPA |
C–H⋯O, Br⋯π |
Fig. S9 |
5 |
9 |
| 3MPA |
N–H⋯O, C–H⋯O, C–H⋯Br, π⋯π stacking |
Fig. S10 |
5 |
85 |
| 2AMT |
N–H⋯O, C–H⋯O |
Fig. S11 |
4 |
89 |
| 2EPA |
N–H⋯O, C–H⋯O, C–H⋯N |
Fig. S12 |
4 |
22.2 |
| 2AET |
N–H⋯O, C–H⋯π, C–H⋯Br |
Fig. S13 |
6 |
9 |
Molecular interactions in 2MPA, 3MPA, 2AMT and 2EPA, 2AET′
The usual N–H⋯O intramolecular hydrogen bonding is absent in 2MPA, instead the orientation of pyridyl ring brings –NH proton vicinity of bromine facilitating N–H⋯N intramolecular hydrogen bonding interactions. The dimer is facilitated through head to tail orientation of 2MPA molecules via C(5)–H(5)⋯O(2) (−x, −y, 1 − z) interactions which subsequently brings about the C(14)–H(14)⋯O(1) intermolecular hydrogen bonding interaction (Fig. 2) concomitant to Br⋯π interactions from the neighbouring molecules specially by C(6) (3.517(8) Å, 1/2 − x, −1/2 + y, 1/2 − z) and C(7) (3.297(7) Å).
 |
| | Fig. 2 Molecular packing of 2MPA down a-axis. | |
The quinonoid oxygen O(1) of 3MPA further showed bifurcated hydrogen bonding (Fig. 3a). Polymeric chain of 3MPA molecules is extendes via by C(8)–H(8)⋯O(2) and N(1)–H(1)⋯O(1) interactions, with the pyridine moiety being placed on same side of the chain (Fig. 3a). The pyridyl rings of two neighbouring chains orient in opposite directions with the polymer chains stacked via C(1)⋯O(2) (3.161(4), x, −1 + y, z) contacts (Fig. 3a). The C⋯O stacked chains are further stabilized by the C(16)–H(16)⋯O(1) (x, −1 + y, z) and C(14)–H(14)⋯Br(1) (1 − x, −y, 2 − z) interaction (Fig. 3b). Pyridyl ring distances were observed to be 4.047 Å.
 |
| | Fig. 3 (a) Polymeric chains of 3MPA molecules formed by C(8)–H(8)⋯O(2) and N(1)–H(1)⋯O(1) interaction. (b) Stacked polymeric chains of 3MPA. | |
The C(3)–N(1)–C(11)–C(12) dihedral angle in 2AMT turns out to be 73.3(4)°, which suggests the thiophene ring is above the plane of naphthoquinone ring. The crystal network in the 2AMT extends via head-to-tail C(8)–H(8)⋯O(2) and N(1)–H(1)⋯O(1) interactions. A “stair-case like” polymeric chains with the thiophene rings separated by C(15)–(H15)⋯O(1) (−1 + x, −1 + y, z) interactions down the b-axis can further be noticed from Fig. 4a and b. As shown the slipped π–π stacking are inferred along polymeric chain down the a-axis (Fig. 4a), in particular the benzenoid and quinonoid rings are stacked through C(9)⋯C(5) (3.66(1) Å) and C(7)⋯C(4) (3.69(1) Å) contacts.
 |
| | Fig. 4 (a) Molecular packing of 2AMT molecules down a-axis, (b) molecular packing of 2AMT molecules down b-axis, (c) polymeric chains formed by hydrogen bonding separated by thiophene rings. | |
The torsion angle C(3)–N(1)–C(11)–C(12) of 2EPA turns out to be −94.8° whereas C(13)–C(12)–C(11)–N(1) show a deviation of ∼10° from planarity. Molecules of 2EPA formed a dimeric synthon via ‘head to head’ interactions through N(1)–H(1)⋯O(2) interactions portrayed in Fig. 5. Furthermore the C(5)–H(5)⋯N(2) (−x, 1 − y, −z) interactions render stability to pyridyl rings of the dimer. Furthermore as shown in Fig. 5 the polymer chain of dimers are formed through C–(15)–H(15)⋯O(1) interactions.
 |
| | Fig. 5 (a) Neighboring molecules of EPA. (b) Dimeric chains of 2EPA formed by C–H⋯O interaction. | |
The torsion angle C(3)–N(1)–C(11)–C(12) in 2AET is 83° and C(13)–C(12)–C(11)–N(1) is 175°. Molecules of 2AET facilitate polymeric chain through N(1)–H(1)⋯O(1) interactions in addition to the C(14)–H(14)⋯Br(1) interactions. As shown in Fig. 6a, the polymeric chains of 2AET molecule further reveal C–H⋯π interactions between benzenoid and thiophene rings, in particular C(7)–H(7)⋯C(15) (3.61(3), −1/2 + x, 1/2 − y, −1/2 + z) interactions. When viewed down c-axis (Fig. 6b) the ‘butterfly like’ arrangement can be noticed (with bromines = eyes, ethyl thiophene = tentacles and naphthoquinone = wings of the butterfly).
 |
| | Fig. 6 (a) Molecular packing of 2AET molecules down b-axis and (b) down c-axis. | |
Overlay structures of 2MPA, 3MPA, 2AMT, 2EPA and 2AET
Fig. 7 displays the orientation of pyridyl and thiophene rings with the naphthoquinone. In 2MPA (Fig. 7a) pyridyl ring is nearly planar. The 2AMT and 3MPA reveal thiophene and pyridyl ring oriented respectively, above and below the plane of the naphthoquinone. A marginal variation in orientations of pyridyl and thiophene rings in the overlay structures of 2EPA and 2AET (Fig. 7b) can be noticed. It should be remarked here that chemosensing ability to the metal ions and the biological activity can be correlated to the ring planarity. The aminonaphthoquinone ligands here facilitate either bidentate or tridentate coordination with the metal ion. The tridentate coordination sites through O(2), N(1) and N(2) is favored over the bidentate coordination in 2MPA. On the other hand for 2EPA, the structure with the additional –CH2, one of the nitrogen N(2) will be further away from O(2) and N(1) the bidentate coordination is preferred.
 |
| | Fig. 7 Overlay structures of (a) 2MPA, 3MPA and 2AMT, (b) 2EPA and 2AET. | |
Hirshfeld surfaces
To probe various molecular interactions, Hirshfeld surfaces and their associated 2D finger print plots were derived with the use of Crystal Explorer 3.1 (ref. 56) employing the single crystal X-ray data. The function dnorm is a ratio encompassing the distances of any surface point to the nearest interior (di) and exterior (de) atom to the van der Waals radii of the atoms.57–59 Fig. 8a through 8d display surfaces those have been mapped with the dnorm, shape index, curvedness and finger print plots of aminonaphthoquinone ligands. For the crystal structure of the hitherto ligands the Hirshfeld surface is unique and provide detail insights of the crystal structure. A direct visual comparison imparts intense red color around the N–H substituent of the ligands which contribute largely toward N–H⋯O interactions (cf. Fig. 8a) except for the 2MPA. In addition to this C–H⋯O contacts are be deciphered through the intense red spots within 2EPA, 2MPA and 2AMT. The characteristic packing modes and the ways in which the nearby molecules contact one another further gauged through shape index and curvedness parameters. The shape index of all the molecules shows a red concave region on the surface around the oxygen atoms as well as π cloud of aromatic rings and a blue region around the hydrogen atoms. The presence of C–H⋯π and π–π stacking interactions in aminonaphthoquinone derivatives further are evident from the pattern of adjacent red and blue triangles those appear on the shape index surfaces and relatively large and flat green region on the same side of the molecule on the corresponding curvedness surfaces (cf. Fig. 8b and c). The breakdowns of finger-print plots for all such structures are illustrated in Fig. 8d. From the FP plots, contributions from the N–H⋯O, C–H⋯O, C–H⋯π, C–H⋯N and π–π stacking interactions can be segregated. Thus the volume (VH), area (SH), globularity (G) and asphericity (Ω) parameters based on Hirshfeld surfaces have been calculated. The following inferences are drawn. The term, globularity60 was observed at ∼0.764 for the aminonaphthoquinone derivatives which suggest that the molecular surface is more structured, and not a sphere. The asphericity61,62 that provides measure of anisotropy follows order: 2EPA (0.385) > 2AET (0.357) > 2MPA (0.317) > 3MPA (0.163) > 2AMT (0.136).
 |
| | Fig. 8 Hirshfeld surfaces mapped with (a) dnorm (b) shape index, (c) curvedness and (d) 2D finger print plots with di and de ranging from 0.6 to 2.4 Å for 2MPA, 2EPA, 3MPA, 2AMT and 2AET. | |
DFT investigations
Optimized structures of aminonaphthoquinone derivatives from the ωB97X based density functional theory are depicted in Fig. 9. Selected bond-distances and angles are compared with X-ray crystal data in Table S24.† Except for the NH bond bridging naphthoquinone and substituted pyridine moiety of 2MPA which is up to 0.22 Å longer relative to the experimental structure; the overall structural parameters agree well with those from the X-ray experiments. A comparison of 2MPA and 2AMT shows that carbonyl C(1)O(1) bond distances are shortened on substitution of thiophene instead of pyridine. It may readily be discernible that an increase of alkyl chain from methylene to ethylene engenders the reversal of the trend and accordingly longer C![[double bond, length as m-dash]](https://www.rsc.org/images/entities/char_e001.gif) O bond distances are predicted for 2AET compared to the 2EPA. These inferences are consistent with those observed from the X-ray crystal structure data. The bond angles show deviation maximally up to 2° compared to the X-ray crystal structures.
O bond distances are predicted for 2AET compared to the 2EPA. These inferences are consistent with those observed from the X-ray crystal structure data. The bond angles show deviation maximally up to 2° compared to the X-ray crystal structures.
 |
| | Fig. 9 Optimized structures of (a) 2MPA, (b) 3MPA (c) 2AMT (d) 2EPA (e) 2AET. Atomic labelling scheme is shown. | |
The structures of aminonaphthoquinone derivative anions are also obtained within the framework of ωB97X/6-31+G(d,p) theory which are portrayed in Fig. 10. Selected bond distances are given along with. As may readily be noticed the anions reveal longer CO or C–Br bond distances compared to their neutral analogs with the elongation up to ∼0.0238 Å was predicted for 2MPA.
 |
| | Fig. 10 Optimized structures of anionic form 2MPA, 3MPA, 2AMT, 2EPA and 2AET. | |
Interestingly the structural ramifications in calculated vibration frequencies and accompanying molecular interactions can be probed through normal vibration analysis. Calculated frequencies of 2MPA, 2AMT, 3MPA, 2EPA and 2AMT with those measured in the experiment are compared in Table S25† and portrayed in Fig. 11a and b. The N–H stretching assigned to 3242 cm−1 of 2MPA engenders a large frequency up shift that amounts to ∼73 cm−1 on substitution of the ethyl group instead of methyl as in 2EPA. The change of position of naphthoquinone to the 3 position of pyridine (in 3MPA) renders a blue-shift (up-shift) for the N–H stretching (3283 cm−1) vibration. A comparison of 2AMT and 2AET further led to similar inferences. The effect of pyridine or thiophene substitution on aminonaphthoquinone derivative shows its signature in NH stretching vibration which shows the corresponding frequency shift in the opposite directions for methyl and ethyl substituted derivatives (cf. Table S25†). The C(1)O(1) carbonyl stretching at 1651 cm−1 in 2AMT shifts to 1641 cm−1 in the calculated vibration spectra of 2AET. As opposed to this the carbonyl stretching at the 1640 cm−1 in 2MPA shifts to higher wave number 1649 cm−1 in the 3MPA isomer. The aromatic proton shows a band ∼2988 cm−1. The inferences borne out from the present DFT calculations are also in consonance with the experimentally measured spectra.
 |
| | Fig. 11 Observed and optimized FT-IR spectra of 2MPA, 3MPA, 2AMT, 2EPA and 2AET. The spectra is shown in two regions for peaks (a) –NH, –CH and (b) –CO, –C–N, –C–Br. | |
1H NMR chemical shifts (δH) in 2MPA, 2AMT, 3MPA, 2EPA and 2AET in DMSO (as solvent) were simulated through the SCRF-PCM theory. A comparison with the experiment is given in Table S26.† The H(1) proton participating in N–H⋯Br interactions in 2MPA emerge with relatively large deshielding (8.3 ppm) in the spectra. The signals of the corresponding proton in the rest of aminonaphthoquinone derivatives facilitate the N–H⋯O interactions and appear at ∼6.8 ppm. The alkyl protons emerge with up-field δH signals in the calculated 1H NMR. These inferences on the calculated δH values concur with the experiment.
Frontier orbitals HOMO and LUMO (isosurface of ±0.04 a.u.) in the aminonaphthoquinone ligands are portrayed in Fig. 12 and 13. The complimentarily in charge distributions between HOMO and LUMO is transparent for 3MPA, 2AMT and 2AET. Here the HOMO extends over the entire molecule. On the other hand, in 2MPA and 2EPA it has been largely localized near naphthoquinone framework. The electronic spectra in the presence of methanol were obtained using the TD-DFT theory. The wavelength maxima, oscillator strengths and orbital descriptors are summarized in Table S27.† It is transparent that the absorption band arising from the HOMO to LUMO transition shows up near ∼402 nm. The HOMO–LUMO energies, global indices of reactivity viz., chemical potential (μ), hardness (η), electrophilicity (ω) of aminonaphthoquinone derivative and its anionic form are summarized in Table S28.† A large separation of HOMO and LUMO energies (ΔE) in the molecule imply the reluctance toward the acceptance of electron in the LUMO while the removal of an electron from the HOMO renders electronic stability to the system. A large relative stability of 3MPA and 2AET is thus evident. The anionic forms of these emerge with the lower band gap energies relative to the corresponding neutral systems.
 |
| | Fig. 12 HOMO and LUMO in (a) 2MPA, (b) 3MPA (c) 2EPA (d) 2AMT (e) 2AET. | |
 |
| | Fig. 13 MOs namely, HOMO−1, HOMO−2 and HOMO−3 and LUMO+1, LUMO+2 and LUMO+3 in (a) 2MPA, (b) 3MPA, (c) 2AMT, (d) 2EPA, (e) 2AET are also depicted. These enable one to assign the transition in the electronic spectra derived from the TD-DFT theory. | |
To delve further in metal coordination we derive the structure of the Cu2+–2MPA complex, as a test example. As pointed out earlier the HOMO (isosurfaces of ±0.04 a.u.) of 2MPA largely resides on quinonoid ring of naphthoquinone moiety which on complexation extends over to the metal ion as shown in Fig. 14. The ligand to metal charge transfer, therefore can be inferred. These conclusions further may as well be extended to other metal complexes studied in the present work.
 |
| | Fig. 14 HOMO and LUMO in 2MPA–Cu2+ complexes. | |
Chemosensor evaluation studies
The metal ion binding studies of all the ligands have been carried in methanol, methanol–water mixture and in the presence of triethylamine. It has been observed that only 2MPA and 2EPA showed colour change with specifically with a few metal ions. The colour of the ligand solution changed as a result of metal complexes. Metal ions induced the deprotonation of –NH and create the legating sites. The extra stability of 3MPA and 2AET ligands do not favour the formation metal complexes at room temperature (26 °C), thus there is no colour change was observed with the solvents used for this studies in present investigation.
Fig. 15 showed the UV-visible absorption spectra of chemosensors 2MPA and 2EPA in methanol, in 1:1 (v/v) methanol–water in the absence and presence of a mild base triethylamine (TEA) while Fig. 17 showed the UV-visible spectra of the chemosensor 2MPA in the presence of transition metal ions in different solvents (the UV-visible spectra of for 2EPA are shown in Fig. S14 in ESI†). Table 4 showed the respective maximum absorption wavelength λmax at 455 nm in 2MPA and 468 nm for 2EPA in methanol. This band in 2MPA shows bathochromic shift in methanol–water ∼475 nm and hypsochromic shift in triethylamine. In UV region of the spectrum, the peak ∼331 nm is observed only in triethylamine while for other mixture of solvents only a hump was observed, which was assigned to π–π* transition.
 |
| | Fig. 15 UV-visible spectra of (a) 2MPA and (b) 2EPA in various solvents. | |
Table 4 Experimental UV-visible absorption spectra of chemosensors 2MPA and 2EPA
| Solvent systems |
λmax (nm) for 2MPA |
λmax (nm) for 2EPA |
| Methanol |
455, 284 |
468, 284 |
| Methanol + TEA |
437, 287 |
468, 280 |
| Methanol + water |
467, 272 |
477, 282 |
| Methanol + TEA + water |
458, 362, 282 |
475, 282 |
| TEA |
449, 331, 307 |
465, 334, 287 |
Metal ion binding studies
Metal ion binding studies were carried out in the following solvent systems, (i) in methanol, (ii) in 1:1 (v/v) methanol–water, (iii) in presence of a mild base triethylamine (TEA) in (i) and (ii) TEA was used to get the deprotonated form of the chemosensor ligands which can be used to detect other metal ions too. In typical experiments 2 ml of the chemosensor was mixed with 2 ml of metal ion solutions at room temperature (26 °C) and 1 ml of triethylamine was added in chemosensor solution in case of (i) and (ii) prior to the addition of metal ion solutions. UV-visible spectra of all solutions was measured using a typical concentration of 10−4 M. Photographs (Fig. 16 for 2MPA, Fig. 17 for 2EPA) were obtained for 10−3 M solutions of the chemosensor and metal ions (Cu2+, Ni2+, Zn2+, Co2+, Fe3+, Mn2+, Cr3+, Hg2+, La3+ and Cd2+).
 |
| | Fig. 16 (a) Color change in chemosensor 2MPA (10−4 M) with metal ions (10−4 M) in methanol, (b) chemosensor 2MPA (10−4 M) with metal ions (10−4 M) in methanol and triethylamine, (c) chemosensor 2MPA with metal ions (10−4 M) in methanol and water, (d) chemosensor 2MPA (10−4 M) with metal ions (10−4 M) in methanol–water–triethylamine. | |
 |
| | Fig. 17 (a) Color change in chemosensor 2EPA (10−4 M) with metal ions (10−4 M) in methanol, (b) chemosensor 2EPA (10−4 M) with metal ions (10−4 M) in methanol and triethylamine, (c) chemosensor 2EPA with metal ions (10−4 M) in methanol and water, (d) chemosensor 2EPA (10−4 M) with metal ions (10−4 M) in methanol, water and triethylamine. | |
Visual detection of metal ions in methanol
The orange color solutions of 2MPA and 2EPA showed colour changes on the addition of Cu2+, Ni2+ and ions in 2MPA (Fig. 16a) while 2EPA could differentiate colour change in Cu+ (blue) and Cu2+ (dark green) (Fig. 17a). The solutions of Mn2+, Co2+ and Zn2+ of 2MPA and Ni2+ become dark, while there is no observable colour change was seen for the other metal ions. The colour change was observed due to formation of coordination complexes by deprotonation of N–H of the chemosensor ligand. A new band was noticed for respectively at λmax to 601 nm and 620 nm for Cu2+ solution.
Visual detection of metal ions in methanol–triethylamine
The deprotonation of N–H of chemosensor was achieved by addition of mild base such as triethylamine and thus several metal ions could bind to the anionic chemosensor and the detectable colour change could be visualized by naked eyes. In this experiment, triethylamine was added prior to the addition of the metal ion solution, wherein only Cu2+, Ni2+ and Co2+ caused a colour change in 2MPA (Fig. 16b and 17b). A new band appeared in 600–800 nm for Cu2+, Ni2+, Zn2+, Co2+ in methanol (Fig. 18b), after addition of triethylamine. In addition the enhancement of peak at ∼330 nm was observed for most of the metal ions in presence of triethylamine. For Cu2+ this peak was shifted to 372 nm and 375 nm.
 |
| | Fig. 18 UV-visible spectra of (a) 2MPA (10−4 M) with metal ions (10−4 M) in methanol, (b) in methanol and triethylamine, (c) 2MPA in methanol and with metal ions (10−4 M) in water, (d) 2MPA in methanol and with metal ions (10−4 M) in water and triethylamine. | |
Visual detection of metal ions in methanol–water
In 1:1 mixture of methanol:water, only Cu2+ showed colour change from orange to dark blue for 2MPA and dark green for 2EPA (Fig. 16c and 17c). The colour change observed for Cu2+ in pure organic solvent was (pale green) and it varied in presence of water. Thus chemosensor 2MPA effectively differentiated the organic and aqueous media for Cu2+ ions. The visible absorption band of chemosensor 2EPA appeared at λmax 477 nm which on addition of Cu2+ (1:1) underwent an immediate visible colour change from orange to dark brown. Both chemosensors 2MPA and 2EPA did not undergo any colour change on addition of other metal ions like Ni2+, Zn2+, Co2+, Fe3+, Mn2+, Cr3+, Hg2+, La3+ and Cd2+ in 2EPA in methanol–water mixture.
Visual detection of metal ions methanol–water–triethylamine
With the introduction of triethylamine to the methanol–water mixture Mn2+ and Co2+ showed variable colour shades for the respective solutions (Fig. 16d and 17d). The UV-visible spectra (Fig. 18d) showed complete absence of the band in the ranges 600–800 nm and an enhancement of intensity of π–π* transition band at ∼362 nm in the methanol–water–triethylamine mixture.
Stoichiometry, affinity constant, competitive binding of metal ion of 2MPA and 2EPA
The binding stoichiometry of 2MPA and 2EPA (Fig. 18) with Cu2+, Ni2+ was determined by Job plot method. With 2MPA it is found to be 1:1 for Cu2+ ions in methanol, methanol–water while it is 2:1 for Ni2+ in methanol (Fig. 19) and for Cu2+ in methanol–water–trimethylamine mixture (Fig. S15†). For 2EPA the stoichiometry was observed as 1:1 for Cu2+ in methanol, methanol–trimethylamine and methanol–water solvent mixture (Fig. S16†).
 |
| | Fig. 19 Job plot obtained for Cu2+ and Ni2+ in methanol for 2MPA. | |
The binding constant of Cu2+ ion has been determined (fluorescence measurement) by Stern–Volmer plot (Fig. S17 and S18†) in methanol. The concentration of 2MPA/2EPA and metal ion used for this experiment are respectively (5 × 10⁻⁴) and (1 × 10⁻³ M). The association constant (Ka) value obtained for Cu2+ was found to be 851 M−1 for 2MPA and 6079 M−1 for 2EPA.
In the competitive binding of metal ions, in a typical experiments 2MPA and 2EPA (5 × 10⁻⁴ M) was mixed with equal volume of Cu2+, Ni2+ and Co2+ (5 × 10⁻⁴ M). Noticeable colour changes occur in solution mixture of metal ions (Fig. S19†) for 2MPA and 2EPA as well as in UV-visible and fluorescence spectra of selected metal ion (Fig. S20 for 2MPA and Fig. S21 for 2EPA†). Cu2+ showed significant fluorescence quenching in both 2MPA and 2EPA while other metal ion only cause small changes in fluorescence intensity. It was observed in competitive experiment, the Ni2+ and Co2+ competed to bind with 2MPA and 2EPA, however Cu2+ dominate all other metal ion because of higher binding constant.
Conclusions
The aminonaphthoquinones containing different heterocyclic amines were synthesized and characterized. Diverse crystal network patterns have been noticed for differently substituted heterocyclic rings. 2AMT and 3MPA reveal the thiophene and pyridyl rings near normal to naphthoquinone ring whereas the 2MPA shows pyridyl ring orients near planar facilitating tridentate coordination to metal ion(s). A bidentate coordination is preferred in case of 2EPA which can be attributed to an increased separation between N–H and pyridyl nitrogen. The separation being expected to be further increase in 2AET compared to 2EPA. The aminonaphthoquinone ligands possess a variety of hydrogen bonding in addition to those arising from C–H⋯π and π–π stacking interactions. The close proximity of pyridyl ring and –NH proton to Br atom in the 2MPA engenders the largely deshielded (8.3 ppm) signal in 1H NMR spectra compared to the rest of the ligands; the inference which has been corroborated by the DFT computations. 2MPA and 2EPA can be used for naked eye detection of Cu2+ from organic and aqueous media with the remarkable selectivity.
Experimental section
General materials and methods
Chemicals and reagents viz. 2-3-dibromo-1,4-napthoquinone (DBrNQ), 2-picolylamine, 3-picolylamine, 2-(2′-aminomethyl)thiophene, 2-(2′-aminoethyl)pyridine, 2-(2-aminomethyl)thiophene used were purchased from Sigma-Aldrich and used as received. The solvents used such as dichloromethane, toluene, methanol are of analytical grade were purchased from Merck Chemicals. CuCl2·2H2O, NiCl2·6H2O, ZnCl2, CoCl2·6H2O, HgCl2, triethylamine, methanol and dichloromethane were obtained from Merck chemicals. FeCl3·6H2O was obtained from Qualigens Chemicals. CrCl3·6H2O, CdSO4, MnCl2·4H2O was obtained from Fluka. LaCl3·7H2O was obtained from Thomas and Baker. Milli-Q water was used for preparation of aqueous solutions. Solvents were distilled by standard methods63 and dried wherever necessary. Melting points of compounds was determined using melting point apparatus (Make-METTLER). The FT-IR spectra of all ligands was recorded between 4000–400 cm−1 as KBr (Fig. S1, S2 and Table S1 in ESI†) pellets on BRUKER Tensor 37 Spectrometer. 1H, 13C, DEPT, HSQC, COSY NMR of all compounds were recorded (Fig. S3 and S7, Tables S2 and S3 in ESI†) in DMSO-d6, on Varian 500 MHz NMR instrument. TMS (tetramethylsilane) was used as the reference. UV-visible spectra of all ligands in CDCl3 was recorded from 200 nm to 800 nm on Shimadzu UV 1800 spectrophotometer (Fig. S8 in ESI†). Elemental analysis was performed on Thermo Finnigan EA 1112 Flash series Elemental.
Synthesis
1 mM of 2-3-dibromo-1,4-napthoquinone (0.315 g) was dissolved in 15 ml of dichloromethane and the mixture stirred for about 15 min. To this solution 1 mM, corresponding amines (1 mM = 0.104 ml of 2-picolylamine, 0.0103 ml 3-picolylamine, 0.126 ml of 2-aminoethylpyridine, 0.103 ml of 2-thiophenemethylamine, 0.120 ml of 2-thiopheneethylamine) were added drop wise. The reaction mixture was stirred for 24 hours at room temperature (26 °C) with constant magnetic stirring till completion of the reaction monitored on TLC. The reaction mixture was evaporated under reduced pressure and the residue was column chromatographed over silica gel in methanol/toluene (1:9) system. The orange color solid products were obtained after evaporation of pure fraction from the column. In case of 2MPA a light orange color fraction was obtained other than the main product which was characterized as 2-bromo-3-methyl-1,4-naphthoquinone.
Characterization
2-(2′-Aminomethyl)pyridyl-3-bromo-naphthalene-1,4-dione; 2MPA. Dark orange crystals. Yield: 0.222 g (65%). Mp: 132–135 °C. Anal. data calcd for C16H11O2N2Br (%): C, 55.99; H, 3.23; N, 8.16. Found (%): C, 55.83; H, 3.27; N, 7.95. FT-IR (KBr, νmax (cm−1)): 3242, 3061, 1680, 1601, 1564, 1493, 1435, 1327, 1292, 1250, 1207, 1134, 1039, 1001, 895, 829, 787, 758, 723, 679, 638, 573, 542, 489, 449. 1H NMR (CDCl3, 499.81 MHz, δ (ppm)): 8.65 (d, J = 4.50 Hz, 1H, Ar), 8.16 (d, J = 7.50 Hz, 1H, Ar), 7.72 (m, 2H, Ar), 7.64 (t, J = 7.50 Hz, 1H, Ar), 7.30 (d, J = 8.00 Hz, 1H, Ar), 7.27 (t, J = 6.25 Hz, 1H, Ar), 7.91 (s, 1H, –NH), 5.21 (d, J = 5.00 Hz, 2H). 13C NMR (CDCl3, 125.69 MHz, δ (ppm)): 49.21, 121.97, 122.87, 127.02, 127.15, 130.00, 132.54, 132.59, 134.89, 137.11, 146.50, 149.18, 155.21, 176.50, 180.54. UV-Vis, (λmax, DMSO (nm)): 467.
2-(3′-Aminomethyl)pyridyl-3-bromo-naphthalene-1,4-dione; 3MPA. Orange brown crystals. Yield: 0.301 g (88%). Mp: 140.83 °C. Anal. data calcd for C16H11O2N2Br (%): C, 55.99; H, 3.23; N, 8.16. Found (%): C, 56.46; H, 2.86; N, 8.37. FT-IR (KBr, νmax (cm−1)): 3267, 3109, 3022, 2951, 2602, 2260, 1955, 1684, 1631, 1595, 1512, 1473, 1425, 1329, 1300, 1246, 1128, 1063, 1028, 964, 860, 717.54, 678, 634, 540, 499, 445. 1H NMR (CDCl3, 499.81 MHz, δ (ppm)): 8.62 (s, 1H, Ar), 8.57 (d, J = 4.50 Hz, 1H, Ar), 8.12 (d, J = 7.50 Hz, 1H, Ar), 8.01 (d, J = 8.00 Hz, 1H, Ar), 7.70 (m, 2H, Ar), 7.64 (t, J = 8.00 Hz, 1H, Ar), 7.33 (t, J = 6.50 Hz, 1H, Ar), 6.28 (s, –NH), 5.11 (d, J = 6.50 Hz, 2H, –CH2). 13C NMR (CDCl3, 125.69 MHz, δ (ppm)): 46.73, 124.06, 126.94, 127.21, 127.37, 129.98, 132.27, 132.91, 133.98, 135.12, 135.57, 146.36, 149.16, 149.435, 176.75, 180.08. UV-Vis, (λmax, DMSO (nm)): 471.
2-(2′-Aminomethyl)thiophenyl-3-bromo-naphthalene-1,4-dione; 2AMT. Dark brown crystals. Mp: 119.79 °C. Yield: 0.337 g (97%). Anal. data calcd for C15H10O2NSBr (%): C, 51.73; H, 2.89; N, 4.022; S, 9.21. Found C, 52.12; H, 2.87; N, 4.31; S, 8.67. FT-IR (KBr, νmax (cm−1)): 3462, 3284, 3194, 3109, 3043, 3012, 2966, 2920, 2850, 2594, 2455, 2283, 2083, 1990, 1894, 1867, 1685, 1633, 1570, 1510, 1431, 1300, 1244, 1153, 1126, 1057, 1026, 860, 835, 781, 705, 623, 542, 447, 408. 1H NMR (CDCl3, 499.81 MHz, δ (ppm)): 8.14 (d, J = 7.50 Hz, 1H, Ar), 8.03 (d, J = 7.00 Hz, 1H, Ar), 7.72 (t, J = 7.74 Hz, 1H, Ar), 7.64 (t, J = 7.50 Hz, 1H, Ar), 7.29 (t, J = 5.00 Hz, 1H, Ar), 7.07 (d, J = 3.00 Hz, 1H, Ar), 7.00 (t, J = 4.25 Hz, 1H, Ar), 6.10 (s, –NH), 5.25 (s, 2H, –CH2). 13C NMR (CDCl3, 125.69 MHz, δ (ppm)): 44.06, 125.91, 126.59, 126.74, 126.97, 127.09, 127.20, 129.86, 132.16, 132.65, 134.86, 140.10, 146.00, 176.20, 180.00. UV-Vis, (λmax, DMSO (nm)): 463.
2-(2′-Aminoethyl)pyridyl-3-bromo-naphthalene-1,4-dione; 2EPA. Dark red crystals. Yield: 0.342 g (96%). Mp: 127.60 °C. Anal. data calcd for C17H13O2N2Br (%): C, 57.16; H, 3.66; N, 7.84. Found (%): C, 57.21; H, 3.78; N, 7.47. FT-IR (KBr, νmax (cm−1)): 3321, 3192, 3032, 3003, 2937, 2875, 1992, 1892, 1672, 1610, 1525, 1446, 1330, 1296, 1257, 1157, 1130, 1074, 1022, 993, 954, 786, 758, 727, 686, 653, 542, 497, 420. 1H NMR (CDCl3, 300 MHz, δ (ppm)): 8.59 (d, J = 5.00 Hz, 1H, Ar), 8.13 (d, J = 7.00 Hz, 1H, Ar), 8.00 (d, J = 7.00 Hz, 1H, Ar), 7.58–7.70 (m, 3H, Ar), 7.21 (d, J = 8.49 Hz, 1H, Ar), 7.18 (t, J = 3.75 Hz, 1H, Ar), 7.12 (s, 1H, –NH), 4.32 (q, J = 6.33 Hz, 2H, –CH2), 3.17 (t, J = 3.75 Hz, 2H, –CH2). 13C NMR (CDCl3, 125.69 MHz, δ (ppm)): 38.05, 44.69, 122.09, 123.65, 126.97, 127.13, 130.20, 132.44, 132.58, 134.86, 137.04, 146.60, 158.65, 176.31, 176.10, 180.45. UV-Vis, (λmax, DMSO (nm)): 477.
2-(2′-Aminoethyl)thiophenyl-3-bromo-naphthalene-1,4-dione; 2AET. Dark brown crystals. Mp: 115–116 °C. Yield: 0.347 g (96%). Anal. data calcd for C16H12O2NSBr (%): C, 53.05; H, 3.33; N, 3.86; S, 8.85. Found (%): C, 53.25; H, 3.47; N, 3.93; S, 8.58. FT-IR (KBr, νmax (cm−1)): 3263, 3063, 2960, 1857, 1674, 1610, 1541, 1440, 1438, 1261, 1255, 1016, 603, 540, 495. 1H NMR (CDCl3, 499.81 MHz, δ (ppm)): 8.15 (d, J = 7.50 Hz, 1H, Ar), 8.02 (d, J = 7.50 Hz, 1H, Ar), 7.72 (t, J = 7.50 Hz, 1H, Ar), 7.63 (t, J = 7.25 Hz, 1H, Ar), 7.20 (d, J = 4.99 Hz, 1H, Ar), 6.97 (t, J = 4.25 Hz, 1H, Ar), 6.92 (d, J = 4.99 Hz, 1H, Ar), 6.18 (s, 1H, –NH), 4.18 (q, J = 6.66 Hz, 2H, –CH2), 3.23 (t, J = 6.25 Hz, 2H, –CH2), 13C NMR (CDCl3, 125.69 MHz, δ (ppm)): 31.45, 46.50, 124.72, 126.19, 127.12, 127.31, 127.41, 130.01, 132.51, 132.67, 135.05, 140.03, 146.50, 176.60, 180.23. UV-Vis, (λmax, DMSO (nm)): 472.
X-ray crystallographic data collection and refinement of the structures
The X-ray quality red crystals of 2MPA, 3MPA, 2AMT, 2EPA and 2AET were obtained after evaporation of red pure fraction from the column. Crystals of appropriate size were chosen for data collection.
Data for all three compounds have been collected on D8 Venture PHOTON 100 CMOS diffractometer using graphite monochromatized Mo-Kα radiation (λ = 0.7107 Å) with exposure/frame = 10 s for 2MPA and 3MPA, 15 s for 2AMT, 20 s for 2EPA respectively whereas Cu-Kα radiation (1.5406 Å) with exposure/frame = 12 s for 2AET respectively has been used. The X-ray generator was operated at 50 kV and 30 mA for Mo-Kα radiation and at 50 kV and 1 mA for Cu-Kα. An initial set of cell constants and an orientation matrix were calculated from total 24 frames and 60 frames for Mo and Cu source respectively. The optimized strategy used for data collection consisted different sets of φ and ω scans with 0.5° steps in φ/ω. Crystal to detector distance was 5.00 cm with 512 × 512 pixels/frame, oscillation/frame −0.5°, maximum detector swing angle = −30.0°, beam centre = (260.2, 252.5), in plane spot width = 1.24. Data integration was carried out by Bruker SAINT program and empirical absorption correction for intensity data were carried out by Bruker SADABS. The programs are integrated in APEX II package.64 The data were corrected for Lorentz and polarization effect. The structure was solved by Direct Method using SHELX-97.65 The final refinement of the structure was performed by full-matrix least-squares techniques with anisotropic thermal data for non-hydrogen atoms on F2. The non-hydrogen atoms were refined anisotropically whereas the hydrogen atoms were refined at calculated positions as riding atoms with isotropic displacement parameters. Molecular diagrams were generated using ORTEP-3 (ref. 66) and Mercury programs.67 Structural calculations were performed using SHELXTL65 and PLATON.68
DFT studies
Optimized structures were derived using the ωB97X69 based density functional theory employing the Gaussian-09 program.70 The internally stored 6-31G basis set with diffuse functions added to on all the heavy atoms (designated as 6-31+G(d,p) basis) have been used for optimizations.71 The stationary point structures thus obtained were confirmed to be local minima on the potential energy surfaces through vibrational frequency calculations. Frontier orbitals were computed in the same framework of theory. Time Dependent Density Functional Theory (TD-DFT) was employed to derive the electronic spectra. To understand a charge transfer accompanying the metal coordination we carried out computations on the Cu complex of 2MPA as a model example.
Metal ion binding studies, Jobs plot and competitive binding experiment
Metal ion binding studies were evaluated by following methods, (i) in methanol solution of chemosensor and metal ions (1 × 10⁻⁴), (ii) 1 × 10⁻⁴ M solution of (i) in presence of triethylamine, (iii) methanol (chemosensor 1 × 10⁻⁴ M) and water (metal ion, 1 × 10⁻⁴ M) mixture and (iv) 1 × 10⁻⁴ M solution of (iii) in presence of triethylamine. In all methods 2 ml of chemosensor was mixed with 2 ml of metal ion solution at room temperature (26 °C). 1 ml triethylamine was added in chemosensor solution in case of (ii) and (iv) prior to addition of metal ion solution. UV-visible and fluorescence spectra of all solution were measured.
Micro molar concentration (10–100 μM) of chemosensor and metal ion were used for Jobs plot experiment. Solutions were prepared by varying concentration of chemosensor and metal ions. Binding constant of Cu2+ ion was determined by Stern–Volmer plot. 5 × 10⁻⁴ M solution of chemosensor and 1 × 10⁻³ M metal ion solution in methanol were used to obtain the same.
For competitive binding of metal ions (5 × 10⁻³ M) with 2MPA and 2EPA (5 × 10⁻³ M) equal volume were mixed and UV-visible spectra of all solution were measured.
Acknowledgements
SSG grateful to RGYI scheme of Department of Biotechnology, New Delhi, India for Ref. No. (BT/PR6565/GBD/27/456/2012) and Mr Rishikesh Patil for NMR spectra.
References
- C. C. Nawrat, L. I. Palmer, A. J. Blake and C. J. Moody, J. Org. Chem., 2013, 78, 5587–5603 CrossRef CAS PubMed.
- C. A. Kuttruff, S. Geiger, M. Cakmak, P. Mayer and D. Trauner, Org. Lett., 2012, 14, 1070–1073 CrossRef CAS PubMed.
- B. D. Bala, S. Muthusaravanan, T. S. Choon, M. A. Ali and S. Perumal, Eur. J. Med. Chem., 2014, 85, 737–746 CrossRef PubMed.
- B. Prescott, J. Med. Chem., 1969, 12, 181–182 CrossRef CAS PubMed.
- G. J. Kapadia, M. A. Azuine, V. Balasubramanian and R. Sridhar, Pharmacol. Res., 2001, 43, 363–367 CrossRef CAS PubMed.
- M. D. Sarma, R. Ghosh, A. Patra and B. Hazra, Eur. J. Med. Chem., 2008, 43, 1878–1888 CrossRef PubMed.
- T. D. Suja, K. V. L. Divya, L. V. Naik, A. Ravi Kumar and A. Kamal, Bioorg. Med. Chem. Lett., 2016, 26, 2072–2076 CrossRef CAS PubMed.
- E. N. da Silva Jr, B. C. Cavalcanti, T. T. Guimarães, M. D. C. F. R. Pinto, I. O. Cabral, C. Pessoa, L. V. Costa-Lotufo, M. O. de Moraes, C. K. Z. de Andrade, M. R. dos Santos, C. A. de Simone, M. O. F. Goulart and A. V. Pinto, Eur. J. Med. Chem., 2011, 46, 399–410 CrossRef PubMed.
- S. L. de Castro, F. S. Emery and E. N. da Silva Júnior, Eur. J. Med. Chem., 2013, 69, 678–700 CrossRef CAS PubMed.
- O. Pawar, A. Patekar, A. Khan, L. Kathawate, S. Haram, G. Markad, V. Puranik and S. Salunke-Gawali, J. Mol. Struct., 2014, 1059, 68–74 CrossRef CAS.
- W. Wang, T. Li, R. Milburn, J. Yates, E. Hinnant, M. J. Luzzio, S. A. Noble and G. Attardo, Bioorg. Med. Chem. Lett., 1998, 8, 1579–1584 CrossRef CAS PubMed.
- E. Thines, H. Anke and O. Sterner, J. Nat. Prod., 1998, 61, 306–308 CrossRef CAS PubMed.
- E. A. Hillard, F. C. de Abreu, D. C. M. Ferreira, G. Jaouen, M. O. F. Goulart and C. Amatore, Chem. Commun., 2008, 2612–2628 RSC.
- M. O. F. Goularta, P. Falkowski, T. Ossowski and A. Liwo, Bioelectrochemistry, 2003, 59, 85–87 CrossRef.
- A. Illos, E. Harlev and S. Bittner, Tetrahedron Lett., 2005, 46, 8427–8430 CrossRef.
- K. Boudalis, X. Policand, A. Sournia-Saquet, B. Donnadieu and J. P. Tuchagues, Inorg. Chim. Acta, 2008, 361, 1681–1688 CrossRef.
- T. J. Monks, R. P. Hanzlik, G. M. Cohen, D. Ross and D. G. Graham, Toxicol. Appl. Pharmacol., 1992, 112, 2–16 CrossRef CAS PubMed.
- J. L. Bolton, M. A. Trush, T. M. Penning, G. Dryhurst and T. J. Monks, Chem. Res. Toxicol., 2000, 13, 135–160 CrossRef CAS PubMed.
- J. Benites, J. A. Valderrama, H. Taper and P. Buc Calderon, Chem. Pharm. Bull., 2009, 57, 615–619 CrossRef CAS PubMed.
- L. Serrano-Andres, M. Merchan, B. O. Roos and R. Lindh, J. Am. Chem. Soc., 1995, 117, 3189–3202 CrossRef CAS.
- M. Aguilar-Martinez, G. Cuevas, M. Jimenez-Estrada, I. Gonzalez, B. Lotina-Hennsen and N. Macias-Ruvalcaba, J. Org. Chem., 1999, 64, 3684–3694 CrossRef CAS PubMed.
- J. Fabian and M. Neprab, Collect. Czech. Chem. Commun., 1980, 45, 2605–2620 CrossRef CAS.
- N. Diaz, J. Photochem. Photobiol., A, 1990, 53, 141–273 CrossRef.
- H. Miyaji and J. L. Sessler, Angew. Chem., Int. Ed., 2001, 40, 154–157 CrossRef CAS.
- H. Miyaji, W. Sato and J. L. Sessler, Angew. Chem., Int. Ed., 2000, 39, 1777–1780 CrossRef CAS.
- E. J. Cho, H. M. Yeo, B. J. Ryu, H. A. Jeong and K. C. Nam, Bull. Korean Chem. Soc., 2006, 27, 1967–1968 CrossRef CAS.
- D. Jimenez, R. M. Manez, F. Sancenon and J. Soto, Tetrahedron Lett., 2002, 43, 2823–2825 CrossRef CAS.
- Y. P. Tseng, G. M. Tu, C. H. Lin, C. T. Chang, C. Y. Lin and Y. P. Yen, Org. Biomol. Chem., 2007, 5, 3592–3598 CAS.
- Z. H. Liu, S. Devaraj, C. R. Yang and Y. P. Yen, Sens. Actuators, B, 2012, 174, 555–562 CrossRef CAS.
- Y. S. Lin, G. M. Tu, C. Y. Lin, Y. T. Chang and Y. P. Yen, New J. Chem., 2009, 33, 860–867 RSC.
- W. C. Lin, Y. P. Tseng, C. Y. Lin and Y. P. Yen, Org. Biomol. Chem., 2011, 15, 5547–5553 Search PubMed.
- H. Yang, Z. G. Zhou, J. Xu, F. Y. Li, T. Yi and C.-H. Huang, Tetrahedron, 2007, 63, 6732–6736 CrossRef CAS.
- B. Wannalerse, T. Tuntulani and B. Tomapatanaget, Tetrahedron, 2008, 64, 10619–10624 CrossRef CAS.
- X. Peng, Y. Wu, J. Fan, M. Tian and K. Han, J. Org. Chem., 2005, 70, 10524–10531 CrossRef CAS PubMed.
- N. Kumari, S. Jha and S. Bhattacharya, J. Org. Chem., 2011, 76, 8215–8222 CrossRef CAS PubMed.
- R. M. F. Batista, E. Oliveira, S. P. G. Costa, C. Lodeiro and M. M. M. Raposo, Org. Lett., 2007, 9, 3201–3204 CrossRef CAS PubMed.
- K. Yoshida, T. Mori, S. Watanabe, H. Kawai and T. Nagamura, J. Chem. Soc., Perkin Trans. 2, 1999, 393–398 RSC.
- S. P. Wu, K. J. Du and Y. M. Sung, Dalton Trans., 2010, 39, 4363–4368 RSC.
- S. P. Wu, R. Y. Huang and K. J. Du, Dalton Trans., 2009, 24, 4735–4740 RSC.
- S. Madhupriya and K. P. Elango, Spectrochim. Acta, Part A, 2012, 97, 100–104 CrossRef CAS PubMed.
- S. Madhupriya and K. P. Elango, Spectrochim. Acta, Part A, 2012, 97, 429–434 CrossRef CAS PubMed.
- B. R. Jali, K. Masud and J. B. Baruah, Polyhedron, 2013, 51, 75–81 CrossRef CAS.
- S. Kumar, R. Saini and D. Kaur, Sens. Actuators, B, 2011, 160, 705–712 CrossRef CAS.
- A. Satheshkumar, R. Manivanan and K. P. Elango, J. Organomet. Chem., 2014, 750, 98–106 CrossRef CAS.
- S. Madhypriya and K. P. Elango, Synth. React. Inorg., Met.-Org., Nano-Met. Chem., 2014, 44, 1104–1114 CrossRef.
- N. Laurieri, M. H. J. Crawford, A. Kawamura, I. M. Westwood, J. Robinson, A. M. Fletcher, S. G. Davies, E. Sim and A. J. Russell, J. Am. Chem. Soc., 2010, 132, 3238–3239 CrossRef CAS PubMed.
- S. Salunke-Gawali, O. Pawar, M. Nikalje, R. Patil, T. Weyhermüller, V. G. Puranik and V. B. Konkimalla, J. Mol. Struct., 2014, 1056–1057, 97–103 CrossRef CAS.
- D. Chadar, M. Camilles, R. Patil, A. Khan, T. Weyhermüller and S. Salunke-Gawali, J. Mol. Struct., 2015, 1086, 179–189 CrossRef CAS.
- R. Patil, D. Chadar, D. Chaudhari, J. Peter, M. Nikalje, T. Weyhermüller and S. Salunke-Gawali, J. Mol. Struct., 2014, 1075, 345–351 CrossRef CAS.
- L. Kathawate, P. V. Joshi, T. K. Dash, S. Pal, M. Nikalje, T. Weyermüller, V. G. Puranik, V. B. Konkimalla and S. Salunke-Gawali, J. Mol. Struct., 2014, 1075, 397–405 CrossRef CAS.
- D. Chadar, S. S. Rao, A. Khan, S. P. Gejji, K. S. Bhat, T. Weyhermüller and S. Salunke-Gawali, RSC Adv., 2015, 5, 57917–57929 RSC.
- D. Chadar, S. S. Rao, S. P. Gejji, B. Ugale, C. M. Nagaraja, M. Nikalje and S. Salunke-Gawali, RSC Adv., 2015, 5, 76419–76426 RSC.
- S. Pal, V. B. Konkimalla, L. Kathawate, S. S. Rao, S. P. Gejji, V. G. Puranik, T. Weyhermüller and S. Salunke-Gawali, RSC Adv., 2015, 5, 82549–82563 RSC.
- A. Ware, A. Patil, S. Khomane, T. Weyhermüller, S. Pingale and S. Salunke-Gawali, J. Mol. Struct., 2015, 1093, 39–48 CrossRef CAS.
- A. Patil, A. P. Ware, S. Bhand, D. Chakrovarty, R. Gonnade, S. S. Pingale and S. Salunke-Gawali, J. Mol. Struct., 2016, 1114, 132–143 CrossRef CAS.
- S. Wolff, D. Grimwood, J. McKinnon, M. Turner, D. Jayatilaka and M. Spackman, CrystalExplorer 3.1, 2013, University of Western Australia, Crawley, Western Australia, 2005–2013, http://hirshfeldsurface.net/CrystalExplorer Search PubMed.
- F. L. Hirshfeld, Theor. Chim. Acta, 1977, 44, 129–138 CrossRef CAS.
- M. A. Spackman and D. Jayatilaka, CrystEngComm, 2009, 11, 19–32 RSC.
- M. A. Spackman and J. J. McKinnon, CrystEngComm, 2002, 4, 378–392 RSC.
- J. J. McKinnon, M. A. Spackman and A. S. Mitchell, Acta Crystallogr., Sect. B: Struct. Sci., 2004, 60, 627–668 CrossRef PubMed.
- J. Rudnick and G. Gaspari, J. Phys. A: Math. Gen., 1986, 19, L191–L193 CrossRef.
- A. Baumgartner, J. Chem. Phys., 1993, 99, 7496–7501 CrossRef.
- D. D. Perrin, W. L. Armarego and D. R. Perrin, Purification of Laboratory Chemicals, Pergamon Press, London, 1988, p. 260 Search PubMed.
- Bruker, APEX2, SAINT and SADABS, Bruker AXS Inc., Madison, Wisconsin, USA, 2007 Search PubMed.
- G. M. Sheldrick, Acta Crystallogr., Sect. A: Found. Crystallogr., 2008, 64, 112–122 CrossRef CAS PubMed.
- L. J. Farrugia, J. Appl. Crystallogr., 2012, 45, 849–854 CrossRef CAS.
- C. F. Macrae, I. J. Bruno, J. A. Chisholm, P. R. Edgington, P. McCabe, E. Pidcock, L. RodriguezMonge, R. Taylor, J. van de Streek and P. A. Wood, J. Appl. Crystallogr., 2008, 41, 466–470 CrossRef CAS.
- A. L. Spek, Acta Crystallogr., Sect. D: Biol. Crystallogr., 2009, 65, 148–155 CrossRef CAS PubMed.
- J. D. Chai and M. Head-Gordon, J. Chem. Phys., 2008, 128, 84–106 CrossRef PubMed.
- M. J. Frisch, G. W. Trucks, H. B. Schlegel, G. E. Scuseria, M. A. Robb, J. R. Cheeseman, J. A. Montgomery Jr, T. Vreven, K. N. Kudin, J. C. Burant, J. M. Millam, S. S. Iyengar, J. Tomasi, V. Barone, B. Mennucci, M. Cossi, G. Scalmani, N. Rega, G. A. Petersson, H. Nakatsuji, M. Hada, M. Ehara, K. Toyota, R. Fukuda, J. Hasegawa, M. Ishida, T. Akajima, Y. Honda, O. Kitao, H. Nakai, M. Klene, X. Li, J. E. Knox, H. P. Hratchian, J. B. Cross, V. Bakken, C. Adamo, J. Jaramillo, R. Gomperts, R. E. Stratmann, O. Yazyev, A. J. Austin, R. Cammi, C. Pomelli, J. W. Ochterski, P. Y. Ayala, K. Morokuma, G. A. Voth, P. Salvador, J. J. Dannenberg, V. G. Zakrzewski, S. Dapprich, A. D. Daniels, M. C. Strain, O. Farkas, D. K. Malick, A. D. Rabuck, K. Raghavachari, J. B. Foresman, J. V. Ortiz, Q. Cui, A. G. Baboul, S. Clifford, J. Cioslowski, B. B. Stefanov, G. Liu, A. Liashenko, P. Piskorz, I. Komaromi, R. L. Martin, D. J. Fox, T. Keith, M. A. Al-Laham, C. Y. Peng, A. Nanayakkara, M. Challacombe, P. M. W. Gill, B. Johnson, W. Chen, M. W. Wong, C. Gonzalez and J. A. Pople, Gaussian03, revision, Gaussian, Inc., Pittsburgh, PA, 2003 Search PubMed.
- G. A. Petersson, T. G. Tensfeldt and J. A. Montgomery Jr, J. Chem. Phys., 1991, 94, 6091–6101 CrossRef CAS.
Footnote |
| † Electronic supplementary information (ESI) available: FT-IR, 1H and 13C NMR, 2D HSQC, UV-visible spectra are presented in Fig. S1 through Fig. S8. Crystallographic figures Fig. S9 through Fig. S13. UV-visible spectra of 2EPA in various solvents Fig. S14. Job plot Fig. S15 and S16. Binding constant Fig. S17 and S18. Competative metal ion binding studies Fig. S19 through Fig. S21. FT-IR Table S1, NMR chemical shifts Tables S2 and S3. Crystallographic Tables S4–S23. DFT studies Table S24 through Table S28. CCDC 1446762, 1446761, 1446759, 1446760 and 1446920. For ESI and crystallographic data in CIF or other electronic format see DOI: 10.1039/c6ra20970j |
|
| This journal is © The Royal Society of Chemistry 2016 |
Click here to see how this site uses Cookies. View our privacy policy here. 


