Structural investigation of calcium borosilicate glasses with varying Si/Ca ratios by infrared and Raman spectroscopy

Yuanming Laia, Yiming Zengb, Xiaoli Tanga, Huaiwu Zhanga, Jiao Hanb and Hua Su*a
aState Key Laboratory of Electronic Thin Films and Integrated Devices, University of Electronic Science and Technology of China, Chengdu 610054, PR China. E-mail: uestcsh77@163.com; Tel: +86 2883203793
bState Key Laboratory of Advanced Technologies for Comprehensive Utilization of Platinum Metals, Kunming Institute of Precious Metals, Kunming 650106, PR China

Received 20th August 2016 , Accepted 24th September 2016

First published on 26th September 2016


Abstract

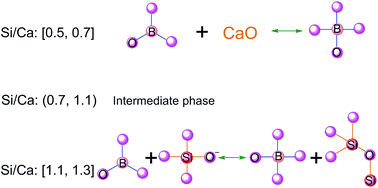
Calcium borosilicate glasses with varying Si/Ca ratios (with constant Si/B value) have been successfully prepared using a normal melt-quench technique. Structural features were investigated through infrared (IR) spectroscopy, Raman spectroscopy and differential thermal analysis (DTA). The IR and Raman spectra showed a Si/Ca ratio-dependent structure of borosilicate, which can provide valuable information to predict the composition and structure relations in the glasses. Conversion of BO3 to BO4 units was driven mainly by the disproportionation reaction between BO3 units and CaO when 0.5 ≤ Si/Ca ≤ 0.7. However, the BO3 units captured the non-bridging oxygens of Q1 units when 1.1 ≤ Si/Ca ≤ 1.3, resulting in the formation of more BO4 and Si–O–Si bonds. Qn (n = 0, 1, 2, 3, 4) notation was used to represent the SiO4 tetrahedral units, where n is the number of bridging oxygen per SiO4 unit. The intermediate phase was presented when 0.7 < Si/Ca < 1.1. Variations in density, glass transition temperature and thermal stability as functions of Si/Ca ratios correspond to the change in BO4, BO3 and SiO4 structural units. The intermediate phase results in maximum density, minimum molar volumes and maximum Tg, which can be expected to be the optimum candidate for applications.

1. Introduction

Borosilicate glass has attracted much interest in science and engineering. This glass has been extensively used for various technical applications, such as from containers to display glasses,1,2 immobilisation of nuclear waste,3–5 low-temperature co-fired ceramic6,7 and bioactive materials,8,9 because of its significant chemical durability, excellent electrical resistance and dielectric properties. Structural units are dependent on the composition of the glass and type of network modifier. The properties of these glasses are dominated by structural units. Silicon and boron structural units are used to understand the nature of the glass state. These units can also be used to control and design the properties of borosilicate glasses.2

The borate network has been extensively investigated using various methods.10,11 The network primarily includes BO3 and BO4 units and other important polymorphisms, such as isolated diborate [B4O7]2−, pentaborate [B5O8], triborate [B3O5], tetra-borate [B8O13]2− and pyroborate [B2O5]4− units.12 Addition of M2Ox (M = alkaline earth metal, and x is the valence state of M) to B2O3 results in the consumption of BO3 and its transformation to BO4 units rather than the creation of a non-bridging oxygen (NBO). Alternatively, the linkage between two BO3 units is collapsed, resulting in the creation of an NBO. The silicate glass is made up of different Qn units. NBOs are created when the linkages between the Qn units are broken with the addition of network modifier (such as alkaline earth oxide). Borosilicate glasses are composed of borate and silicate network formers, which consist of structural units such as BO3, BO4 and SiO4.12 The structural feature of borosilicate glasses has been widely examined using several techniques, such as nuclear magnetic resonance (NMR), Raman and IR spectroscopic techniques. Bray et al. used 11B NMR to study the structural models of sodium borosilicate glasses.13 Dell et al. proposed a comprehensive model based on the experimental results of 11B NMR and the calculation of R (R = mol% (Na2O)/mol% (B2O3)) on the structure units.14 Recently, a new model is recently proposed according to NMR and topological principles.2 The model included a network modifier, resulting in a competition between the creation of NBO and the formation of BO4 units. Raman spectra have been used to investigate the structural features of borosilicate glass, such as the type of silica tetrahedron and BO3/BO4 speciation.15 The relationship among structure, properties and modifier ion contents are observed in borosilicate glass based on Raman spectra.16 In addition, Raman spectroscopy was used to investigate the structure of borosilicate glass under extreme conditions. Fuhrmann et al. and Manara et al. showed that the structure of borosilicate glass was obtained under pressure and high temperature.17,18 The inelastic pressure–resistance depends on the Si–O–Si network, and compaction is accompanied by increasing structural homogeneity. The BO4 units are apparently unstable at high temperature. These units can be easily converted into metaborate chains or rings. Furthermore, IR spectra were used to provide quantitative information on the borosilicate glass structural units.19,20

The properties are functions of structural units in borosilicate glasses. Structural information of these glasses derived from spectral analysis contributes to the understanding of the nature of the glass state and the designing of materials with specific properties.21 Recently, the CaO–B2O3–SiO2 glass has been widely used in LTCC field because it has a low thermal expansion coefficient, low firing temperature, low dielectric loss, low material cost, and suitable for mass production.6,7 However, so far, there is no report about applying IR and Raman spectra to study structure of calcium borosilicate glasses with varying Si/Ca ratios. In the present work, the CaO–B2O3–SiO2 glass system was prepared with varying Si/Ca ratios, but the Si/B ratios were kept constant. IR spectra, Raman spectra and differential thermal analysis (DTA) data were recorded for all glasses. The borosilicate network structure, density, glass transition temperature (Tg) and thermal stability (ΔTTS) were presented with varying Si/Ca ratios. In addition, the interrelation of the glass structure and properties was discussed.

2. Experimental procedures

2.1. Preparation of glass samples

The CaO–SiO2–B2O3 glasses were prepared using analytically pure CaCO3, H3BO3 and SiO2 as the starting materials. The compositions of the various glass samples prepared in this study are presented in Fig. 1. A glass batch of homogeneous mixture was prepared by melting the materials in covered Pt90Rh10 crucible at 1400 °C for 2 h. The melting substances were quenched in deionised water to prevent the occurrence of any crystallisation. The as-quenched glasses were ground and screened through a 500-mesh stainless steel wire screen to derive glass powders with particle size < 25 μm.
image file: c6ra20969f-f1.tif
Fig. 1 The diagram of CaO–SiO2–B2O3 with ternary compositions system investigated in the molar ratio.

2.2. Sample characterization

The X-ray diffraction (XRD) were collected using PANalytical X'Pert PRO with Cu Kα radiation (λ = 1.54 Å) to check the amorphous state of the glasses and to detect any crystalline phase in samples. The 2θ angle scans were made between 10° and 80°, step width of 0.02° and a time per step of 0.5 s.

The Fourier transform infrared spectra (FTIR) of these glasses were examined using Thermo Nicolet Smart-380 FTIR spectrometer. Data were collect in wave number range of 400–2000 cm−1 at room temperature. The dry KBr powder was used to prepare sample pellet. 2 mg glass powder and 200 mg KBr powder were homogeneously mixed and then were pressed under uniaxial pressure from thin pellets. The measurements were performed with a resolution of 1 cm−1.

The Raman spectra were obtained using a Renishaw InVia Raman spectrophotometer with argon ion laser (λ = 785 nm) as the excitation light. Raman shifts are measured with a precision of ∼0.3 cm−1. The spectral resolution is of the order 1 cm−1. The spectra were recorded in the 150–2500 cm−1 range.

The densities of the CaO–SiO2–B2O3 glasses were measured using AccuPyc®II1340 (Micromeritics, USA). The measurements were repeated ten times to obtain accurate densities. The average values and errors were obtained through calculations.

The molar volume of the glasses was calculated, as follows:

 
image file: c6ra20969f-t1.tif(1)
where [M with combining macron] is the average molecular weight for the glasses component, and ρ is the glass density. Furthermore, [M with combining macron] =niMi, ni is the molar fraction of the ith component, and Mi is the molecular weight for component i.

The Tg and behaviour were determined by DTA (SDT Q600). The DTA instrument was previously calibrated using Al, with well-determined melting temperatures. DTA was performed under a flowing atmosphere of dry air. Glass powders were then heated at a rate of 10 °C min−1 up to 1000 °C with a reference material of α-alumina powders.

3. Results and discussion

The XRD patterns of these glasses were presented in Fig. 2. The diffusion peaks, which indicated amorphous state of the samples, were observed from the XRD patterns. In addition, this result demonstrates that these compositions have good glass forming ability.
image file: c6ra20969f-f2.tif
Fig. 2 The XRD pattern of the glasses.

The IR spectra of the glasses are shown in Fig. 3(a). Three prominent frequency regions were observed at approximately 400–800, 800–1300 and 1300–1640 cm−1. The centre and intensity of all peaks depended on the Si/Ca ratios. However, the IR bands overlapped the different component peaks. Therefore, Gaussian function was used to deconvolute component peaks of these bands to evaluate the influence of Si/Ca ratios on the structure of calcium borosilicate glasses. The full width at half maximum, center frequency and intensity of peaks were not restricted in processing of deconvolution. The IR spectra with the deconvoluted Gaussian bands and their summation curves (Si/Ca = 0.5, 0.9 and 1.3) are shown in Fig. 3(b–d). The Gaussian shapes are consistent with the observed IR bands, which had been assigned based on the reported data (Table 1).22–32 Additionally, the relative areas of the peak corresponding to BO3 and BO4 units were calculated according to the assignment of the IR spectra. The relative areas of BO3 were calculated as follows:

 
A(BO3) = A(1215) + A(1390) + A(1460) (2)
where A(1215), A(1390) and A(1460) are the relative areas of the peak corresponding to 1215, 1390 and 1460 cm−1, respectively.


image file: c6ra20969f-f3.tif
Fig. 3 (a) The FTIR spectra of the glasses; deconvoluted FTIR spectra of the glasses using a Gaussian-type function, (b) Si/Ca = 0.5, (c) Si/Ca = 0.9, (d) Si/Ca = 1.3.
Table 1 The assignments of different vibrational bands from FTIR spectra of these glasses
Wavenumber (cm−1) Assignments References
0.5a 0.7 0.9 1.1 1.3
a Represent Si/Ca ratios.
503 477 485 478 476 O–B–O and Si–O–Si bond bending vibrations 22 and 23
554 534 509 532 537 Si–O–Si rocking motion 24
744 722 719 709 714 Bending vibration of B–O–B linkage 25
854 866 883 878 897 Si–O–Si symmetrical vibrations and BO4 units 26
913 938 939 935 951 Vibrations of BO4 groups and non-bridging Si–O links in Q0 group 23 and 27
968 1019 Diborate groups and SiO4 tetrahedral with one oxygen ion (Q1) 27 and 28
1036 1087 1027 1033 1057 The SiO4 tetrahedral with two oxygen ions (Q2) and BO4 units 27 and 29
1101 1109 1146 Stretching vibration of Si–O–Si bonds the SiO4 tetrahedral units 27 and 28
1214 1210 1218 1216 1247 (B–O)asym bonds from orthoborate groups 30 and 31
1390 1391 1397 1400 1393 Asymmetric stretching modes of borate triangles BO3 and BO2O 30
1458 1461 1466 1477 1476 Asymmetric stretching modes of borate triangles BO3 units 31
1633 1637 1635 1634 1603 The H–O vibration of H2O 32


However, the relative areas corresponding to the SiO4 units should also be considered when the relative areas of BO4 were calculated, because the bands at the region 850–1120 cm−1 are also assigned the SiO4 units. The relative areas of BO4 were calculated as follows:

 
A(BO4) = α[A(850) + A(910) + A(967) + A(1035) + A(1100)] (3)
where α represents the molar ratio of B2O3/(2B2O3 + SiO2), which was attributed to the relative areas of BO4 units in the region 850–1120 cm−1.26 The dependences of both relative areas of the BO3 and BO4 units on Si/Ca ratios are shown in Fig. 4. The relative area of the peak corresponding to the BO3 structural units generally decreased, whereas those of BO4 structural units increased in the 0.5 ≤ Si/Ca ≤ 0.7 and 1.1 ≤ Si/Ca ≤ 1.3 ranges. On the one hand, the borosilicate glasses containing CaO may generate disproportionation reaction according to the following equation:
 
BO3 + CaO ↔ BO4 (4)


image file: c6ra20969f-f4.tif
Fig. 4 Dependence of the relative area of BO3 group and BO4 group on Si/Ca ratios. The lines are drawn as a guide for the eyes.

On the other hand, the different variation trends of the boron three-, four-coordinated showed an equilibrium reaction between BO3 and BO4 units, as follows:33

 
BO3 + 2Si–O ↔ BO4 + Si–O–Si (5)

Therefore, the increase in the relative area of the BO4 unit is caused by disproportionation reaction [eqn (4)] and equilibrium reaction [eqn (5)]. In addition, the anomaly, which is the relative areas of BO3 and BO4 units in 0.7 < Si/Ca < 1.1 range, was observed in present glasses. The analogous result, which is suggestive existence of intermediate phase in this composition range, has been presented in barium borosilicate glasses.16

The fraction (N4) of the BO4 structural units can be calculated as follows:

 
image file: c6ra20969f-t2.tif(6)

Dell et al. presented an accurate N4 model for the borosilicate glasses system.14 The Dell model shows that, in the range of K ≤ 8 and K/16 + 0.5 = RmaxR, the N4 values are defined by the following equation:

 
image file: c6ra20969f-t3.tif(7)
where R = CaO/B2O3 and K = SiO2/B2O3 (molar ratio). According to the model, the fraction of N4 increases proportionally with increasing Si/Ca ratios (Fig. 5). In addition, the experimental values of N4 (IR) were obtained by the integration of the BO4 and BO3 fitted peaks [according to eqn (6)], and N4 also increased with increasing Si/Ca ratios (Fig. 5). The results of the experimental values of N4 (IR) are in accordance with those from the Dell model. However, the experimental values of N4 (IR) were significantly smaller than those from the Dell model. The difference is attributed to the addition of the network modifier, which may also lead to NBO formation on the borate units.


image file: c6ra20969f-f5.tif
Fig. 5 The dependence of N4 values on Si/Ca ratios. The lines are drawn as a guide for the eyes.

The relative areas in the Si–O–Si bonds can be determined according to the IR spectra, as follows:

 
A(Si–O–Si) = βA(850) (8)
where β represents the molar ratio of SiO2/(2B2O3 + SiO2), which is attributed to the relative areas of Si–O–Si bonds at 850 cm−1.26 The dependence of the relative areas of the bands corresponding to the Si–O–Si bonds on the Si/Ca ratios for the glasses is displayed in Fig. 6. Overall, increasing Si/Ca ratio resulted in increasing relative areas for the bands corresponding to the Si–O–Si bonds because of the increasing SiO2 contents and the equilibrium reaction of eqn (5). Particularly, three prominent ranges were also observed in relative areas of Si–O–Si bonds (0.5 ≤ Si/Ca ≤ 0.7, 0.7 < Si/Ca < 1.1 and 1.1 ≤ Si/Ca ≤ 1.3, respectively, Fig. 6). In addition, the three prominent ranges are in line with the observed BO3 and BO4 units, which indicate the difference of reasons result in change of borosilicate glasses structure with varying Si/Ca ratios. Further, the Q1 units dramatically disappeared when the Si/Ca ≥ 0.9, as suggested by the shoulder at ∼960 cm−1. By contrast, the band at ∼1100 cm−1 may be due to stretching vibration of Si–O–Si bonds in the SiO4 tetrahedral units (Table 1). That is, the bridge oxygen bond (Si–O–Si bonds) increased as the NBO bonds (Si–O bonds in Q1 units) decreased, which is consistent with the equilibrium reaction of eqn (5). This feature is in harmony with the preliminary research of barium borosilicate glasses.16 The Ca is identical valence state with Ba, and they play the same modifier role in borosilicate glasses. Thus, the conversion of BO3 to BO4 units may have been primarily driven by disproportionation reaction between CaO and BO3 units [eqn (4)] when 0.5 ≤ Si/Ca ≤ 0.7. In addition, the BO3 units captured the NBOs of Q1 units when 1.1 ≤ Si/Ca ≤ 1.3, resulting in the formation of more BO4 and Si–O–Si bonds [eqn (5)]. The increase in the relative areas of the Si–O–Si bonds indicates the enhancement in bond strength. The strength of covalent silicate network was accompanied with high thermal stability.


image file: c6ra20969f-f6.tif
Fig. 6 Relative areas dependence of bands corresponding to Si–O–Si vibrational modes on Si/Ca ratios. The lines are drawn as a guide for the eyes.

Raman spectra have been widely used in many fields.34,35 In order to obtain the further structural information of calcium borosilicate glasses with varying Si/Ca ratios, the Raman spectra of the samples between 150 and 2500 cm−1 are depicted in Fig. 7(a). The enlarged details of Raman shift rang at 150–1000 cm−1 show that structural differences can be distinguished in the Raman spectra. The band at around 330 cm−1 assigned to bending vibration of Si–O–Si bonds, probably overlapped to the bending mode of Ca–O bonds.33 The intensities of bands at around 413 cm−1 and 868 cm−1, which are assigned to rocking motion of Si–O–Si in Q1 units and symmetric stretch of B–O–B bridges in orthoborate [BO3]3− respectively, decrease with increasing Si/Ca ratios.16,36 That feature is in harmony with the observations made from IR investigations, reflecting the Q1 and BO3 units decrease. The conversion of BO3 to BO4 units highlights the fact that non-bridge oxygen derived from Q1 units was captured BO3 units by creating BO4 units. In addition, the band at around 655 cm−1 was attributed to deformations at Si–O–B joints in danburite-type ring structures (2SiO4 and 2BO4 units),17 whereas the 936 cm−1 was due to the Si–O stretching in Q2 units.15 Further, phenomenon of blue-shifts was observed in the band at around 655 cm−1 with increasing Si/Ca ratios. In fact, there is a positive correlation between the normal vibration frequency and the force coupling constant of bonds:17

 
image file: c6ra20969f-t4.tif(9)
where f and μ represents the force coupling constant and the reduced mass of the atomic pair, respectively. The force coupling constant of B–O (BO3 and BO4 units) and Si–O bonds was, respectively, fB–O = 566 Nm−1 (BO3 units) and 407 Nm−1 (BO4 units), fSi–O = 542 Nm−1. The blue-shift of the band at 655 cm−1 can be attributed to the smaller the force coupling constant, indicating more B–O (BO4 units) bonds participate danburite-type ring structures. This result is accord with increasing of BO4 units in IR analysis.


image file: c6ra20969f-f7.tif
Fig. 7 (a) The Raman spectra of the glasses; deconvoluted Raman spectra of the glasses using a Gaussian-type function, (b) Si/Ca = 0.5, (c) Si/Ca = 0.9, (d) Si/Ca = 1.3.

The strong peaks were observed range at 1000–2200 cm−1. However, Raman spectra also overlapped the different component peaks. Deconvolution of the observed line-shapes was also implemented via the Gaussian function. An example is provided for the glasses with varying Si/Ca ratios (Si/Ca = 0.5, 0.9 and 1.3) in Fig. 7(b–d). The symmetric B–O stretch of pyroborate units, [B2O5]4−, is observed at 1228 cm−1.36 Moreover, the stretching vibrations of the non-bridged oxygen atom (O–B–O) in the [BO2O] units interconnected with [BO4] units or [BO3] units are located at around 1360 cm−1 and 1455 cm−1, respectively.37 The bands at around 1647 cm−1 and 1863 cm−1 were associated to the stretching vibrations B–O bonds with non-bridging oxygens (NBO) in metaborate chains and rings, respectively.38

The dependence of density and molar volume on Si/Ca is presented in Fig. 8. The density dramatically increased, but the molar volume significantly decreased, as Si/Ca approaches 0.9. Variations in density and molar volumes provide important information on the borosilicate glasses network. The properties of borosilicate glasses depend on the structural state, which can vary among BO3, BO4 and Qn units as functions of Si/Ca ratios.21 The changes of density and molar volumes correspond with the relative areas of the BO4 and BO3 units. The density decreased with increasing Si/Ca ratios, except when 0.7 < Si/Ca < 1.1 (Fig. 8). One reason for the decline might be density of the BO4 unit (∼6.77 g cm−3) less than the asymmetric BO3 unit (∼8.10 g cm−3).39 The density and molar volume change suddenly when 0.7 < Si/Ca < 1.1, which can correspond with the intermediate phase.16 In addition, the maximum density and minimum molar volume may be ascribed compaction of the network, and it can be expected optimization candidate for applications.


image file: c6ra20969f-f8.tif
Fig. 8 The density and molar volume of the glasses.

The effect of Si/Ca ratios on the Tg of the glasses is shown lin Fig. 9 and Table 2. Tg increased from 662 °C for Si/Ca = 0.5 to up to a maximum value 686 °C for Si/Ca = 0.9 and then declined. The Tg of the glasses followed an interesting structural dependence. The observed results indicated the glass had the highest structural cohesion with Si/Ca = 0.9. The maximum Tg generally constitutes a signature for the state in which the network possesses its highest connectivity, which is consistent with the change of structure. In addition, the thermal stability (ΔTTS) of glass can be determined using the following equation:16,17

 
ΔTTS = TcTg (10)


image file: c6ra20969f-f9.tif
Fig. 9 DTA curve for the glasses.
Table 2 Glass transition temperature (Tg), crystallization temperatures (Tc1 and Tc2), melting temperatures (Tm) and thermal stability (ΔTTS) for the glasses
Si/Ca ratios Tg (°C) Tc1 (°C) Tc2 (°C) Tm (°C) ΔTTS
0.5 662 785 803 123
0.7 664 787 839 123
0.9 686 819 852 984 133
1.1 685 833 880 998 148
1.3 682 842 890 988 160


The obtained values of ΔTTS for the glasses are given in Table 2. Preliminary analysis of these data shows that the thermal stability increased with the Si/Ca ratios as indicated by the ΔTTS parameters. Higher ΔTTS is attributed to the increased strength of the glass network. ΔTTS was enhanced by more Si–O–Si bonds of SiO4 units. The results are consistent with the IR and Raman spectra.

4. Conclusions

In this study, the structure of calcium borosilicate glass with varying Si/Ca ratios was investigated by IR and Raman spectra. Overall, the BO4 units and Si–O–Si bridging oxygen increased, but the BO3 units decreased with increasing Si/Ca ratios. Specifically, the conversion of BO3 to BO4 units was driven mainly by the disproportionation reaction between BO3 units and CaO when 0.5 ≤ Si/Ca ≤ 0.7. In addition, the BO3 units captured the NBOs of Q1 units when 1.1 ≤ Si/Ca ≤ 1.3, resulting in the formation of more BO4 and Si–O–Si bonds. The intermediate phase was presented when 0.7 < Si/Ca < 1.1. The properties of the calcium borosilicate glass also depended on the change in network structure. The intermediate phase results in maximum density, minimum molar volumes and maximum Tg, which can be expected to be the optimum candidate for applications.

Acknowledgements

This work was supported by National High-tech R&D Program of China under Grant No. 2015AA034102, National Natural Science Foundation of China under Grant No. 61171047, 51372031 and 51132003, Science and Technology Department of Sichuan Province 2014GZ0015, 2015GZ0227, State Key Laboratory of Advanced Technologies for Comprehensive Utilization of Platinum Metals No. SKL-SPM-201535.

References

  1. V. Kumar, O. P. Pandey and K. Singh, Phys. B, 2010, 405, 204–207 CrossRef CAS.
  2. M. M. Smedskjaer, J. C. Mauro, R. E. Youngman, C. L. Hogue, M. Potuzak and Y. Yue, J. Phys. Chem. B, 2011, 115, 12930–12946 CrossRef CAS PubMed.
  3. H. Zhang, C. L. Corkhill, P. G. Heath, R. J. Hand, M. C. Stennett and N. C. Hyatt, J. Nucl. Mater., 2015, 462, 321–328 CrossRef CAS.
  4. F. Angeli, T. Charpentier, D. De Ligny and C. Cailleteau, J. Am. Ceram. Soc., 2010, 93, 2693–2704 CrossRef CAS.
  5. D. Caurant, O. Majérus, E. Fadel, M. Lenoir, C. Gervais and O. Pinet, J. Am. Ceram. Soc., 2007, 90, 774–783 CrossRef CAS.
  6. C. C. Chiang, S. F. Wang, Y. R. Wang and Y. F. Hsu, J. Alloys Compd., 2008, 461, 612–616 CrossRef CAS.
  7. M. T. Sebastian and H. Jantunen, Int. Mater. Rev., 2008, 53, 57–90 CrossRef CAS.
  8. K. Singh, I. Bala and V. Kumar, Ceram. Int., 2009, 35, 3401–3406 CrossRef CAS.
  9. S. Qi, Y. Huang, Q. Lin, H. Cheng and H. Jin, Ceram. Int., 2015, 41, 12011–12019 CrossRef CAS.
  10. G. Ferlat, A. P. Seitsonen, M. Lazzeri and F. Mauri, Nat. Mater., 2012, 11, 925–929 CrossRef CAS PubMed.
  11. S. K. Lee, P. J. Eng, H. Mao, Y. Meng, M. Newville, M. Y. Hu and J. Shu, Nat. Mater., 2005, 4, 851–854 CrossRef CAS.
  12. A. K. Yadav and P. Singh, RSC Adv., 2015, 5, 67583–67609 RSC.
  13. Y. H. Yun and P. J. Bray, J. Non-Cryst. Solids, 1978, 27, 363–380 CrossRef CAS.
  14. W. J. Dell, P. J. Bray and S. Z. Xiao, J. Non-Cryst. Solids, 1983, 58, 1–16 CrossRef CAS.
  15. B. Cochain, D. R. Neuville, G. S. Henderson, C. A. McCammon, O. Pinet and P. Richet, J. Am. Ceram. Soc., 2012, 95, 962–971 CAS.
  16. C. Holbrook, S. Chakraborty, S. Ravindren, P. Boolchand, J. T. Goldstein and C. E. Stutz, J. Chem. Phys., 2014, 140, 144506 CrossRef CAS PubMed.
  17. S. Fuhrmann, T. Deschamps, B. Champagnon and L. Wondraczek, J. Chem. Phys., 2014, 140, 054501 CrossRef PubMed.
  18. D. Manara, A. Grandjean and D. R. Neuville, Am. Mineral., 2009, 94, 777–784 CrossRef CAS.
  19. E. Mansour, J. Non-Cryst. Solids, 2012, 358, 454–460 CrossRef CAS.
  20. J. Zhong, X. Ma, H. Lu, X. Wang, S. Zhang and W. Xiang, J. Alloys Compd., 2014, 607, 177–182 CrossRef CAS.
  21. O. N. Koroleva, L. A. Shabunina and V. N. Bykov, Glass Ceram., 2011, 67, 340–342 CrossRef CAS.
  22. A. Goel, J. S. McCloy, C. F. Windisch, B. J. Riley, M. J. Schweiger, C. P. Rodriguez and J. M. F. Ferreira, Int. J. Appl. Glass Sci., 2013, 4, 42–52 CrossRef CAS.
  23. R. Ciceo Lucacel, T. Radu, A. S. Tătar, I. Lupan, O. Ponta and V. Simon, J. Non-Cryst. Solids, 2014, 404, 98–103 CrossRef CAS.
  24. B. Mihailova, N. Zotov, M. Marinov, J. Nikolov and L. Konstantinov, J. Non-Cryst. Solids, 1994, 168, 265–274 CrossRef CAS.
  25. G. El-Damrawi and K. El-Egili, Phys. B, 2001, 299, 180–186 CrossRef CAS.
  26. K. El-Egili, Phys. B, 2003, 325, 340–348 CrossRef CAS.
  27. N. O. Dantas, W. E. F. Ayta, A. C. A. Silva, N. F. Cano, S. W. Silva and P. C. Morais, Spectrochim. Acta, Part A, 2011, 81, 140–143 CrossRef CAS PubMed.
  28. D. Möncke, G. Tricot, L. Wondraczek and E. I. Kamitsos, Phys. Chem. Glasses: Eur. J. Glass Sci. Technol., Part B, 2015, 56, 203–211 CrossRef.
  29. C. N. Santos, D. De Sousa Meneses, P. Echegut, D. R. Neuville, A. C. Hernandes and A. Ibanez, Appl. Phys. Lett., 2009, 94, 151901 CrossRef.
  30. H. Doweidar and Y. B. Saddeek, J. Non-Cryst. Solids, 2010, 356, 1452–1457 CrossRef CAS.
  31. A. Winterstein-Beckmann, D. Möncke, D. Palles, E. I. Kamitsos and L. Wondraczek, J. Non-Cryst. Solids, 2014, 405, 196–206 CrossRef CAS.
  32. H. Aguiar, J. Serra, P. González and B. León, J. Non-Cryst. Solids, 2009, 355, 475–480 CrossRef CAS.
  33. Y. Sun and Z. Zhang, Metall. Mater. Trans. B, 2015, 46, 1549–1554 CrossRef CAS.
  34. L. Xu, W. Yan, W. Ma, H. Kuang, X. Wu, L. Liu, Y. Zhao, L. Wang and C. Xu, Adv. Mater., 2015, 27, 1706–1711 CrossRef CAS PubMed.
  35. L. Xu, S. Zhao, W. Ma, X. Wu, S. Li, H. Kuang, L. Wang and C. Xu, Adv. Funct. Mater., 2016, 26, 1602–1608 CrossRef CAS.
  36. A. Winterstein-Beckmann, D. Möncke, D. Palles, E. I. Kamitsos and L. Wondraczek, J. Phys. Chem. B, 2015, 119, 3259–3272 CrossRef CAS PubMed.
  37. S. Park and I. Sohn, J. Am. Ceram. Soc., 2016, 99, 612–618 CrossRef CAS.
  38. E. C. Paz, J. D. M. Dias, G. H. A. Melo, T. A. Lodi, J. O. Carvalho, P. F. Façanha Filho, M. J. Barboza, F. Pedrochi and A. Steimacher, Mater. Chem. Phys., 2015, 178, 133–138 CrossRef.
  39. H. Doweidar, K. El-Igili and S. A. El-Maksoud, J. Phys. D: Appl. Phys., 2000, 33, 2532–2537 CrossRef CAS.

This journal is © The Royal Society of Chemistry 2016