Electrochemical performance of highly amorphous GeOx powders synthesized in different alcohols for use in Na- and Li-ion batteries†
T. Kajita* and
T. Itoh
Frontier Research Institute for Interdisciplinary Sciences (FRIS), Tohoku University, 6-3 Aoba, Aramaki-aza, Aoba-ku, Sendai-shi, Miyagi-ken 980-8579, Japan. E-mail: kajita@fris.tohoku.ac.jp
First published on 12th October 2016
Abstract
We synthesized highly amorphous GeOx powders by a solution synthesis method, in which NaGe was oxidized by alcohol and placed in distilled water. Further, we investigated the effect of the alcohol used during the solution synthesis method on the electrochemical Na- and Li-ion insertion/extraction performances of the powder sample. We compared the oxidation process as performed using various alcohols. The amorphous GeOx powder sample synthesized by oxidation in 2-propanol (secondary alcohol) exhibited good electrochemical performance with respect to Na- and Li-ion insertion/extraction, while the amorphous GeOx powders synthesized using methanol, ethanol, and 1-propanol (primary alcohol) showed poor performances. These powders consisted of large particles, which was the reason for their poor electrochemical performance. In particular, their cycling performance in a Na-ion cell was significantly lowered by the large particle size. Hence, during the solution synthesis process, the use of a secondary alcohol is the key to synthesizing highly amorphous GeOx powders with small particle sizes. Finally, electrolyte decomposition was also found to be one of the main causes for the deterioration of the cycling performance in a Na-ion cell, because the change in the volume of the GeOx particles during charging/discharging was smaller in the Na-ion cell than in a Li-ion cell.
Introduction
Secondary batteries are used in many applications and devices such as cellular phones, bicycles, mobile computers, and vehicles. Lithium-ion batteries are used commonly as secondary batteries, since they have a higher capacity and longer cycle life.1–3 On the other hand, lithium is a limited resource and there is not enough of it to meet future demands. Hence, Na-ion batteries are being explored as the next-generation secondary batteries, because the abundance of Na would mean a decrease in battery cost.Although graphite is commonly used as the anode material in Li-ion batteries, its practical or usable capacity has almost reached its theoretical limit. Amorphous carbon has been studied intensively as an anode material for Na-ion batteries.4–7 Materials with higher capacities are desirable for the anode of secondary batteries. Thus, alloyed anode materials with a high capacity, such as Si, Ge, Sn, and Pb, have attracted much attention.8–18 However, the large volume change experienced by the alloyed anode during the charge/discharge process degrades its cycling performance. Si oxide, Ge oxide, and Sn oxide anodes exhibit improved cycling performances in Li-ion batteries, because the oxide matrix suppresses the volume change during the charge/discharge process.19–23 In the case of Na-ion batteries, Sn oxide and Si oxide have been found to show good electrochemical performances.24,25
Recently, we successfully synthesized amorphous GeOx (x < 1) powder by the soft chemical method.26,27 In this method, zintl-phase NaGe is oxidized by 2-propanol (CH3CH(OH)CH3) at room temperature and placed in distilled water. The amorphous GeOx powder showed good electrochemical performances as an anode material for Li- and Na-ion batteries. In the current study, we evaluated the electrochemical performances of amorphous GeOx powders fabricated using different alcohols with respect to Na-and Li-ion insertion/extraction. The choice of alcohol used during the oxidation process affected the particle size of the synthesized amorphous GeOx powders as well as their electrochemical performance as a battery material. In particular, it was found that the cycling performance of Na-ion cells was adversely affected when a powder with a large particle size was used.
Experimental
Synthesis of amorphous GeOx
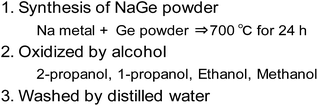
The amorphous GeOx powders were synthesized in several steps (Fig. 1). First, zintl-phase NaGe, the precursor, was synthesized through a solid-state reaction.28 Na metal (Kishida Chemical) and Ge powder (Koujyund Kagaku) were mixed stoichiometrically in a BN crucible and then sealed in a stainless steel tube in an Ar-filled glove-box. The stainless steel tube was heated to 700 °C for 24 h. The tube was subsequently opened, and the product NaGe was pulverized into a powder by grinding in an Ar-filled glove-box. Next, the NaGe powder (0.5 g) was oxidized using alcohol (200 mL) then filtered. We used methanol (CH3OH), ethanol (CH3CH2OH), 1-propanol (CH3CH2CH2OH), and 2-propanol for the oxidation. After oxidation, Ge alkoxide was formed.29 Finally, the powders were washed with distilled water, in order to hydrolyze the alkoxide, and then filtered (Fig. S1†). The amorphous GeOx powders were dried in evacuated oven at 70 °C for one night. The remaining Na was not observed in GeOx powders from ICP-MS measurement.Electrode preparation
In order to estimate the electrochemical performances of the GeOx powders, we prepared composite electrodes for coin type cells. The components used were amorphous GeOx powders as the active material, carbon powder as a conductive additive, and polyamic acid in a solid weight ratio of 80![[thin space (1/6-em)]](https://www.rsc.org/images/entities/char_2009.gif) :
:![[thin space (1/6-em)]](https://www.rsc.org/images/entities/char_2009.gif) 10
10![[thin space (1/6-em)]](https://www.rsc.org/images/entities/char_2009.gif) :
:![[thin space (1/6-em)]](https://www.rsc.org/images/entities/char_2009.gif) 10, these were mixed in 1-methyl-2-pyrrolidinone to form slurry, which was coated onto a Cu foil (15 μm) and heated at 120 °C for 5 min. The electrodes were formed by punching discs with a diameter of 10 mm from the dried coatings. Cyclohydration to a polyimide was carried out by heating the electrodes at 350 °C for 30 min in a vacuum.30 The weight of the active material in the electrodes was 1.0–1.2 mg.
10, these were mixed in 1-methyl-2-pyrrolidinone to form slurry, which was coated onto a Cu foil (15 μm) and heated at 120 °C for 5 min. The electrodes were formed by punching discs with a diameter of 10 mm from the dried coatings. Cyclohydration to a polyimide was carried out by heating the electrodes at 350 °C for 30 min in a vacuum.30 The weight of the active material in the electrodes was 1.0–1.2 mg.
Cell preparation
Coin type cells (CR2032) were assembled in an Ar-filled glove-box. Li metal or Na metal was used as the counter electrode. Polypropylene and a glass fiber filter were used as the separators in the Li-ion and Na-ion batteries, respectively. The electrolyte used was a liquid one and consisted of 1 M LiPF6 or 1 M NaPF6 dissolved in a mixture of ethylene carbonate and diethyl carbonate (3/7 by v/v).Electrochemical evaluation
Cyclic voltammograms (CV) between 0.005 and 2.5 V were performed at a scan rate of 0.1 mV s−1. The charge/discharge performances were evaluated for voltage of 0.005–1.5 V (vs. Na/Na+) and 0.01–1.5 V (vs. Li/Li+) in the case of the Na-ion and Li-ion cells, respectively. The cycling performance tests were conducted after an initial charge/discharge process, which involved two cycles at a current rate of 0.2 A g−1. In total 30 cycling tests were performed at current rates of 0.2 A g−1 and 0.5 A g−1 for the Na-ion and Li-ion cells, respectively. All the electrochemical evaluations were performed at room temperature.Analysis
The crystal structures of the powders in electrode were characterized by X-ray diffraction (XRD) analysis using Cu-Kα radiation (Ultima, Rigaku). The microstructures were observed using field-emission scanning electron microscopy (FE-SEM, Hitachi S-4300E). An X-ray photoelectron spectroscopy (XPS, Thermo Fisher Scientific, Theta Probe) system equipped with an Al Kα1,2 (1486.6 eV) source was used to investigate the chemical states of the samples. Finally, their chemical compositions were determined using inductively coupled plasma tandem mass spectrometry (ICP-MS, Agilent 8800).Result and discussion
Characterization of electrodes
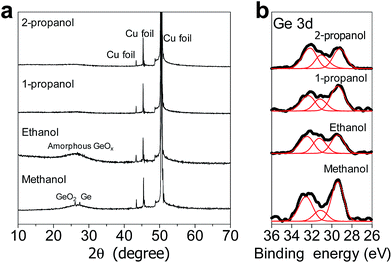
Fig. 2a shows the XRD patterns of the GeOx electrodes formed by oxidation using the different alcohols. The sharp peaks at 2θ values of 43°, 45°, and 51° are attributable to the Cu foil in the electrodes. Further, the broad peak at approximately 25° is assignable to amorphous GeO.31 This peak was significantly broadened in the case of the electrode of the powder synthesized using propanol for oxidation, meaning that it was highly amorphous. In the case of the electrode of the powder synthesized using methanol, the sharp peaks at 2θ of 26° and 28° are assignable to GeO2 and Ge, respectively. Therefore, it can be concluded the GeOx in the electrode of the powder synthesized by oxidation using methanol was partially crystallized. This tendency was also observed in powder sample (Fig. S1†) Fig. 2b shows the Ge 3d spectra of the different amorphous GeOx electrodes. These spectra indicate that Ge exhibited the following states: 32.8 eV (+4), 30.8 eV (+2), and 29.3 eV (0). The Ge and Ge4+ signals are relatively larger than the Ge2+ signal in the case of the electrode of the powder synthesized using methanol. Contribution ratio of Ge states from deconvolution of XPS spectra (Table S1†) also indicated that small amount ratio of Ge2+ in GeOx electrode was observed in methanol treatment. This difference in the signals might be due to the formation of Ge and GeO2 crystals, which were observed during the XRD measurements. During oxidation using methanol, it is likely that crystals of both Ge and GeO2 form.Fig. 3 shows SEM images of the various amorphous GeOx powders. It can be seen that their particle sizes vary dramatically, based on the choice of the alcohol used in the oxidation process. The GeOx particles ranged from the submicron scale to several microns in size in the case of the sample prepared using 2-propanol (see Fig. 3a). On the other hand, the particle size ranged from several microns to several tens of microns in the case of the powders produced using the other alcohols during the oxidation process. Thus, the particle size of the amorphous GeOx powder synthesized using 1-propanol was slightly smaller than those of the powders produced using methanol and ethanol. Table 1 shows the Ge and O ratios of the amorphous GeOx powders, as determined by ICP-MS analyses. The oxygen contents, x, were 0.70, 0.99, 0.74, and 0.65 in the case of the GeOx powders produced using methanol, ethanol, 1-propanol, and 2-propanol, respectively. The x value in GeOx was thus dependent on the alcohol used for oxidation, with all the values being lower than 1. Therefore, it can be concluded that the state of the Ge alkoxide after the oxidation process affected the x value of GeOx, the end product. However, the underlying mechanism responsible is not clear.
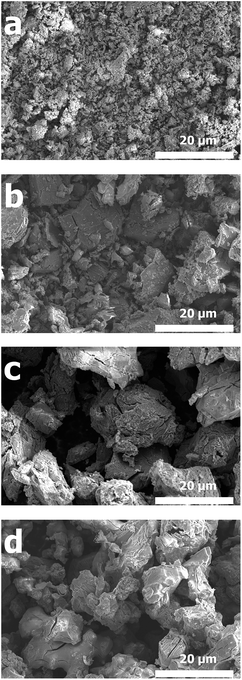 | ||
| Fig. 3 SEM images of the amorphous GeOx powders synthesized by oxidation using different alcohols: (a) 2-propanol, (b) 1-propanol, (c) ethanol and (d) methanol. | ||
| Alcohols used in oxidation process | Li-ion cell charge/discharge (mA h g−1) | Na-ion cell charge/discharge (mA h g−1) | ||
|---|---|---|---|---|
| 1st | 2nd | 1st | 2nd | |
| 2-Propanol | 1917/1268 | 1373/1239 | 648/344 | 340/319 |
| 1-Propanol | 1871/1248 | 1354/1215 | 642/320 | 344/310 |
| Ethanol | 1861/1229 | 1334/1230 | 648/322 | 333/316 |
| Methanol | 1841/1266 | 1309/1213 | 649/320 | 342/311 |
Initial electrochemical performance
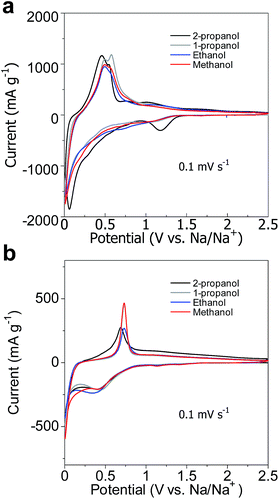
First CV curves are shown in Fig. 4. In the case of Li-ion battery, reduction peaks were observed at about 1.2 V, 0.7 V, and 0.1 V. The peak about 1.2 V is attributed to the formation of Solid–Electrolyte Interface (SEI). Although powder synthesized using 2-propanol treatment showed strong SEI peak, the other powders showed hump. Large reaction surface in small particle size increased SEI reaction. The shoulder peak at 0.7 V and sharp peak below 0.52 V are the formations of Li2O and the formations of Li–Ge alloy, respectively.32,33 These peaks of the powder in 2-propanol treatment were observed higher potential because small particle decreased over potential. In the oxidation, peaks were observed at about 0.5 V, 0.7 V and 1.0 V. The peak about 0.5 V is attributed to the reaction of lithium dealloying. Their broad peaks at 0.7 V and 1.0 V are the formation of GeOx. These peaks of small particle were also observed lower potential from lower over potential.In the case of Na-ion battery, reduction peaks were observed about 0.4 V and below 0.1 V. The broad peak about 0.4 V was attributed to the formation of SEI and the formation of Na2O. In the oxidation sweep, peaks were observed at 0.7 V and 1.1 V, which were attributed to Na dealloying and the formation of GeOx, respectively. Oxidation peaks of the powder synthesized using 2-propanol treatment were observed at lowest potential due to lower over potential.
The initial charge/discharge (sodiation/desodiation) curves of the amorphous GeOx electrodes and their charge (discharge) capacities are shown in Fig. 5 and Table 1, respectively. During the 1st cycle of the Li-ion cell, the electrodes exhibited reversible capacities of 1229–1295 mA h g−1 and an efficiency of 67%. On the other hand, the electrodes used in the Na-ion cell exhibited reversible capacities of 320–344 mA h g−1 and an efficiency of 53%. The 1st cycle irreversible capacity was attributable to electrolyte decomposition, the formation of a solid–electrolyte interface (SEI), and the formation of AM2O (AM = Li, Na). In the second cycle, higher coulombic efficiencies of 90% and 93% were observed in the Li-ion and Na-ion cells, respectively (Fig. S2†).
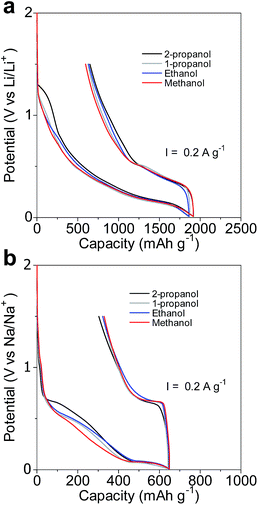 | ||
| Fig. 5 Initial charge/discharge curves of the various amorphous GeOx electrodes. (a) 1st cycle in Li-ion cells and (b) 1st cycle in Na-ion cells. | ||
The capacity of amorphous GeOx in the Li-ion cell was large because Ge could contain a greater number of Li ions than those of Na.4,7,12 The Ge in the amorphous GeOx formed NaGe in the Na-ion cell and Li3.75Ge in the Li-ion cell, as shown in eqn (1) and (2).
| GeOx + (3.75 + 2x)Li+ + (3.75 + 2x)e− ⇔ Li3.75Ge + xLi2O (discharge ⇔ charge) | (1) |
| GeOx + (1 + 2x)Na+ + (1 + 2x)e− ⇔ NaGe + xNa2O (discharge ⇔ charge) | (2) |
The charge (discharge) capacities of the amorphous GeOx electrodes were little dependent on the type of alcohol used during the oxidation process and were different from the corresponding theoretical capacities estimated on the basis of the above-mentioned equations and the oxygen contents of the powders (Table 2). It was assumed that the oxygen contents of the various GeOx powders were almost equal, regardless of the alcohol used during the oxidation process. It is likely that cyclodehydration to a polyimide during electrode fabrication caused an oxygen deficiency in amorphous GeOx, because the procedure was performed in vacuum at 350 °C. In fact, the charge capacities as determined from the electrochemical evaluations of the Na-ion cells were smaller than those calculated on the basis of the oxygen contents of the GeOx powders shown in Table 2. On the other hand, the charge capacities in the case of the Li-ion cells were larger than those calculated based on the oxygen contents; this was because of the formation of an SEI as well as owing to significant electrolyte decomposition during the 1st charging cycle.17 In the first charging, the electrochemical insertion of Li and Na ions occurred at a low potential in the case of the larger particles. This suggested that the size of the particles was related to their resistance. However, the GeOx electrode of the powder synthesized using methanol showed the lowest potential for Na-ion insertion, even though the powder particle size was slightly smaller than that of the GeOx powder synthesized using ethanol. The Ge and GeO2 crystals present in amorphous GeOx probably increase the iR drop, owing to their inactivity with respect to the electrochemical insertion of Na.
| Chemical composition of GeOx | Theoretical capacity: 1st charge/discharge (mA h g−1) | ||
|---|---|---|---|
| Alcohols used in oxidation process | x | Li-ion cell | Na-ion cell |
| 2-Propanol | 0.65 | 1630/1210 | 742/322 |
| 1-Propanol | 0.81 | 1683/1173 | 823/312 |
| Ethanol | 0.99 | 1736/1136 | 903/303 |
| Methanol | 0.70 | 1647/1199 | 767//319 |
Cycle performance
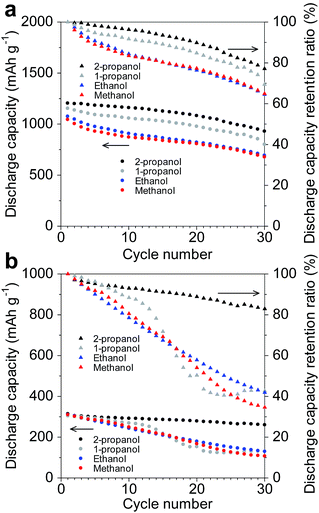
The electrode of the amorphous GeOx sample synthesized using 2-propanol showed good cycling performance in the Na- and Li-ion cells, as shown in Fig. 6. On the other hand, the electrodes of the other powders exhibited poor cycling abilities. In the Li-ion cells, after 30 cycles, the discharge capacities of the electrodes were 929.9 mA h g−1 (2-propanol), 801.2 mA h g−1 (1-propanol), 693.6 mA h g−1 (ethanol), and 678.4 mA h g−1 (methanol), while their retention ratios after 30 cycles were 77.1% (2-propanol), 69.4% (1-propanol), 64.5% (ethanol), and 64.9% (methanol). These cycle performances were not good because amount of binder in electrode was little and the weight of the active material in the electrodes was large. In Na-ion cells, their discharge capacities after 30 cycles were 260.4 mA h g−1 (2-propanol), 130 mA h g−1 (1-propanol), 130 mA h g−1 (ethanol), and 107.3 mA h g−1 (methanol), while their retention ratios after 30 cycles were 82.9% (2-propanol), 42.7% (1-propanol), 41.9% (ethanol), and 34.6% (methanol). It has been reported that large particles in electrodes result in greater deterioration of the electrochemical cycling performance, because of particle breakage and electrolyte decomposition.9,34 Therefore, in the case of the primary alcohol used for the oxidation process, the large deterioration in performance during the cycling test was related to the large particle size of the powder. The deterioration of the cycling performance was larger in the case of the Na-ion cells than in the Li-ion cells, implying that the presence of large particles in the electrodes significantly reduced their cycling performance in the Na-ion cells. However, the volume change undergone by the GeOx particles during charging/discharging is smaller in Na-ion cells than in Li-ion cells.12 Therefore, GeOx particle breakage owing to a change in volume during charging/discharging was not the main cause of the large deterioration in the performance observed in the case of the Na-ion cells with electrodes with large particles of amorphous GeOx.Fig. 7 shows the dQ/dV plots of the GeOx sample synthesized by methanol oxidation during charging for the 1st and 30th cycles in the (a) Li-ion and (b) Na-ion cells. For the Li-ion cell, the dQ/dV plot slightly decreased with an increase in the number of cycles. On the other hand, the dQ/dV peak, which was at approximately 0.1 V, shifted to a lower potential and decreased in intensity with an increase in the number of cycles in the case of the Na-ion cell. These results indicated that the increase in the cell resistance with the increase in the number of cycles was larger in the case of the Na-ion cell than in the Li-ion cell. Therefore, it can be concluded that electrolyte decomposition was the main cause of cycling performance deterioration in the Na-ion cell.
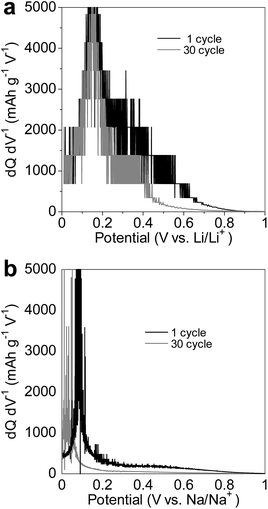 | ||
| Fig. 7 dQ/dV plots of GeOx synthesized by methanol oxidation during charging for the 1st and 30th cycles in a (a) Li-ion cell and (b) Na-ion cell. | ||
In this study, amorphous GeOx powders were synthesized by the oxidation of zintl-phase NaGe using an alcohol at room temperature and then placing the product in distilled water. When a primary alcohol (methanol, ethanol, or 1-propanol) was used for the oxidation process, amorphous GeOx particles several tens of microns in size were produced. On the other hand, GeOx particles several microns in size were produced when a secondary alcohol (2-propanol) was used for the oxidation process. In the case where a secondary alcohol was used, it is likely that it was difficult for the particles to increase in size. The reason for this might be that the alkoxide generated from 2-propanol covered the Ge phase effectively during the oxidation process. It may be possible that 2-propanol covered the Ge more three-dimensionally because –OH binds to C of the middle of three. However, further work is needed to elucidate the mechanism of the oxidation process of this solution synthesis method. It might be possible to understand the oxidation process using in situ nuclear magnetic resonance and in situ gas chromatography-mass spectrometry.
The powders with a large particle size resulted in poor cycling performance. In particular, the resistance in the Na-ion cells increased after 30 cycles, owing to electrolyte decomposition, which occurred to a greater degree after every cycle in the Na-ion cells than in the Li-ion cells. In fact, the charge/discharge efficiencies of the Na-ion cells during the cycling tests were lower than those of the Li-ion cells, as shown in Fig. 8. The efficiencies were 96–99% in the case of the Li-ion cells and 88–95% in the case of the Na-ion cells. Large variations were observed in the efficiency of the Na-ion cells during the cycling tests; this suggested that a stable SEI was not formed on the surface of the GeOx electrodes. In the case of a greater number of cycles, the decomposition of the electrolyte will become significant and hence an issue for electrodes of amorphous GeOx with small particles. Hence, the use of a high-durability electrolyte as well as the formation a highly stable SEI is necessary in the case of Na-cells with electrodes of the thus-synthesized amorphous GeOx powders.
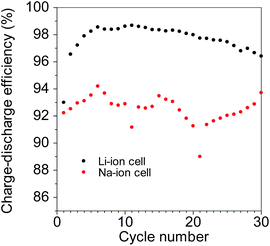 | ||
| Fig. 8 Coulombic efficiencies of the electrode of the amorphous GeOx powder synthesized by methanol oxidation during cycling tests. | ||
Conclusion
We evaluated the electrochemical alkali-ion insertion–extraction performances of amorphous GeOx powders synthesized by the solution synthesis method using four different alcohols. The amorphous GeOx powder synthesized by oxidation using 2-propanol showed good cycling performance in Na and Li-ion batteries, owing to its small particle size. On the other hand, the other amorphous GeOx powders exhibited poor cycling performances owing to their large particle size. In particular, the deterioration in performance was significant in the case of the Na-ion cells. Thus, using a secondary alcohol in this solution synthesis method may be the key to synthesizing highly amorphous GeOx powders with small particles. In addition, a high-durability electrolyte is needed and a highly stable SEI must form in the case of Na-ion cells with electrodes based on the thus-fabricated amorphous GeOx powders.Acknowledgements
This work was partially supported by The Ministry of Education, Culture, Sports, Science and Technology (MEXT) Grant-in Aid for Young Scientist (B), Grant Number JP16K18252. The authors thank S. Takahashi, Y. Oohira, and N. Akao of the Technical Division, School of Engineering, Tohoku University for carrying out ICP-MS, and XPS measurements.References
- J. M. Tarascon and M. Armand, Nature, 2001, 414, 359–367 CrossRef CAS PubMed.
- J. B. Goodenough and Y. Kim, Chem. Mater., 2010, 22, 587–603 CrossRef CAS.
- M. Armand and J. M. Tarascon, Nature, 2008, 451, 652–657 CrossRef CAS PubMed.
- N. Yabuuti, K. Kubota, M. Dahbi and M. Komaba, Chem. Rev., 2014, 114, 11636–11682 CrossRef PubMed.
- D. Larcher, S. Beattie, M. Morcrette, K. Edstrom, J. C. Jumas and J. M. Tarascon, J. Mater. Chem., 2007, 17, 3759–3772 RSC.
- M. Winter and J. O. Besenhrd, Electrochim. Acta, 1999, 45, 31–50 CrossRef CAS.
- M. N. Obrovac and V. L. Chevrier, Chem. Rev., 2014, 114, 11444–11502 CrossRef CAS PubMed.
- U. Kasavajjula, C. Wang and A. J. Appleby, J. Power Sources, 2007, 163, 1003–1039 CrossRef CAS.
- J. O. Besenhard, J. Yang and M. Winter, J. Power Sources, 1997, 68, 87–90 CrossRef CAS.
- J. Graetz, C. C. Ahn, R. Yazami and B. Fultz, J. Electrochem. Soc., 2004, 151, A698–A702 CrossRef CAS.
- M.-H. Seo, M. Park, K.-T. Lee, K. Kim, J. Kim and J. Cho, Energy Environ. Sci., 2011, 4, 425–428 CAS.
- H. Lee, M. G. Kim, C. H. Choi, Y.-K. Sun, C. H. Yoon and J. Cho, J. Phys. Chem. B, 2005, 109, 20719–20723 CrossRef CAS PubMed.
- V. L. Chevrier and G. Ceder, J. Electrochem. Soc., 2011, 158, A1011–A1014 CrossRef CAS.
- S. Komaba, Y. Matsuura, T. Ishikawa, N. Yabuuti, W. Murata and S. Kuze, Electrochem. Commun., 2012, 21, 65–68 CrossRef CAS.
- J. Qian, Y. Chen, C. Yao, L. Wu, Y. Cao, X. Ai and H. Yang, Chem. Commun., 2012, 48, 7070–7072 RSC.
- T. R. Jow, L. W. Shacklette, M. Maxfield and D. Vernick, J. Electrochem. Soc., 1987, 134, 1730–1733 CrossRef CAS.
- J. Yang, Y. Takeda, N. Imanishi, C. Capiglia, J. Y. Xie and O. Yamamoto, Solid State Ionics, 2002, 152–153, 125–129 CrossRef CAS.
- X.-L. Wang, W.-Q. Han, H. Chen, J. Bai, T. A. Tyson, X.-Q. Yu, X.-J. Wang and X.-Q. Yang, J. Am. Chem. Soc., 2011, 133, 20692–20695 CrossRef CAS PubMed.
- Y.-K. Son, M. Park, Y. Son, J.-S. Lee, J.-H. Jang, Y. Kim and J. Cho, Nano Lett., 2014, 14, 1005–1010 CrossRef CAS PubMed.
- Z. Chen, Y. Yan, S. Xin, W. Li, J. Qu, Y.-G. Guo and W.-G. Song, J. Mater. Chem. A, 2013, 1, 11404–11409 CAS.
- W. Li, Y.-X. Yin, S. Xin, W.-G. Song and Y.-G. Guo, Energy Environ. Sci., 2012, 5, 8007–8013 CAS.
- L.-S. Zhang, L.-Y. Jiang, C.-Q. Chen, W. Li, W.-G. Song and Y.-G. Guo, Chem. Mater., 2010, 22, 414–419 CrossRef CAS.
- Y. Idota, T. Kubota, A. Matsufuji, Y. Maekawa and T. Miyasaka, Science, 1997, 276, 1395–1397 CrossRef CAS.
- X. Xie, D. Su, J. Zhang, S. Chen, A. K. Mondal and G. Wang, Nanoscale, 2015, 7, 3162–3172 Search PubMed.
- M. Shimizu, H. Usui, K. Fujiwara, K. Yamane and H. Sakaguchi, J. Alloys Compd., 2015, 640, 440–443 CrossRef CAS.
- T. Kajita and T. Itoh, J. Electrochem. Soc., 2016, 163(3), A552–A556 CrossRef CAS.
- T. Kajita and T. Itoh, Electrochim. Acta, 2016, 195, 192–198 CrossRef CAS.
- X. Ma, F. Xu, T. M. Atkins, A. M. Goforth, D. Neiner, A. Navrotsky and S. M. Kauzlarich, Dalton Trans., 2009, 10250–10255 RSC.
- M. Pelosi, M. Tillard and D. Zitoum, J. Nanopart. Res., 2013, 15, 1872 CrossRef.
- T. Kajita, R. Yuge, K. Nakahara, J. Iriyama, H. Takahashi, R. Kasahara, T. Numata, S. Serizawa and K. Utsugi, J. Electrochem. Soc., 2013, 160, A1806–A1810 CrossRef CAS.
- A. Schacht, C. Sternemann, A. Hohl, H. Sternemann, Ch. J. Sahle, M. Paulus and M. Tolan, J. Non-Cryst. Solids, 2009, 355, 1285–1287 CrossRef CAS.
- D. T. Ngo, R. S. Kalubarme, H. T. T. Le, C.-N. Park and C.-J. Park, Nanoscale, 2015, 7, 2552–2560 RSC.
- J. S. Pena, I. Sandu, O. Joubert, F. S. Pascual, C. O. Arean and T. Brousse, Electrochem. Solid-State Lett., 2004, 9, A278–A281 CrossRef.
- K. E. Thomas and J. Newman, Proc. - Electrochem. Soc., 2001, 2001–2021, 327 Search PubMed.
Footnote |
| † Electronic supplementary information (ESI) available. See DOI: 10.1039/c6ra20794d |
| This journal is © The Royal Society of Chemistry 2016 |

