 Open Access Article
Creative Commons Attribution 3.0 Unported Licence
Cyanoacrylic- and (1-cyanovinyl)phosphonic acid anchoring ligands for application in copper-based dye-sensitized solar cells†
Yann Baumgartner,
Y. Maximilian Klein,
Edwin C. Constable,
Catherine E. Housecroft * and
Markus Willgert
Department of Chemistry, University of Basel, Spitalstrasse 51, CH-4056 Basel, Switzerland. E-mail: catherine.housecroft@unibas.ch
First published on 9th September 2016
Abstract
The syntheses and characterization of four new anchoring ligands (2–5) for copper(I) bis(diimine) dyes in dye-sensitized solar cells (DSCs) are reported. Ligands 2 and 3 contain a 6,6′-dimethyl-2,2′-bipyridine copper-binding unit, while 4 and 5 contain a 2,9-dimethyl-1,10-phenanthroline unit; 2 and 4 contain cyanoacrylic acid anchoring units, and 3 and 5 possess (1-cyanovinyl)phosphonic acid anchors. The performance of DSCs sensitized by [Cu(Lanchor)(Lancillary)]+ in which Lanchor is 2–5 and Lancillary is either 6,6′-dimethyl-2,2′-bipyridine (6) or 6-trifluoromethyl-2,2′-bipyridine (7) are compared with those of DSCs containing the dyes [Cu(1)(6)]+ or [Cu(1)(7)]+ where anchoring ligand 1 is the previously reported and well-performing ((6,6′-dimethyl-[2,2′-bipyridine]-4,4′-diyl)bis(4,1-phenylene))bis(phosphonic acid). Among dyes incorporating 2–5, the best performing dye contained anchor 3 (6,6′-Me2bpy/(1-cyanovinyl)phosphonic acid combination). The better performances of dyes containing the bpy-based 2 and 3 compared to the phen-based 4 and 5 are rationalized largely in terms of the greater flexibility of the bpy vs. phen unit, allowing dyes containing 2 and 3 to adopt a conformation that leads to better surface coverage on mesoporous TiO2. Replacing 1 by 3 leads to a small gain in the short-circuit current density (JSC), but dyes with anchor 1 (in place of 3) have enhanced open-circuit voltage (VOC). The results of electrochemical impedance spectroscopy (EIS) support the trends found from the J–V measurements. The EIS data for DSCs with dyes containing anchors 3 or 1 are compared; the latter has a higher recombination resistance and chemical capacitance although the former exhibits a lower transport resistance.
Introduction
Solar-to-electrical energy conversion by Grätzel dye-sensitized solar cells (DSCs) conventionally uses ruthenium(II) photosensitizers with carboxylic acid or carboxylate groups for attachment to a mesoporous n-type semiconductor (usually TiO2).1,2 State-of-the art ruthenium-based, organic and zinc(II) porphyrin-based dyes typically use carboxylic acid and cyanoacrylic acid anchors, although the palette of anchoring groups has increased significantly in recent years.3–7 The combined electron-withdrawing properties of the cyano and carboxylic acid groups in cyanoacrylic acid-anchored dyes are an integral part of the classical ‘push–pull’ dye design.We have initiated a systematic assessment of copper-based sensitizers in DSCs, and have exploited the use of heteroleptic dyes containing a [Cu(N^N)(N^N′)]+ core (N^N and N^N′ = 2,2′-bipyridine or 1,10-phenanthroline-based ligands) to enable optimal combinations of anchoring and ancillary domains. We have focused on a ‘surfaces-as-ligands’ approach to assemble dyes in a stepwise manner on the semiconductor surface,8,9 in contrast to the HETPHEN strategy favoured by Odobel and coworkers.10 While the photoconversion efficiencies, η, of copper-based DSCs are currently lower than those of devices with state-of-the art ruthenium(II), organic and zinc porphyrin-based sensitizers, their potential is clear with values of η > 3% with respect to η ∼ 7.5% for the reference ruthenium dye N719.11,12
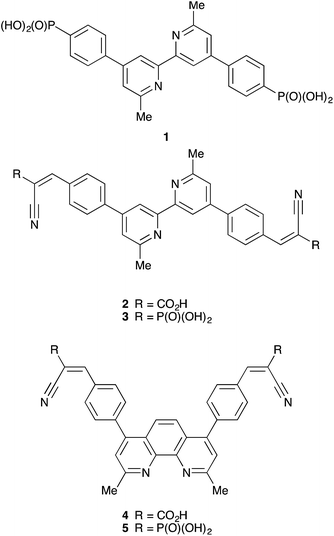
For heteroleptic copper(I) sensitizers, we have demonstrated replacing carboxylic acid anchors with phosphonic acids gives improved DSC performances.13 Spacers between the metal-binding and anchoring domains in the anchoring ligand are also relevant, and can enhance photoconversion efficiency of the dye.14 We have demonstrated that both phenyl and thiophene spacers are effective; for the latter, improved electron injection is achieved by placing the phosphonic acid group in the 4-rather than the 5-position of the thienyl ring.15 The benefits of the thienyl spacer are also supported by Wills et al.16 Anchoring ligand 1 (Scheme 1) has featured in most of our recent studies of copper(I)-based DSCs. Here, we report the effects on the photoconversion efficiencies of DSCs containing [Cu(Lanchor)(Lancillary)]+ dyes of replacing the P(O)(OH)2 anchors in 1 by cyanoacrylic acid or (1-cyanovinyl)phosphonic acid groups (ligands 2 and 3, Scheme 1). We also look at the effects of replacing the 2,2′-bipyridine (bpy) core by a 1,10-phenanthroline (phen) domain (ligands 4 and 5, Scheme 1). Each of the anchoring ligands investigated contains methyl groups in the 6,6′-positions of the bpy unit or the 2,9-positions of the phen unit. Substituents in these positions stabilize copper(I) with respect to oxidation to copper(II) by sterically hindering flattening of the tetrahedral coordination sphere to the square planar geometry preferred by copper(II).17
Experimental
General
A Biotage Initiator 8 microwave reactor was used for reactions carried out under microwave conditions. 1H, 13C and 31P NMR spectra were recorded on a Bruker Avance III-500 or 400 MHz NMR spectrometer; 1H and 13C chemical shifts were referenced to residual solvent peaks with respect to δ(TMS) = 0 ppm, and 31P with respect to δ(85% aqueous H3PO4) = 0 ppm. Solution and solid state absorption spectra were recorded on an Agilent Cary 5000 UV-Vis-NIR spectrophotometer. FT-IR spectra were recorded using a Perkin Elmer Spectrum Two with UATR for solid samples. MALDI-TOF and electrospray ionization (ESI) mass spectra were recorded on Bruker esquire 3000 plus and Bruker Daltonics Inc. microflex instruments, respectively, and high resolution (HR) ESI-MS on a Bruker maXis 4G instrument.Compound 1,18 4,4′-dibromo-6,6′-dimethyl-2,2′-bipyridine,19 4,7-dichloro-2,9-dimethyl-1,10-phenanthroline20 and [Cu(Me2bpy)2][PF6]21 were prepared as previously described. 6,6′-Dimethyl-2,2′-bipyridine (Me2bpy), (4-formylphenyl)boronic acid and diethyl cyanomethylphosphonate were purchased from Sigma Aldrich, Acros and Alfa Aesar.
4,4′-(6,6′-Dimethyl-[2,2′-bipyridine]-4,4′-diyl)dibenzaldehyde
The method is adapted from that reported.22 Cs2CO3 (1.14 g, 3.51 mmol) was dissolved in water (2 mL) and the solution was degassed with N2 for 10 min. 4,4′-Dibromo-6,6′-dimethyl-2,2′-bipyridine (200 mg, 0.585 mmol), (4-formylphenyl)boronic acid (263 mg, 1.75 mmol) and a catalytic amount of [Pd(PPh3)4] (33.8 mg, 0.090 mmol) were dissolved in THF (15 mL) in a microwave vial and the solution was degassed with N2 for 10 min. The aqueous solution of Cs2CO3 was then added to the reaction mixture which was then heated at 90 °C for 4 h in a microwave reactor. The reaction mixture was allowed to cool to room temperature and then water (25 mL) was added. The reaction mixture was extracted with CH2Cl2 (3 × 25 mL) and the combined organic layers were dried over MgSO4. The solvent was removed under reduced pressure and the crude product was recrystallized (EtOH/CHCl3). The product was obtained as a white solid (170 mg, 0.433 mmol, 74.0%). The previous literature report of this compound gave only 1H NMR spectroscopic data for a DMSO-d6 solution.22 Mp 232.2 °C. 1H NMR (500 MHz, CDCl3) δ/ppm: 10.11 (s, 2H, HCHO), 8.55 (d, J = 1.3 Hz, 2H, HA5), 8.03 (m, 4H, HB3), 7.92 (m, 4H, HB2), 7.44 (d, J = 1.3 Hz, 2H, HA3), 2.74 (s, 6H, HMe). 13C{1H} NMR (126 MHz, CDCl3) δ/ppm: 191.9 (CCHO), 159.0 (CA6), 156.6 (CA2), 148.3 (CB1), 144.9 (CA4), 136.5 (CB4), 130.5 (CB3), 128.1 (CB2), 121.6 (CA5), 116.9 (CA3), 24.9 (CMe). ESI-MS positive mode: m/z 415.04 [M + Na]+ (calc. 415.14).Compound 2
Piperidine (32.7 μL, 0.331 mmol), cyanoacetic acid (84.5 mg, 0.993 mmol) and 4,4′-(6,6′-dimethyl-[2,2′-bipyridine]-4,4′-diyl)dibenzaldehyde (130 mg, 0.331 mmol) were dissolved in CHCl3 (20 mL) and the reaction mixture was heated at reflux for ∼15 h. The reaction mixture was allowed to cool to room temperature and was filtered. The product was washed with CH2Cl2 (2 × 10 mL) to obtain 2 as a white solid (147 mg, 0.331 mmol, 84.3%). Mp: 234.4 °C. 1H NMR (500 MHz, DMSO-d6) δ/ppm: 8.68 (br, 2H, HOH), 8.54 (s, 2H, HA3), 8.31 (s, 2H, Ha), 8.17 (m, 4H, HB3), 8.04 (m, 4H, HB2), 7.75 (s, 2H, HA5), 2.68 (s, 6H, HMe). 13C{1H} NMR (126 MHz, DMSO-d6) δ/ppm: 163.1 (CCOOH), 158.7 (CA6), 155.5 (CA2), 151.3 (Ca), 147.2 (CA4), 141.0 (CB1), 132.7 (CB4), 131.1 (CB3), 127.6 (CB2), 121.2 (CA5), 117.3 (CCN), 115.4 (CA3), 79.2 (Cb), 24.4 (CMe). IR (solid,![[small nu, Greek, tilde]](https://www.rsc.org/images/entities/i_char_e0e1.gif) /cm−1): ∼3000 (v br), 2218 (w), 1710 (m), 1595 (s), 1543 (m), 1382 (m), 1340 (m), 1275 (m), 1215 (m), 1191 (s), 830 (vs.), 754 (s), 717 (vs.). ESI-MS positive mode: m/z 527.07 [M + H]+ (calc. 527.17). HR ESI-MS: m/z 527.1713 [M + H]+ (calc. 527.1714). Satisfactory elemental analysis could not be obtained.
/cm−1): ∼3000 (v br), 2218 (w), 1710 (m), 1595 (s), 1543 (m), 1382 (m), 1340 (m), 1275 (m), 1215 (m), 1191 (s), 830 (vs.), 754 (s), 717 (vs.). ESI-MS positive mode: m/z 527.07 [M + H]+ (calc. 527.17). HR ESI-MS: m/z 527.1713 [M + H]+ (calc. 527.1714). Satisfactory elemental analysis could not be obtained.
Ester 3a
Piperidine (7.91 μL, 0.080 mmol), diethyl cyanomethylphosphonate (38.6 μL, 0.240 mmol) and 4,4′-(6,6′-dimethyl-[2,2′-bipyridine]-4,4′-diyl)dibenzaldehyde (31.4 mg, 0.080 mmol) were dissolved in CHCl3 (20 mL) and the reaction mixture was heated at reflux for ∼15 h. The reaction mixture was allowed to cool to room temperature and CH2Cl2 (30 mL) was added. The organic layer was washed with water (3 × 25 mL) and brine (3 × 25 mL), dried over MgSO4 and the solvent was removed under reduced pressure. The crude product was purified by column chromatography (3![[thin space (1/6-em)]](https://www.rsc.org/images/entities/char_2009.gif) :
:![[thin space (1/6-em)]](https://www.rsc.org/images/entities/char_2009.gif) 2 cyclohexane/acetone) and the solvent from the fraction collected was removed under reduced pressure. Ester 3a was isolated as a white solid (44.6 mg, 0.0628 mmol, 78.4%). 1H NMR (500 MHz, CDCl3) δ/ppm: 8.55 (d, J = 1.2 Hz, 2H, HA3), 8.11 (m, 4H, HB3), 8.07 (d, JPH ∼21 Hz, 2H, Ha), 7.90 (m, 4H, HB2), 7.44 (d, J = 1.3 Hz, 2H, HA5), 4.27 (m, 8H, HEt), 2.74 (s, 6H, HMe-bpy), 1.44 (m, 12H, HEt). 13C{1H} NMR (126 MHz, CDCl3) δ/ppm: 159.0 (CA6), 158.0 (d, JPC = 6.7 Hz, Ca),156.6 (CA2), 147.9 (CA4), 143.3 (CB1), 132.9 (CB4), 131.4 (CB3), 128.2 (CB2), 121.4 (CA5), 116.8 (CA3), 115.6 (CCN), 63.9 (d, JPC = 5.8 Hz, CEt), 24.4 (CMe-bpy), 16.4 (d, JPC = 6.4 Hz, CEt), signal for Cb was not resolved. 31P{1H} NMR (202 MHz, CDCl3) δ/ppm: +10.9. ESI-MS: m/z 711.12 [M + H]+ (calc. 711.25). HR ESI-MS positive mode: m/z 711.2497 [M + H]+ (calc. 711.2496). Satisfactory elemental analysis could not be obtained.
2 cyclohexane/acetone) and the solvent from the fraction collected was removed under reduced pressure. Ester 3a was isolated as a white solid (44.6 mg, 0.0628 mmol, 78.4%). 1H NMR (500 MHz, CDCl3) δ/ppm: 8.55 (d, J = 1.2 Hz, 2H, HA3), 8.11 (m, 4H, HB3), 8.07 (d, JPH ∼21 Hz, 2H, Ha), 7.90 (m, 4H, HB2), 7.44 (d, J = 1.3 Hz, 2H, HA5), 4.27 (m, 8H, HEt), 2.74 (s, 6H, HMe-bpy), 1.44 (m, 12H, HEt). 13C{1H} NMR (126 MHz, CDCl3) δ/ppm: 159.0 (CA6), 158.0 (d, JPC = 6.7 Hz, Ca),156.6 (CA2), 147.9 (CA4), 143.3 (CB1), 132.9 (CB4), 131.4 (CB3), 128.2 (CB2), 121.4 (CA5), 116.8 (CA3), 115.6 (CCN), 63.9 (d, JPC = 5.8 Hz, CEt), 24.4 (CMe-bpy), 16.4 (d, JPC = 6.4 Hz, CEt), signal for Cb was not resolved. 31P{1H} NMR (202 MHz, CDCl3) δ/ppm: +10.9. ESI-MS: m/z 711.12 [M + H]+ (calc. 711.25). HR ESI-MS positive mode: m/z 711.2497 [M + H]+ (calc. 711.2496). Satisfactory elemental analysis could not be obtained.
Compound 3
Me3SiBr (0.639 mL, 4.84 mmol) and 3a (44.6 mg, 0.0628 mmol) were dissolved in CH2Cl2 (20 mL). The reaction mixture was stirred for 2.5 days at room temperature. Water (20 mL) was added to the reaction mixture and a precipitate formed. The product was filtered, and washed with water (10 mL), EtOH (2 × 10 mL) and CH2Cl2 (2 × 10 mL). Compound 3 was isolated as a pale yellow solid (13.3 mg, 0.022 mmol, 35.0%).1H NMR (500 MHz, DMSO-d6) δ/ppm: 8.81 (d, J = 1.8 Hz, 2H HA3), 8.22 (m, 4H, HB2), 8.17 (m, 4H, HB3), 8.15 (s, 2H, HA5), 7.99 (d, J = 19.7 Hz, 2H, Ha), 2.82 (s, 6H, HMe). 13C{1H} NMR (126 MHz, DMSO-d6) δ/ppm: 157.88 (CA6), 152.9 (d, J = 6.1 Hz Ca), 149.8 (CA4), 138.7 (CB1), 134.6 (CB4), 130.3 (CB3), 128.3 (CB2), 123.6 (CA5), 118.4 (CA3), 116.7 (CCN), 107.6 (d, JPC = 182.9 Hz, Cb), 22.6 (CMe); signal for HA3 was not resolved. 31P{1H} NMR (202 MHz, DMSO-d6) δ/ppm: +4.55. IR (solid,![[small nu, Greek, tilde]](https://www.rsc.org/images/entities/i_char_e0e1.gif) /cm−1): ∼3000 (br), 2209 (w), 1623 (sh), 1597 (s), 1394 (m), 1163 (sh), 1050 (s), 920 (s), 828 (vs.), 616 (s) 564 (vs.). MALDI-MS: m/z 599.07 [M + H]+ (calc. 559.12). ESI-MS negative mode: (3 in aqu. NH3) m/z 297.88 [M − 2H]2− (calc. 298.05). HR ESI-MS: m/z 298.0515 [M − 2H]2− (calc. 298.0513). Satisfactory elemental analysis could not be obtained.
/cm−1): ∼3000 (br), 2209 (w), 1623 (sh), 1597 (s), 1394 (m), 1163 (sh), 1050 (s), 920 (s), 828 (vs.), 616 (s) 564 (vs.). MALDI-MS: m/z 599.07 [M + H]+ (calc. 559.12). ESI-MS negative mode: (3 in aqu. NH3) m/z 297.88 [M − 2H]2− (calc. 298.05). HR ESI-MS: m/z 298.0515 [M − 2H]2− (calc. 298.0513). Satisfactory elemental analysis could not be obtained.
4,4′-(2,9-Dimethyl-1,10-phenanthroline-4,7-diyl)dibenzaldehyde
Cs2CO3 (3.52 g, 10.8 mmol) was dissolved in water (2 mL) and the solution degassed with N2 for 10 min. 4,7-Dichloro-2,9-dimethyl-1,10-phenanthroline (500 mg, 1.80 mmol), (4-formylphenyl)boronic acid (810 mg, 5.40 mmol) and a catalytic amount of [Pd(PPh3)4] (104 mg, 0.090 mmol) were dissolved in THF (15 mL) in a microwave vial and the solution was degassed with N2 for 10 min. The aqueous solution was then added to the THF solution and the reaction was heated at 90 °C for 4 h in a microwave reactor. After the mixture had cooled to ambient temperature, water (25 mL) was added. The mixture was extracted with CH2Cl2 (3 × 25 mL) and the combined organic layers were dried over MgSO4. Solvent was then removed under reduced pressure and the crude product was recrystallized from EtOH/CHCl3. 4,4′-(2,9-Dimethyl-1,10-phenanthroline-4,7-diyl)dibenzaldehyde was isolated as a pale yellow solid (90.1 mg, 0.216 mmol, 12.0%). Decomp > 300 °C. 1H NMR (500 MHz, CDCl3) δ/ppm: 10.13 (s, 2H, HCHO), 8.04 (d, 4H, J = 8.3 Hz, HB3), 7.70 (d, 4H, J = 8.3, HB2), 7.68 (s, 2H, HA5), 7.48 (s, 2H, HA3), 3.01 (s, 6H, HMe). 13C{1H} NMR (126 MHz, CDCl3, δ/ppm): 191.8 (CCHO), 159.3 (CA2), 147.3 (CA4), 146.1 (CA10a), 144.4 (CB1), 136.2 (CB4), 130.5 (CB2), 136.0 (CB3), 124.4 (CA4a), 124.0 (CA3), 123.0 (CA5), 26.1 (CMe). ESI-MS positive mode: m/z 417.06 [M + H]+ (calc. 417.16), 439.04 [M + Na]+ (calc. 439.04).Compound 4
Piperidine (14.3 μL, 0.145 mmol), cyanoacetic acid (37.0 mg, 0.435 mmol) and 4,4′-(2,9-dimethyl-1,10-phenanthroline-4,7-diyl)dibenzaldehyde (60.3 mg, 0.145 mmol) were dissolved in CHCl3 (20 mL) and the reaction mixture was heated at reflux for ∼15 h. The reaction mixture was allowed to cool down to room temperature, then was filtered and the solid product was washed with CH2Cl2 (2 × 10 mL). Compound 4 was isolated as a pale yellow solid (55.7 mg, 0.101 mmol, 69.8%). Decomp > 300 °C. 1H NMR (500 MHz, DMSO-d6) δ/ppm: 8.44 (s, 2H Ha), 8.23 (d, J = 8.4 Hz, 4H, HB3), 7.80 (d, J = 8.4 Hz, 4H, HB2), 7.75 (s, 2H, HA3), 7.67 (s, 2H, HA5), 2.87 (s, 6H, HMe). 13C{1H} NMR (126 MHz, DMSO-d6) δ/ppm: 163.0 (CCOOH), 158.1 (CA2), 153.0 (Ca), 146.3 (CA4), 145.4 (CA10a), 141.7 (CB1), 131.7 (CB4), 130.7 (CB3), 130.3 (CB2), 123.7 (CA5), 122.6 (CA3), 116.8 (CCN), 24.8 (CMe); signals for Cb, C4a were not resolved. IR (![[small nu, Greek, tilde]](https://www.rsc.org/images/entities/i_char_e0e1.gif) /cm−1): ∼3000 (br), 2218 (w), 1703 (m), 1598 (vs.), 1554 (m), 1328 (m), 1259 (m), 1190 (s), 838 (vs.), 711 (vs.). MALDI-MS: m/z 551.34 [M + H]+ (calc. 551.17). ESI-MS positive mode: m/z 551.08 [M + H]+ (calc. 551.17). High resolution ESI-MS: m/z 551.1712 [M + H]+ (calc. 551.1714). Satisfactory elemental analysis could not be obtained.
/cm−1): ∼3000 (br), 2218 (w), 1703 (m), 1598 (vs.), 1554 (m), 1328 (m), 1259 (m), 1190 (s), 838 (vs.), 711 (vs.). MALDI-MS: m/z 551.34 [M + H]+ (calc. 551.17). ESI-MS positive mode: m/z 551.08 [M + H]+ (calc. 551.17). High resolution ESI-MS: m/z 551.1712 [M + H]+ (calc. 551.1714). Satisfactory elemental analysis could not be obtained.
Ester 5a
Piperidine (16.8 μL, 0.170 mmol), diethyl cyanomethylphosphonate (82.1 μL, 0.510 mmol) and (dimethyl-1,10-phenanthroline-4,7-diyl)dibenzaldehyde (70.7 mg, 0.170 mmol) were dissolved in CHCl3 (20 mL) and the reaction mixture was heated at reflux for ∼15 h. After cooling the mixture to room temperature, CH2Cl2 (30 mL) was added and the organic layer was washed with water (3 × 25 mL) followed by brine (3 × 25 mL), dried over MgSO4 and the solvent was removed under reduced pressure. The crude product was purified by column chromatography (3![[thin space (1/6-em)]](https://www.rsc.org/images/entities/char_2009.gif) :
:![[thin space (1/6-em)]](https://www.rsc.org/images/entities/char_2009.gif) 2 cyclohexane/acetone) and the solvent from the fractions collected was removed under reduced pressure. Ester 5a was isolated as a pale yellow solid (61.4 mg, 0.0836 mmol, 49.2%). 1H NMR (500 MHz, CDCl3, δ/ppm) 8.11 (m, 6H, HB3+a), 7.71 (s, 2H, HA5), 7.67 (d, 4H, J = 8.2 Hz, HB2), 7.47 (s, 2H, HA3), 4.27 (m, 8H, HEt), 3.02 (s, 6H, HMe-phen), 1.44 (t, 12H, 7.2 Hz, HEt). 13C{1H} NMR (126 MHz, CDCl3) δ/ppm: 159.2 (CA2), 157.8 (Ca), 146.9 (CA4), 146.1 (CA10a), 142.8 (CB1), 132.5 (CB4), 130.6 (CB3), 130.5 (CB2), 124.2 (CA4a), 123.9 (CA3), 122.9 (CA5), 115.3 (CCN), 101.2 (d, JPC = 258 Hz, Cb), 63.9 (d, JPC = 5.8 Hz, CEt), 26.0 (CMe-bpy), 16.5 (d, JPC = 6.3 Hz, CEt). 31P{1H} NMR (202 MHz, CDCl3) δ/ppm: +10.7. ESI-MS positive mode: m/z 735.1 [M + H]+ (calc. 735.25). HR ESI-MS: m/z 735.2500 [M + H]+ (calc. 735.2496). Satisfactory elemental analysis could not be obtained.
2 cyclohexane/acetone) and the solvent from the fractions collected was removed under reduced pressure. Ester 5a was isolated as a pale yellow solid (61.4 mg, 0.0836 mmol, 49.2%). 1H NMR (500 MHz, CDCl3, δ/ppm) 8.11 (m, 6H, HB3+a), 7.71 (s, 2H, HA5), 7.67 (d, 4H, J = 8.2 Hz, HB2), 7.47 (s, 2H, HA3), 4.27 (m, 8H, HEt), 3.02 (s, 6H, HMe-phen), 1.44 (t, 12H, 7.2 Hz, HEt). 13C{1H} NMR (126 MHz, CDCl3) δ/ppm: 159.2 (CA2), 157.8 (Ca), 146.9 (CA4), 146.1 (CA10a), 142.8 (CB1), 132.5 (CB4), 130.6 (CB3), 130.5 (CB2), 124.2 (CA4a), 123.9 (CA3), 122.9 (CA5), 115.3 (CCN), 101.2 (d, JPC = 258 Hz, Cb), 63.9 (d, JPC = 5.8 Hz, CEt), 26.0 (CMe-bpy), 16.5 (d, JPC = 6.3 Hz, CEt). 31P{1H} NMR (202 MHz, CDCl3) δ/ppm: +10.7. ESI-MS positive mode: m/z 735.1 [M + H]+ (calc. 735.25). HR ESI-MS: m/z 735.2500 [M + H]+ (calc. 735.2496). Satisfactory elemental analysis could not be obtained.
Compound 5
Me3SiBr (0.718 mL, 5.44 mmol) and 5a (61.4 mg, 0.0836 mmol) were dissolved in CH2Cl2 (20 mL) and the reaction mixture was stirred for 3 days at room temperature. Water (20 mL) was added to the reaction mixture and the precipitate that formed was collected by filtration, and was washed with water (10 mL), EtOH (2 × 10 mL) and CH2Cl2 (2 × 10 mL). 5 was isolated as a pale yellow solid (26.3 mg, 0.0422 mmol, 50.5%). Only a broadened 1H NMR spectrum could be recorded (see text discussion). MALDI-MS: m/z 622.92 [M + H+] (calc. 623.12). ESI-MS negative mode: (5 in aqu. NH3): m/z 309.95 [M − 2H]2− (calc. 310.05). HR ESI-MS: m/z 310.0514 [M − 2H]2− (calc. 310.0513). IR (![[small nu, Greek, tilde]](https://www.rsc.org/images/entities/i_char_e0e1.gif) /cm−1): ∼3000 (br), 2206 (w), 1616 (s), 1597 (s), 1557 (m), 1402 (w), 1158 (sh), 1062 (vs.), 920 (s), 838 (vs.), 622 (s) 566 (vs.). Satisfactory elemental analysis could not be obtained.
/cm−1): ∼3000 (br), 2206 (w), 1616 (s), 1597 (s), 1557 (m), 1402 (w), 1158 (sh), 1062 (vs.), 920 (s), 838 (vs.), 622 (s) 566 (vs.). Satisfactory elemental analysis could not be obtained.
Electrodes for solid-state absorption spectroscopy
Dye-functionalized electrodes were assembled as detailed below but using Solaronix Test Cell Titania Electrodes Transparent.DSC fabrication and measurements
Working electrodes (Solaronix Test Cell Titania Electrodes) were washed with milliQ water and EtOH and sintered at 450 °C for 30 min, then cooled to ≈80 °C and immersed in a DMSO solution of 1, 2, 3, 4 or 5 (1.0 mM) for 24 h at room temperature. The functionalized electrodes were removed from the solutions, washed with DMSO and EtOH and dried using a heat gun (100 °C). Each electrode was then immersed for 3 days in an acetone solution of [Cu(6)2][PF6] or [Cu(7)2][PF6] (0.1 mM); during this period, the TiO2 area on each electrode turned red-orange. After removal from the dye-bath, electrodes were washed with acetone and dried with a heat gun (80 °C). An N719 reference electrode was made by dipping a Solaronix Test Cell Titania Electrode in a EtOH solution (0.3 mM) of N719 (Solaronix) for 3 days. After taking it out of the dye-bath, the electrode was washed with EtOH and dried with a heat gun (80 °C). Solaronix Test Cell Platinum Electrodes were used for the counter electrodes, and volatile organic impurities were removed by placing the electrodes on a heating plate (450 °C, 30 min).The working and counter electrodes were joined using thermoplast hot-melt sealing foil (Solaronix Test Cell Gaskets) by heating while pressing them together. The electrolyte comprised LiI (0.1 M), I2 (0.05 M), 1-methylbenzimidazole (0.5 M), 1-butyl-3-methylimidazolinium iodide (0.6 M) in 3-methoxypropionitrile. The electrolyte was introduced into the DSC by vacuum backfilling and then the hole in the counter electrode was sealed (Solaronix Test Cell Sealings) and covered (Solaronix Test Cell Caps).
Measurements were made by irradiating from behind using a light source LOT Quantum Design LS0811 (100 mW cm−2 = 1 sun). The power of the simulated light was calibrated using a reference Si cell. All DSCs were completely masked23,24 before measurements were made.
The external quantum efficiency (EQE) measurements were made using a Spe-Quest quantum efficiency setup (Rera Systems, Netherlands) operating with a 100 W halogen lamp (QTH) and a lambda 300 grating monochromator (Lot Oriel). The monochromatic light was modulated to 3 Hz using a chopper wheel (ThorLabs), and the cell response was amplified with a large dynamic range IV converter (CVI Melles Griot) and then measured with a SR830 DSP Lock-In amplifier (Stanford Research).
Electrochemical impedance spectroscopy (EIS) measurements were carried out on a ModuLab® XM PhotoEchem photoelectrochemical measurement system from Solartron Analytical. The impedance was measured around the open-circuit potential of the cell at different light intensities (590 nm) in the frequency range 0.05 Hz to 100 kHz using an amplitude of 10 mV. The impedance data were analysed using ZView® software from Scribner Associates Inc.
Results and discussion
Anchoring ligand syntheses
The procedures for the preparation of ligands 2 and 3 are summarized in Scheme 2. Ligand 2 has previously been reported, and we adapted the method described by Yuan et al.,22 using (4-formylphenyl)boronic acid in place of the analogous pinacolate ester in the first step. The 4,7-functionalized phen compounds 4 and 5 were prepared in an analogous manner to the routes shown for 2 and 3, but replacing 4,4′-dibromo-6,6′-dimethyl-2,2′-bipyridine by 4,7-dichloro-2,9-dimethyl-1,10-phenanthroline.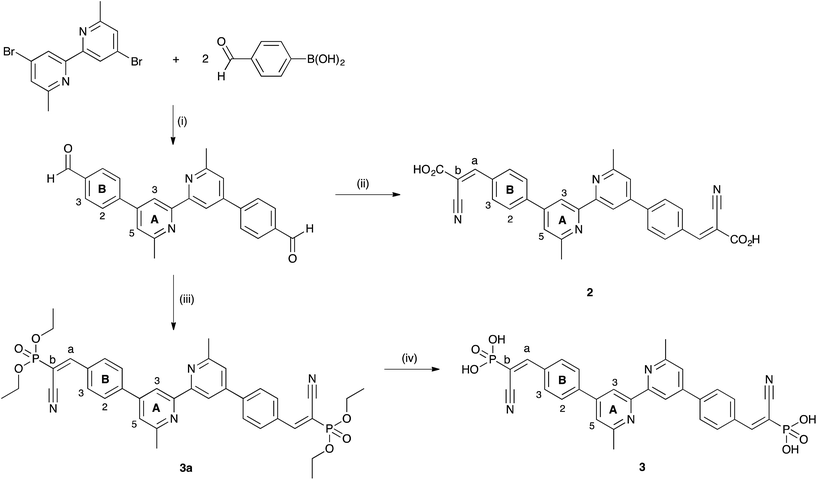 | ||
| Scheme 2 Synthetic route to compounds 2 and 3. Conditions: (i) Pd(PPh3)4 (0.05 mol%), Cs2CO3, THF/H2O, microwave reactor, 90 °C, 4 h; (ii) cyanoacetic acid, piperidine, CHCl3, 70 °C, 16 h; (iii) diethyl cyanomethylphosphonate, piperidine, CHCl3, 70 °C, 16 h; (iv) Me3SiBr, CH2Cl2, room temperature, 56 h. Atom labelling is used for the NMR assignments of 2 and 3; synthetic routes to 4 and 5 are analogous to those for 2 and 3, and atom labelling for 4 and 5 is given in Scheme S1.† | ||
The intermediates 4,4′-(6,6′-dimethyl-[2,2′-bipyridine]-4,4′-diyl)dibenzaldehyde and 4,4′-(2,9-dimethyl-1,10-phenanthroline-4,7-diyl)dibenzaldehyde were characterized by 1H and 13C NMR spectroscopies and mass spectrometry (see Experimental section). Treatment of these aldehydes with cyanoacetic acid in the presence of piperidine (Scheme 2) yielded the cyanoacrylic acids 2 and 4 (Scheme 1) in 84.3 and 69.8% yield, respectively, after workup. The base peak in the electrospray (ESI) mass spectrum of 2 was observed at m/z 527.07 corresponding to [M + H]+. For 4, the [M + H]+ peak appeared at m/z 551.34 in the MALDI-TOF mass spectrum, but was not observed using ESI MS. The IR spectra of 2 and 4 are shown in Fig. S1.† The C![[triple bond, length as m-dash]](https://www.rsc.org/images/entities/char_e002.gif) N group gives rise to a band at 2218 cm−1 both in 2 and 4; strong absorptions at 1595 cm−1 in 2 and 1598 cm−1 in 4 are characteristic of the carboxylic acid group. COSY, HMQC, HMBC and NOESY methods were used to assign the 1H and 13C NMR spectra of 2 and 4. Assignments of HB2 and HB3, and of HA3 and HA5 in 2 (see Scheme 2 for atom labels) were made on the basis of NOESY cross-peaks between Ha/HB3, HA3/A5 HB3 and HA5/HMe. The stereochemistry about the C
N group gives rise to a band at 2218 cm−1 both in 2 and 4; strong absorptions at 1595 cm−1 in 2 and 1598 cm−1 in 4 are characteristic of the carboxylic acid group. COSY, HMQC, HMBC and NOESY methods were used to assign the 1H and 13C NMR spectra of 2 and 4. Assignments of HB2 and HB3, and of HA3 and HA5 in 2 (see Scheme 2 for atom labels) were made on the basis of NOESY cross-peaks between Ha/HB3, HA3/A5 HB3 and HA5/HMe. The stereochemistry about the C![[double bond, length as m-dash]](https://www.rsc.org/images/entities/char_e001.gif) C bond drawn in Scheme 1 is preferred,25 and for 2, the lack of a NOESY peak between HOH and HB3 is consistent with this configuration. A search of the Cambridge Structural Database26,27 using Conquest28 v. 5.37 (with November 2015 update) revealed only 17 hits for compounds containing a C6H4CH
C bond drawn in Scheme 1 is preferred,25 and for 2, the lack of a NOESY peak between HOH and HB3 is consistent with this configuration. A search of the Cambridge Structural Database26,27 using Conquest28 v. 5.37 (with November 2015 update) revealed only 17 hits for compounds containing a C6H4CH![[double bond, length as m-dash]](https://www.rsc.org/images/entities/char_e001.gif) (CN)(CO2H) fragment and all possess the configuration shown in Scheme 1. Kloo and coworkers have demonstrated that photoisomerization of the unit can occur.25
(CN)(CO2H) fragment and all possess the configuration shown in Scheme 1. Kloo and coworkers have demonstrated that photoisomerization of the unit can occur.25
The aldehyde intermediates were converted into the (1-cyanovinyl)phosphonic acids in two steps. 4,4′-(6,6′-Dimethyl-[2,2′-bipyridine]-4,4′-diyl)dibenzaldehyde or 4,4′-(2,9-dimethyl-1,10-phenanthroline-4,7-diyl)dibenzaldehyde was treated with diethyl cyanomethylphosphonate in the presence of piperidine to yield esters 3a (Scheme 2) or 5a, respectively. These compounds were deprotected with Me3SiBr to yield phosphonic acids 3 and 5. Despite several attempts, satisfactory elemental analyses of 3a, 5a, 3 and 5 could not be obtained, probably due to the presence of water. The base peaks in the high resolution electrospray mass spectra of esters 3a or 5a came at m/z 711.2497 and 735.2500, respectively, corresponding to the [M + H]+ ions. For acids 3 and 5, MALDI mass spectra exhibited ions at m/z 599.07 and 622.92, respectively, arising from [M + H]+. ESI-MS and HR ESI-MS could only be obtained by using a solution of 3 or 5 in dilute aqueous NH3 with the instrument in negative mode. Under these conditions, base peaks corresponding to [M − 2H]2− were obtained (see Experimental section). The IR spectra of 3 and 5 (Fig. S2†) demonstrate the presence of the C![[triple bond, length as m-dash]](https://www.rsc.org/images/entities/char_e002.gif) N group with bands at 2209 cm−1 in 3 and 2206 cm−1 in 5.
N group with bands at 2209 cm−1 in 3 and 2206 cm−1 in 5.
Each of 3a and 5a was characterized by 1H, 13C and 31P NMR spectroscopies, and assignments of 1H and 13C resonances were made using routine 2D methods. The 31P NMR spectrum of 3a showed a singlet at δ +10.9 ppm, close to that (δ +10.7 ppm) observed for 5a. In the 1H NMR spectrum of 3a, the signal for vinylic Ha appears as a doublet (JPH ∼ 21 Hz, see Fig. S3†) (and similarly, in the 13C{1H} NMR, the signal for Ca is a doublet with JPC = 7.6 Hz) consistent with the close proximity of the vinylic CH to the phosphonic acid group. A similar spectroscopic signature was observed for 5a. Assignments of HB2, HB3, HA3 and HA5 in 3a and 5a (see Schemes 2 and S1† for labels) were made using NOESY crosspeaks as detailed above for compound 2.
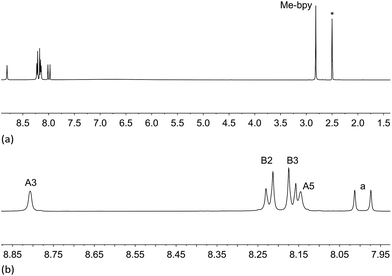
Acids 3 and 5 are poorly soluble in most common organic solvents and show only limited solubility in DMSO; well resolved 1D, HMQC, HMBC and NOESY spectra were obtained for 3 in DMSO-d6, but for 5, only a broadened 1H NMR spectrum could be recorded. Deprotection of 3a to 3, and 5a to 5 was confirmed by the disappearance in the 1H NMR spectra of the signals arising from the ethyl groups in 3a and 5a; Fig. 1 shows the 1H NMR spectrum of 3.
Assembly of dyes on photoanodes
Photoanodes functionalized with the heteroleptic copper(I) sensitizers [Cu(Lanchor)(Lancillary)]+ were assembled in the stepwise protocol (eqn (1)) that we have described in detail elsewhere.8 The FTO/TiO2 surface was sequentially immersed in a DMSO solution of anchoring ligand 1, 2, 3, 4 or 5 (Scheme 1) and then in an acetone solution of [Cu(6)2][PF6] or [Cu(7)2][PF6]. Ancillary ligand 6 (Scheme 3) was chosen as a model ligand to allow evaluations with previous studies in which we have compared the performances of different anchoring ligands.29,30 Compound 7 (Scheme 3) was selected because we have demonstrated that the introduction of the 6-trifluoromethyl substituent leads to enhanced short-circuit current density (JSC) and values of η on going from DSCs sensitized by [Cu(1)(6)]+ to [Cu(1)(7)]+.30
 | (1) |
Fig. 2 shows the solid-state absorption spectra of commercial FTO/TiO2 electrodes (with no scattering layer) with dyes [Cu(2)(7)]+, [Cu(3)(7)]+, [Cu(4)(7)]+ and [Cu(5)(7)]+. Ligands 2 and 4 contain a CO2H anchor, while 3 and 5 have a PO3H2 anchor; 2 and 3 contain a bpy-metal binding unit, while 4 and 5 have a phen-unit. Each functionalized electrode exhibits an absorption maximum around 465 nm arising from the MLCT band of the copper dye. These values of λmax compare with an MLCT band at 443 nm in the solution absorption spectrum of [Cu(7)2][PF6].30 Caution is needed when comparing absolute absorbances in the solid-state spectra; the absorbance with respect to the background tail from the TiO2 is considered. The data in Fig. 2 indicate that the combination of bpy and a PO3H2 anchor (blue curve in Fig. 2) leads to the best dye-loading; based on solution data for homoleptic complexes we feel justified in assuming that the extinction coefficients of the MLCT bands for the four complexes are similar. Fig. 2 also suggests that, for a given anchor, going from phen to bpy ([Cu(4)(7)]+ to [Cu(2)(7)]+, or [Cu(5)(7)]+ to [Cu(3)(7)]+) leads to better dye-adsorption. This trend is also seen in Fig. S4† which compares the solid-state absorption spectra of transparent FTO/TiO2 electrodes functionalized with [Cu(2)(6)]+ and [Cu(4)(6)]+.
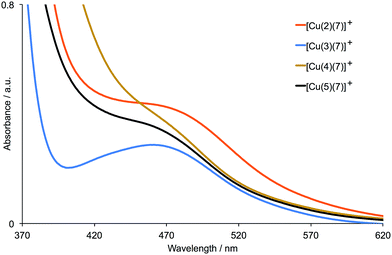 | ||
| Fig. 2 Solid-state absorption spectra of transparent FTO/TiO2 electrodes functionalized with [Cu(2)(7)]+, [Cu(3)(7)]+, [Cu(4)(7)]+ and [Cu(5)(7)]+. | ||
Performances of DSCs containing [Cu(2)(6)]+, [Cu(3)(6)]+, [Cu(4)(6)]+ and [Cu(5)(6)]+ with I3−/I− electrolyte
Table 1 presents the DSC characteristics of duplicate, masked devices containing the sensitizers [Cu(2)(6)]+, [Cu(3)(6)]+, [Cu(4)(6)]+ and [Cu(5)(6)]+, and corresponding J–V curves for the better performing DSC of each pair are shown in Fig. 3; Fig. S5† gives J–V curves for all the devices. The parameters in Table 1 are compared to those for an N719 reference DSC measured under the same conditions. Results for duplicate cells reveal consistent trends as the anchoring ligand is varied. Both [Cu(2)(6)]+ and [Cu(3)(6)]+ contain a bpy-metal binding unit in the anchoring ligand, while [Cu(4)(6)]+ and [Cu(5)(6)]+ contain a phen-coordination domain (Scheme 1). The DSCs sensitized by [Cu(2)(6)]+ perform very poorly, exhibiting low JSC, low open-circuit voltage (VOC), and poor fill-factors (ff). Both JSC and VOC are enhanced (Table 1 and Fig. 3) on going from [Cu(2)(6)]+ (cyanoacrylic acid anchor) to [Cu(3)(6)]+ ((1-cyanovinyl)phosphonic acid anchor). A similar trend is observed on going from DSCs with [Cu(4)(6)]+ to [Cu(5)(6)]+, reinforcing the observation that the (1-cyanovinyl)phosphonic acid anchor is superior to cyanoacrylic acid. By far the best performances are observed for DSCs containing [Cu(3)(6)]+; Fig. 3 demonstrates the significant gains in both JSC and VOC. The fill-factors of 73% contribute to overall relative efficiencies of 29.4% and 32.0% versus 100% set for the N719 reference DSC. The significantly improved values of JSC seen for DSCs with [Cu(3)(6)]+ compared to cells containing the other three dyes are reflected in the EQE spectra shown in Fig. 4; values of EQEmax are given in Table 2. All EQEmax occur at wavelengths of around 480–490 nm (Table 2), red-shifted from the solid-state absorption maxima (∼465 nm). The performances of the DSCs were also recorded after 7 days, and a comparison of Fig. 3 with Fig. S6† shows that the cells are moderately stable; the photoconversion efficiency of the best DSC with dye [Cu(3)(6)]+ decreases from 1.91% (Table 1) to 1.75%.| Dye | JSC/mA cm−2 | VOC/mV | ff/% | η/% | Relative ηa/% |
|---|---|---|---|---|---|
| a Relative to N719 set at 100%. | |||||
| [Cu(2)(6)]+ | 2.01 | 388 | 49 | 0.38 | 6.4 |
| [Cu(2)(6)]+ | 2.61 | 424 | 54 | 0.60 | 10.1 |
| [Cu(3)(6)]+ | 4.67 | 511 | 73 | 1.75 | 29.4 |
| [Cu(3)(6)]+ | 5.09 | 511 | 73 | 1.91 | 32.0 |
| [Cu(4)(6)]+ | 1.06 | 412 | 71 | 0.31 | 5.2 |
| [Cu(4)(6)]+ | 1.59 | 410 | 72 | 0.47 | 7.9 |
| [Cu(5)(6)]+ | 2.95 | 423 | 72 | 0.90 | 15.1 |
| [Cu(5)(6)]+ | 3.06 | 421 | 72 | 0.93 | 15.6 |
| N719 | 13.75 | 641 | 68 | 5.96 | 100 |
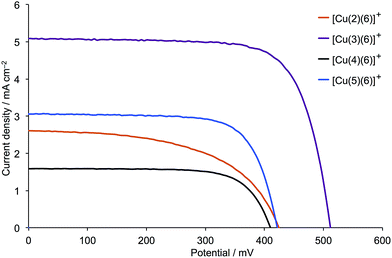 | ||
| Fig. 3 J–V curves for DSCs containing [Cu(2)(6)]+, [Cu(3)(6)]+, [Cu(4)(6)]+ and [Cu(5)(6)]+ combined with I3−/I− electrolyte. For data for duplicate DSCs, see Fig. S5.† | ||
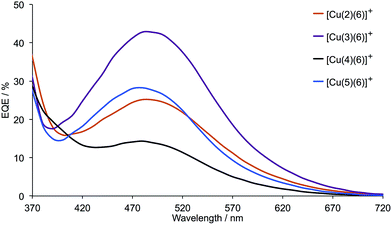 | ||
| Fig. 4 EQE spectra for DSCs containing dyes [Cu(2)(6)]+, [Cu(3)(6)]+, [Cu(4)(6)]+ and [Cu(5)(6)]+ combined with I3−/I− electrolyte. For spectra for duplicate DSCs, see Fig. S7.† | ||
| Dye | Cell 1 | Cell 2 | ||
|---|---|---|---|---|
| EQEmax/% | λ/nm | EQEmax/% | λ/nm | |
| [Cu(2)(6)]+ | 25.1 | 490 | 22.3 | 490 |
| [Cu(3)(6)]+ | 42.7 | 490 | 40.8 | 490 |
| [Cu(4)(6)]+ | 14.3 | 480 | 8.3 | 485 |
| [Cu(5)(6)]+ | 28.2 | 480 | 26.3 | 480 |
| [Cu(3)(7)]+ | 50.3 | 490 | 48.1 | 490 |
| [Cu(1)(7)]+ | 53.4 | 480 | 53.0 | 480 |
The conclusion of this initial investigation is that, for a dye containing the model ancillary ligand 6, the preferred anchoring ligand is 3 with a 6,6′-Me2bpy metal binding domain functionalized with (1-cyanovinyl)phosphonic acid anchors. The poor performances of dyes with the phen-containing anchors 4 and 5 may, in part, be rationalized in terms of the greater flexibility of the bpy (vs. phen) unit. This presumably allows the dyes containing 2 and 3 to adjust more readily to a conformation that facilitates better anchoring to the mesoporous TiO2 surface, as is borne out by the solid-state absorption spectra in Fig. 2. This in turn should lead to enhanced electron injection. It is worth noting that few [Cu(N^N)2]+ sensitizers reported to date have incorporated phen-based anchors.31–33 In two cases, the anchoring carboxylate/carboxylic acid functionalities are attached to the phen 2,9-positions. The few [Cu(N^N)2]+ dyes that exceed η = 3% possess bpy-based anchoring ligands.11,12,34
The effect of introducing a CF3 group into the ancillary ligand
We have previously demonstrated in n-type DSCs that the introduction of CF3 substituents into the 6- or 6,6′-positions of a bpy ancillary ligand leads to a significant improvement in JSC and a small gain in VOC.30 These observations were made using the sensitizers [Cu(1)(7)]+ and [Cu(1)(8)]+ (see Schemes 1 and 3 for 1 and 7; 8 = 6,6′-bis(trifluoromethyl)-2,2′-bipyridine) and by comparing their performances to those of DSCs containing [Cu(1)(6)]+, 6 being the model ligand used above (Scheme 3). Of the two dyes, [Cu(1)(7)]+ outperforms [Cu(1)(8)]+. We now demonstrate that the introduction of a CF3 group into the ancillary ligand is also beneficial when it is combined with a (1-cyanovinyl)phosphonic acid anchor in a copper(I) dye.Parameters for duplicate DSCs containing the dyes [Cu(2)(7)]+, [Cu(3)(7)]+, [Cu(4)(7)]+ and [Cu(5)(7)]+ are given in Table 3. J–V curves for the better performing DSC of each pair are shown in Fig. S8† and reveal the same trends with respect to the anchoring ligand as is observed in Fig. 3. This supports the fact that the best values of both JSC and VOC are obtained with anchoring ligand 3 (bpy unit combined with phosphonic acid anchor). A comparison of the data in Tables 1 and 3 shows a general increase in both JSC and VOC upon introduction of the CF3 group into the ancillary ligand. This is most noteworthy on going from [Cu(3)(6)]+ to [Cu(3)(7)]+, with the result that sensitization by [Cu(3)(7)]+ leads to photoconversion efficiencies of 2.52 and 2.56% (42.3 and 43.0% relative to N719 set at 100%). The increase in the value of EQEmax (Table 2) on going from [Cu(3)(6)]+ to [Cu(3)(7)]+ is consistent with the improvement in JSC; EQE spectra are depicted in Fig. 4 ([Cu(3)(6)]+) and S9† ([Cu(3)(7)]+).
| Dye | JSC/mA cm−2 | VOC/mV | ff/% | η/% | Relative ηa/% |
|---|---|---|---|---|---|
| a Relative to N719 set at 100%. | |||||
| [Cu(2)(7)]+ | 2.84 | 447 | 70 | 0.90 | 15.1 |
| [Cu(2)(7)]+ | 2.17 | 427 | 69 | 0.64 | 10.7 |
| [Cu(3)(7)]+ | 6.59 | 547 | 71 | 2.56 | 43.0 |
| [Cu(3)(7)]+ | 6.59 | 548 | 70 | 2.52 | 42.3 |
| [Cu(4)(7)]+ | 1.89 | 461 | 71 | 0.62 | 10.4 |
| [Cu(4)(7)]+ | 1.51 | 438 | 70 | 0.46 | 7.7 |
| [Cu(5)(7)]+ | 3.53 | 445 | 70 | 1.09 | 18.3 |
| [Cu(5)(7)]+ | 2.30 | 432 | 69 | 0.68 | 11.4 |
| [Cu(1)(7)]+ | 6.30 | 585 | 68 | 2.51 | 42.1 |
| [Cu(1)(7)]+ | 6.01 | 576 | 66 | 2.28 | 38.3 |
| N719 | 13.75 | 641 | 68 | 5.96 | 100 |
Phosphonic acid versus (1-cyanovinyl)phosphonic acid anchor
As discussed earlier, the phosphonic anchoring ligand 1 has been our preferred choice in most recent studies of copper(I)-based DSCs. Although replacement of the phenylene spacers in 1 by 2-thienyl units leads to effective anchoring ligands, the improvement in DSC performance is not dramatic.15 We now compare the performances of n-type DSCs containing the dyes [Cu(3)(7)]+ and [Cu(1)(7)]+ in order to assess whether the (1-cyanovinyl)phosphonic acid anchor has advantages over a phosphonic acid unit.DSC parameters for masked cells containing [Cu(3)(7)]+ and [Cu(1)(7)]+ are given in Table 3, and J–V curves are plotted in Fig. 5 and S10†. Replacing anchor 1 by 3 leads to a small gain in JSC, the enhanced JSC of 6.59 mA cm−2 approaching half of that achieved by the N719 reference DSC (Table 3). On the other hand, use of 1 leads to a higher VOC, and (with all cells exhibiting similar fill-factors of 66–71%) overall, values of η are similar. The EQE spectra in Fig. S9† show a gain in EQEmax of ∼3 to 5% on going from [Cu(3)(7)]+ and [Cu(1)(7)]+ (Table 3) but this is essentially compensated by a red-shift in the spectrum (Fig. S9†).
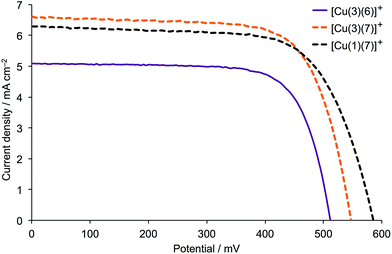 | ||
| Fig. 5 J–V curves for DSCs containing [Cu(3)(6)]+, [Cu(3)(7)]+ and [Cu(1)(7)]+ combined with I3−/I− electrolyte. For data for duplicate DSCs with [Cu(3)(7)]+ and [Cu(1)(7)]+, see Fig. S10.† | ||
Electrochemical impedance spectroscopy (EIS): introduction
To quantify internal charge processes, electrochemical impedance spectroscopy (EIS) was utilized. EIS can be used to investigate physical processes within the DSC, and key parameters such as recombination resistance (Rrec), chemical capacitance (Cμ) and transport resistance (Rt) can be extracted. The measurements are conducted near VOC where a small AC current of varied frequency is superimposed resulting in an impedance response. The measurements can be carried out under various illumination intensities or in the dark, and are conveniently represented in a Nyquist plot (Fig. 6). In this plot, each semi-circle corresponds to the impedance of a specific interfacial charge transfer process which takes place at a given frequency. If following the real number axis from the origin in a DSC-EIS measurement Nyquist plot, the distance from zero to the first semi-circle is the series resistance (Rs) predominantly arising from the charge resistance of the TiO2/FTO.35 On going further along the axis, the first circle corresponds to the cathode/electrolyte charge transfer impedance, and the second is the recombination resistance of the active layer/electrolyte. The small, third semicircle is related to the diffusion resistance of charge carriers in the electrolyte, and may or may not be seen depending on how large it is and on the magnitude of Rrec leading to overlapping of the semi-circles (Fig. 6). When interpreting EIS it is crucial to correctly identify which impedance semi-circle belongs to which process. However, this is easily done for EIS data on DSCs, since a change in bias light intensity should mainly affect only the recombination impedance.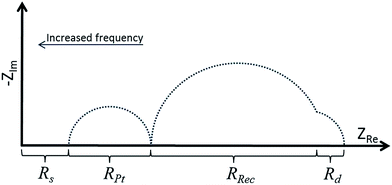 | ||
| Fig. 6 A schematic illustration of a Nyquist plot of a well functioning DSC at high light intensity. | ||
In the following discussion, we first address the factors that contribute to anchoring ligand 3 being superior to 2, 4 and 5. We follow this with a comparison of the behaviours of DSCs containing anchors 1 and 3. In all cases, the ancillary ligand in the copper(I) dye is 7.
EIS for DSCs containing [Cu(2)(7)]+, [Cu(3)(7)]+, [Cu(4)(7)]+ and [Cu(5)(7)]+
While carboxylic acid anchors are common choices in DSCs, they adsorb less strongly to TiO2 than phosphonic acid anchors, with the latter also showing better long-term stability.36,37 However, phosphonic acid anchors show a less efficient charge injection36 which should be revealed in EIS measurements as a lower Cμ. In Fig. 7a, which shows Nyquist plots for DSCs containing [Cu(2)(7)]+, [Cu(3)(7)]+, [Cu(4)(7)]+ and [Cu(5)(7)]+, it can, however, be seen that this is not the case. The carboxylic acid anchors exhibit a much lower chemical capacitance than their phosphonic acid counterparts. At the same time, the recombination resistances for these samples are much larger than for dyes with the phosphonic acid anchors. This suggests that the electron injection through the carboxylic acid anchors is poor and therefore the resulting charge in the semiconductor is low. A low density of injected electrons means, aside from low Cμ, that few electrons are able to undergo electron back reactions, which is shown in the EIS as high Rrec. The reason why the charge transfer of the DSCs with [Cu(2)(7)]+ and [Cu(4)(7)]+ is so poor, results from disruption of electron transport due to reduced dye adhesion and most likely not because these dyes themselves are better at suppressing recombination reactions of injected electrons. The more flexible structure in the bpy unit together with the stronger adhesion given by the phosphonic acid anchor result in the best performing anchor and a much higher chemical capacitance which is consequently seen in the DSC with [Cu(3)(7)]+. Additionally, the low JSC (Table 3) supports that the electron transport is disturbed, especially for [Cu(2)(7)]+ and [Cu(4)(7)]+.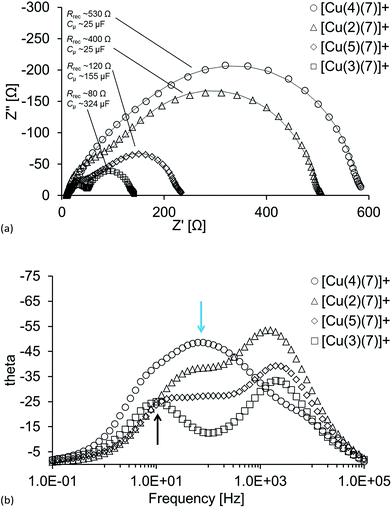 | ||
| Fig. 7 (a) Nyquist plots and (b) Bode plots for DSCs containing the dyes [Cu(2)(7)]+, [Cu(3)(7)]+, [Cu(4)(7)]+ and [Cu(5)(7)]+. See text for interpretation of the blue and black arrows. | ||
The indistinct separation between the first and second semi-circles for DSCs with [Cu(2)(7)]+, [Cu(4)(7)]+ and [Cu(5)(7)]+ (Fig. 7a) indicate that the transport resistance (Rt) is very high (especially for [Cu(4)(7)]+ where Rt > Rrec), even at high light intensities. It can also be seen in the Bode plot (Fig. 7b) that the better the performance of the DSC (Table 3), the more distinct is the phase shift for the TiO2/dye/electrolyte interface (black arrow), which means that the TiO2 has a higher Cμ of the conduction band, i.e. more electrons populate it. The poorly defined separation of the semi-circles in the Nyquist plot in Fig. 7a for the DSC with [Cu(4)(7)]+ due to the exceptionally high Rt is also illustrated in the Bode plot and highlighted by the blue arrow.
As mentioned earlier, isomerization of the C![[double bond, length as m-dash]](https://www.rsc.org/images/entities/char_e001.gif) C double bond in cyanoacrylic acid anchors has been shown to occur upon irradiation.25 This could be the reason why the DSCs containing dyes with anchors 2–5 show such dramatic performance differences. Firstly, the anchor would benefit from a more flexible structure (i.e. bpy rather than phen-based) with the ability to adapt to photoisomerization. Secondly, the anchor would benefit from a stronger binding group (phosphonic rather carboxylic acid) with a larger ability to compensate for conformational changes.
C double bond in cyanoacrylic acid anchors has been shown to occur upon irradiation.25 This could be the reason why the DSCs containing dyes with anchors 2–5 show such dramatic performance differences. Firstly, the anchor would benefit from a more flexible structure (i.e. bpy rather than phen-based) with the ability to adapt to photoisomerization. Secondly, the anchor would benefit from a stronger binding group (phosphonic rather carboxylic acid) with a larger ability to compensate for conformational changes.
EIS for DSCs containing [Cu(1)(7)]+ and [Cu(3)(7)]+
Fig. 8 shows the Nyquist plots for DSCs containing [Cu(1)(7)]+ and [Cu(3)(7)]+ where RPt is as good as unaffected while Rrec varies drastically depending on the given light intensity. The results obtained at high light intensities are also presented in Table 4 and in Fig. 9 where the chemical capacitance is depicted.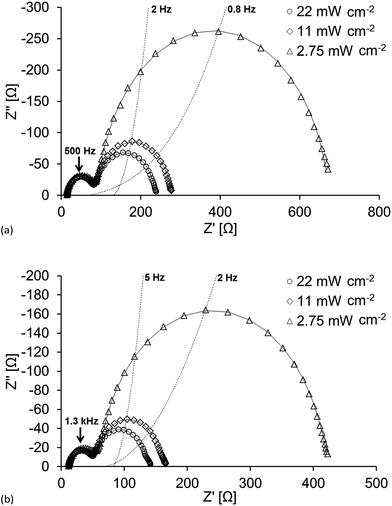 | ||
| Fig. 8 Nyquist plot of DSCs with the dyes (a) [Cu(1)(7)]+ and (b) [Cu(3)(7)]+ under different light intensities. | ||
| Dye | Rt | Rrec | Cμ | RPt | CPt | τ | Ld/L |
|---|---|---|---|---|---|---|---|
| [Cu(1)(7)]+ cell 1 | 57 | 151 | 460 | 52 | 5 | 70 | 1.6 |
| [Cu(1)(7)]+ cell 2 | 62 | 156 | 388 | 52 | 4 | 60 | 1.6 |
| [Cu(3)(7)]+ cell 1 | 36 | 83 | 325 | 28 | 5 | 27 | 1.5 |
| [Cu(3)(7)]+ cell 2 | 51 | 86 | 346 | 42 | 5 | 30 | 1.3 |
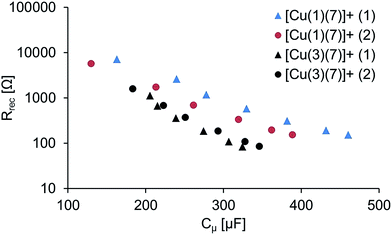 | ||
| Fig. 9 Rrec vs. Cμ of the duplicate DSCs with dyes [Cu(1)(7)]+ and [Cu(3)(7)]+. The numbers (1) and (2) refer to the duplicate cells. | ||
As discussed earlier, Cμ values for [Cu(3)(7)]+ indicate that ligand 3 anchors well to the surface, and the DSC efficiencies are comparable to those of DSCs containing [Cu(1)(7)]+. However, it can be seen in Fig. 8 that the recombination resistance is larger for [Cu(1)(7)]+ at all light intensities which indicates a more efficient charge injection which also yields higher VOC (Table 3). Again, the photoisomerization25 of [Cu(3)(7)]+ may explain these differences, reducing the charge injection. Additionally, if the physical geometry of the dye changes, the accessibility of the electrolyte to the TiO2 may also be affected. This could play a role in the amount of oxidized electrolyte residing close to the surface. This in turn will expedite electron recombination with the electrolyte leading to a decrease in Rrec, and in addition, the conduction band level will decrease and Rt will change as a consequence of charge compensation. This is dealt with in detail later when we discuss Rt. Finally, another contributing factor might be that the electronegative cyano-acceptor group in [Cu(3)(7)]+ not only has an advantageous impact on the internal charge transport within the dye, (i.e. directing electrons towards the semi-conductor), but also facilitates unwanted back-reactions of charge already transferred to the semi-conductor.
The measured chemical capacitance, Cμ, is related to the total density of electrons in the TiO2.38 As the light intensity (LI) increases and reaches LImax, the band gap is smaller and the measured capacitance will ultimately stem from electrons residing in the conduction band of the TiO2. Fig. 9 further highlights the relationship between Rrec and Cμ; as the light intensity increases, Rrec of the DSCs containing [Cu(3)(7)] also decreases more rapid than the other while the capacitance increases at a lower degree.
The electron lifetime, τ, (Table 4) is calculated as the product of Rrec Cμ and is significantly higher for [Cu(1)(7)]+. τ is the lifetime of injected electrons and a higher τ implies a more efficient charge collection. As mentioned above, Rt is the resistance to electron transport in the TiO2. A larger Rt means that the transit time for the electron is larger. If the transit time is larger than the electron lifetime of injected electrons the charge collection will be ineffective. The length of diffusion, Ld, describes the length of the diffusion pathway in the semi-conductor for electrons to back react and should be as long as possible, but at least as long as the TiO2 layer thickness (L).39 In other words Ld/L (which can be calculated as  ) should be larger than 1. This is the case for all DSCs and slightly larger for that with [Cu(1)(7)]+ due to the higher Rrec.
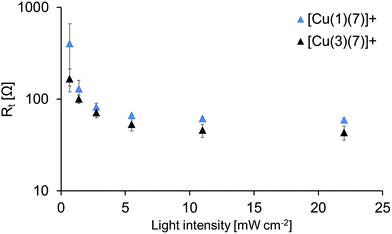
Rt can be seen as a 45° slope between the cathode semi-circle and the recombination one, preferentially at lower bias voltage potentials in well-functioning DSCs. Fig. 10 shows Rt values for DSCs with dyes [Cu(1)(7)]+ and [Cu(3)(7)]+ where the higher Rt is for [Cu(1)(7)]+. As mentioned earlier, changes in Rt generally occur if the electrolyte composition is altered,38 which in turn is an effect of the conduction band (CB) level. The CB level changes with the ability of electrolyte constituents to charge compensate the electrons in the CB.40 More extensive charge compensation lowers the CB level, resulting in lower VOC and Rt but higher JSC. The lower Rt for the cell with [Cu(3)(7)]+ is indeed accompanied by a higher JSC and lower VOC. Yet, in this study the electrolyte composition is the same in all DSCs and the only difference is the dye. A reasonable explanation is that photoisomerization25 of the anchoring ligand upon dye irradiation leads to difference in accessibility of the TiO2 surface towards the electrolyte. This would result in a changed charge compensation situation, which, in turn, has an impact on the CB and therefor on Rt.
Conclusions
The preparation and characterization of the anchoring ligands 2–5 for [Cu(Lanchor)(Lancillary)]+ sensitizers have been described. Ligands 2 and 3 contain a bpy coordination site, while 4 and 5 contain a phen unit; 2 and 4 contain cyanoacrylic acid anchoring units, and 3 and 5 possess (1-cyanovinyl)phosphonic acid anchors. The performances of DSCs containing [Cu(Lanchor)(Lancillary)]+ dyes with Lanchor = 2, 3, 4 or 5 and Lancillary = 6 or 7 reveal that, for both ancillary ligands, anchor 3 is the most beneficial, leading to higher values of both JSC and VOC. Values of η = 2.56 and 2.52% (relative to 5.96% for N719) for DSCs with the dye [Cu(3)(7)]+ compare with 1.91 and 1.71% for [Cu(3)(6)]+, reaffirming30 the favourable effects of introducing a 6-trifluoromethyl substituent into the ancillary ligand. We propose that the better performances of dyes containing 2 and 3 compared to those with 4 and 5 arise from the greater flexibility of the bpy vs. phen unit, allowing dyes containing 2 and 3 to adopt a conformation that gives better surface coverage on mesoporous TiO2. An EIS investigation of DSCs containing dyes [Cu(2)(7)]+, [Cu(3)(7)]+, [Cu(4)(7)]+ and [Cu(5)(7)]+ supports the fact that the main limiting factor for DSCs except that with [Cu(3)(7)]+ is poor dye adhesion. The contributing factors (poorer carboxylic acid adhesion compared to phosphonic acid, the more rigid structure of phen versus bpy, and possible photoisomerization of the alkene unit) render [Cu(4)(7)]+ the poorest dye. This is manifested in the EIS measurements as high recombination resistance together with very low chemical capacitance.In previous investigations, phosphonic acid 1 has been our favoured anchoring ligand in bis(diimine)copper(I) dyes. Replacing 1 by 3 leads to a small gain in JSC, but dyes with anchor 1 have enhanced VOC compared to those with 3. The EIS data for DSCs with dyes containing anchors 3 or 1 are compared, and the latter has a higher recombination resistance and chemical capacitance although the former presents a lower transport resistance. EIS measurements confirm that [Cu(1)(7)]+ has a higher Rrec than [Cu(3)(7)]+, in agreement with the higher VOC for [Cu(1)(7)]+. The lower Rrec observed for [Cu(3)(7)]+ is due to a more inefficient charge injection, and we propose that this may arise from photo-isomerization, reducing the charge injection, and the vicinity of the HOMO orbital to the surface, which could promote back reactions. Furthermore, Rt is lower for [Cu(3)(7)]+, which is a consequence of a lower conduction band level. This indicates that charge compensation for injected electrons occurs more effectively, which is also manifested in the higher JSC for [Cu(3)(7)]+. The reason for this currently remains unclear.
Acknowledgements
We acknowledge the Swiss National Science Foundation (Grant number 200020_144500), the Swiss Nano Institute (for the purchase of the EIS instrument) and the University of Basel for financial support. Fabian Brunner (University of Basel) is thanked for synthesizing ligand 7.Notes and references
- B. O'Regan and M. Grätzel, Nature, 1991, 353, 737 CrossRef; M. Grätzel, Acc. Chem. Res., 2009, 42, 1788 CrossRef PubMed; M. Grätzel, Inorg. Chem., 2005, 44, 6841 CrossRef PubMed; M. Grätzel, J. Photochem. Photobiol., C, 2003, 4, 145 CrossRef and references therein.
- Dye Sensitized Solar Cells, ed. K. Kalyanasundaram, CRC Press, Boca Raton, 2010 Search PubMed.
- A. Hagfeldt, G. Boschloo, L. Sun, L. Kloo and H. Pettersson, Chem. Rev., 2010, 110, 6595 CrossRef CAS PubMed.
- L. Zhang and J. M. Cole, ACS Appl. Mater. Interfaces, 2015, 7, 3427 CAS.
- T. Higashino and H. Imahori, Dalton Trans., 2015, 44, 448 RSC.
- A. Mishra, M. K. R. Fischer and P. Bäuerle, Angew. Chem., Int. Ed., 2009, 48, 2474 CrossRef CAS PubMed.
- F. Ambrosio, N. Martsinovich and A. Troisi, J. Phys. Chem. Lett., 2012, 3, 1531 CrossRef CAS PubMed.
- E. Schönhofer, B. Bozic-Weber, C. J. Martin, E. C. Constable, C. E. Housecroft and J. A. Zampese, Dyes Pigm., 2015, 115, 154 CrossRef.
- C. E. Housecroft and E. C. Constable, Chem. Soc. Rev., 2015, 44, 8386 RSC.
- M. Sandroni, M. Kayanuma, A. Planchat, N. Szuwarski, E. Blart, Y. Pellegrin, C. Daniel, M. Boujtita and F. Odobel, Dalton Trans., 2013, 42, 10818 RSC and references therein.
- F. J. Malzner, S. Y. Brauchli, E. C. Constable, C. E. Housecroft and M. Neuburger, RSC Adv., 2014, 4, 48712 RSC.
- M. Sandroni, L. Favereau, A. Planchat, H. Akdas-Kilig, N. Szuwarski, Y. Pellegrin, E. Blart, H. Le Bozec, M. Boujtita and F. Odobel, J. Mater. Chem. A, 2014, 2, 9944 CAS.
- B. Bozic-Weber, E. C. Constable, C. E. Housecroft, P. Kopecky, M. Neuburger and J. A. Zampese, Dalton Trans., 2011, 40, 12584 RSC.
- B. Bozic-Weber, S. Y. Brauchli, E. C. Constable, S. O. Fürer, C. E. Housecroft, F. J. Malzner, I. A. Wright and J. A. Zampese, Dalton Trans., 2013, 42, 12293 RSC.
- Y. M. Klein, M. Willgert, A. Prescimone, E. C. Constable and C. E. Housecroft, Dalton Trans., 2016, 45, 4659 RSC.
- K. A. Wills, H. A. Mandujano-Ramírez, G. Merino, G. Oskam, P. Cowper, M. D. Jones, P. J. Cameron and S. E. Lewis, Dyes Pigm., 2016, 134, 419 CrossRef CAS.
- N. Armaroli, G. Accorsi, F. Cardinali and A. Listorti, Top. Curr. Chem., 2007, 280, 69 CrossRef CAS.
- B. Bozic-Weber, S. Y. Brauchli, E. C. Constable, S. O. Fürer, C. E. Housecroft, F. J. Malzner, I. A. Wright and J. A. Zampese, Dalton Trans., 2013, 42, 12293 RSC.
- D. O. Kirsanov, N. E. Borisova, M. D. Reshetova, A. V. Ivanov, L. A. Korotkov, I. I. Eliseev, M. Yu. Alyapyshev, I. G. Spiridonov, A. V. Legin, Yu. G. Vlasov and V. A. Babain, Russ. Chem. Bull., 2012, 61, 881 CrossRef CAS.
- A. F. Larsen and T. Ulven, Org. Lett., 2011, 13, 3546 CrossRef CAS PubMed.
- B. Bozic-Weber, V. Chaurin, E. C. Constable, C. E. Housecroft, M. Meuwly, M. Neuburger, J. A. Rudd, E. Schönhofer and L. Siegfried, Dalton Trans., 2012, 41, 14157 RSC.
- Y.-J. Yuan, Z.-T. Yu, J.-Y. Zhang and Z.-G. Zou, Dalton Trans., 2012, 41, 9594 RSC.
- H. J. Snaith, Energy Environ. Sci., 2012, 5, 6513 Search PubMed.
- H. J. Snaith, Nat. Photonics, 2012, 6, 337 CrossRef CAS.
- B. Zietz, E. Gabrielsson, V. Johansson, A. M. El-Zohry, L. Sun and L. Kloo, Phys. Chem. Chem. Phys., 2014, 16, 2251 RSC.
- F. H. Allen, Acta Crystallogr., Sect. B: Struct. Sci., 2002, 58, 380 CrossRef.
- C. R. Groom, I. J. Bruno, M. P. Lightfoot and S. C. Ward, Acta Crystallogr., Sect. B: Struct. Sci., 2016, 72, 171 CrossRef CAS PubMed.
- I. J. Bruno, J. C. Cole, P. R. Edgington, M. Kessler, C. F. Macrae, P. McCabe, J. Pearson and R. Taylor, Acta Crystallogr., Sect. B: Struct. Sci., 2002, 58, 389 CrossRef.
- F. J. Malzner, S. Y. Brauchli, E. Schönhofer, E. C. Constable and C. E. Housecroft, Polyhedron, 2014, 82, 116 CrossRef CAS.
- F. Brunner, M. Klein, S. Keller, C. D. Morris, A. Prescimone, E. C. Constable and C. E. Housecroft, RSC Adv., 2015, 5, 58694 RSC.
- L. N. Ashbrook and C. M. Elliott, J. Phys. Chem. C, 2013, 117, 3853 CAS.
- N. Alonso-Vante, J.-F. Nierengarten and J.-P. Sauvage, J. Chem. Soc., Dalton Trans., 1994, 1649 RSC.
- M. W. Mara, D. N. Bowman, O. Buyukcakir, M. L. Shelby, K. Haldrup, J. Huang, M. R. Harpham, A. B. Stickrath, X. Zhang, J. F. Stoddart, A. Coskun, E. Jakubikova and L. X. Chen, J. Am. Chem. Soc., 2015, 137, 9670 CrossRef CAS PubMed.
- S. O. Fürer, B. Bozic-Weber, T. Schefer, C. Wobill, E. C. Constable, C. E. Housecroft and M. Willgert, J. Mater. Chem. A, 2016, 4, 12995 Search PubMed.
- Q. Wang, J.-E. Moser and M. Grätzel, J. Phys. Chem. B, 2005, 109, 14945 CrossRef CAS PubMed.
- A. Abate, R. Perez-Tejada, K. Wojciechowski, J. M. Foster, A. Sadhanala, U. Steiner, H. J. Snaith, S. Franco and J. Orduna, Phys. Chem. Chem. Phys., 2015, 17, 18780 RSC.
- B. J. Brennan, P. M. J. Llansola, P. A. Liddell, T. A. Moore, A. L. Moore and D. Gust, Phys. Chem. Chem. Phys., 2013, 15, 16605 RSC.
- F. Fabregat-Santiago, J. Bisquert, G. Garcia-Belmonte, G. Boschloo and A. Hagfeldt, Sol. Energy Mater. Sol. Cells, 2005, 87, 117 CrossRef CAS.
- J. Bisquert, F. Fabregat-Santiago, I. Mora-Sero, G. Garcia-Belmonte and S. Gimenez, J. Phys. Chem. C, 2009, 113, 17278 CAS.
- Y. Liu, A. Hagfeldt, X.-R. Xiao and S.-E. Lindquist, Sol. Energy Mater. Sol. Cells, 1998, 55, 267 CrossRef CAS.
Footnote |
| † Electronic supplementary information (ESI) available: Scheme S1: atom labelling for NMR; Fig. S1–S3: IR and NMR spectra; Fig. S4: solid-state absorption spectra; Fig. S5–S10: additional J–V and EQE spectra. See DOI: 10.1039/c6ra20375b |
| This journal is © The Royal Society of Chemistry 2016 |

