DOI:
10.1039/C6RA20267E
(Paper)
RSC Adv., 2016,
6, 93335-93342
Interaction of a synthesized pyrene based fluorescent probe with CT-DNA: spectroscopic, thermodynamic and molecular modeling studies†
Received
11th August 2016
, Accepted 22nd September 2016
First published on 22nd September 2016
Abstract
The present study demonstrates the synthesis of a new pyrene based water soluble fluorescent probe and its interaction with Calf-thymus DNA. The interaction has been studied using various biophysical methods like absorption and fluorescence spectroscopy, optical melting, isothermal titration colorimetry and circular dichroic studies. Experimental results indicate the binding mode between the probe and DNA to be principally intercalative having a binding energy in the range of −7 to −8 kcal mol−1 and the binding process is favored by both negative enthalpy change and positive entropy change. A salt dependent study revealed that the binding is favored by both small ionic interaction and large nonionic interactions. All the data obtained from biophysical studies have been validated by a molecular modeling study.
Introduction
DNA, the most essential molecule of life processes that carries most of the genetic instructions used in the development, functioning and reproduction of living organisms, is an exciting pharmacological target of many of the drugs that are currently in advanced clinical trials.1–3 The study of interaction of small molecules with DNA is very significant not only in understanding the mechanism of interaction but also for the design of new drugs which can artificially alter and/or inhibit the functioning of DNA to control gene expressions.4,5 Such interaction in general involves two dominant binding modes referred to as covalent binding and non-covalent binding. Non-covalently bound drugs mostly fall under the two classes (i) groove binders which complements the shape of the groove and facilitates binding by promoting van der Waals interactions and (ii) intercalators which stack between adjacent DNA base pairs.6,7 The affinity, strength and mode of such binding interactions are governed by a variety of structural and electronic factors. Although so far no specificity has been clearly imposed on the structure of the small molecule to predict its mode of binding with DNA, it is a well known fact that minor groove binding molecules are usually crescent shaped and most of the intercalators are planar aromatic molecules.8,9 To date, significant efforts have been made to design small molecules with structural and chemical features that would bind to CT-DNA with requisite sequence specificity and high binding affinity.10,11 But most of the reported molecules/metal complexes interacts with CT-DNA as groove binder (either it binds to the major groove of the CT-DNA or it binds to the minor groove). There are limited examples of molecules which interact with CT-DNA in intercalative mode. Such as Ganguly et al. reported an anthracene based fluorophore as CT-DNA intercalator, G. Zhang et al. reported a farrerol as DNA intercalator, H. K. Liu reported some metal complexes as DNA intercalator etc.12 But there are still some facts to concern; most of the molecules are not fully water soluble and their binding constant is not high. Considering the above facts we have synthesized a new molecule having interesting structural and chemical feature. We have synthesized a pyrene based probe introducing some H-bond donors and acceptor moieties (like –OH and –NH– groups) to the highly fluorescent pyrene moiety to overcome the above problems. As pyrene is highly sensitive towards the change of its local environment13 and most importantly it is a planer moiety, it should have a fair chance to intercalate and due to presence of H-bond donor acceptor moieties it is sufficiently water soluble as well as its binding strength towards Calf-thymus DNA (CT-DNA) will also expected to be increased.
The present contribution thus describes the binding interaction of Calf-thymus DNA (CT-DNA) with 2-hydroxymethyl-2-[(pyren-1-ylmethylene)-amino]-propane-1,3-diol (compound 1) in aqueous buffer medium. The modulated ground and excited state photophysics of the molecule within bio-environment has been used as the actuating tool to monitor the binding process, whereas the changes in the conformation of the biopolymer exerted by the probe have been explored using a circular dichroic study. Molecular docking has been done to support the experimental results.
Experimental
Materials
Spectroscopic grade solvents such as n-hexane (HEX), cyclohexane (CY), carbon tetrachloride (CCl4), dioxane (DOX), tetrahydrofuran (THF), chloroform (CHCl3), dichloromethane (DCM), dimethylformamide (DMF), dimethyl sulfoxide (DMSO), acetonitrile (ACN), isopropanol (iPrOH), n-butanol (BuOH), ethanol (EtOH) and methanol (MeOH) purchased from Spectrochem, India were used after proper distillation as required. Triple distilled water has been used for preparing the aqueous solutions. Disodium hydrogen phosphate and citric acid were purchased from SRL, India. CT-DNA was purchased from Sigma-Aldrich Corporation (St. Louis, MO, USA) and its concentration has been determined spectrophotometrically. Known molar extinction coefficients of CT-DNA (ε = 6600 M−1 cm−1 at 260 nm)14 (expressed in terms of nucleotide phosphates) has been used to determine the concentration by absorbance measurements.
All the experiments have been conducted in citrate-phosphate (CP) buffer medium (10 mM [Na+]) at pH 7.0, containing 5.0 mM Na2HPO4. The pH of the medium has been adjusted using citric acid.15,16 The pH values of the solutions have been measured with a calibrated Orion-Ross combined electrode system (Model 81-02). All buffer solutions have been filtered through Millipore filters (Millipore, India Pvt. Ltd, Bangalore, India) of 0.45 μM, before use. In all the spectral measurements, the concentration of the drug was maintained at ∼1.5 μM to avoid aggregation and re-absorption effects.
Absorbance spectral studies
Absorbance spectra have been measured on a Hitachi UV-vis (Model U-3501) spectrophotometer at 25 ± 0.1 °C in quartz cells of 1.00 cm path length.
Fluorescence spectral studies
All fluorescence spectral studies have been measured on a Perkin-Elmer (Model LS-55) fluorimeter equipped with a thermoelectrically controlled cell holder in matched quartz cells of 1.00 cm path length under stirring at 25 ± 0.5 °C. Temperature variation fluorescence spectra have been measured by keeping the emission cell compartment at a chosen temperature using variable temperature chiller.
Fluorescence lifetime studies
Time Correlated Single Photon Counting (TCSPC) spectrophotometer (Horiba Jobin Yovin) has been used to acquire fluorescence lifetime using a employing a nanosecond diode laser (IBH, nanoLED-07) operating at λex = 336 nm as the light source to trigger the fluorescence of 1 in different medium at different emission maxima and TBX-04 as the detector. The emission signals from the samples have been collected with an emission polarizer kept at the magic angle (∼54.7°). The decays have been evaluated using Data Station v-2.5 decay analysis software. The parameters which are considered here for goodness of fit are χ2 values, Durbin–Watson parameter and visually good residual plot. Average lifetimes (τavg) of fluorescence for multiexponential decay have been calculated from the decay times (s) and pre-exponential factors (a) using the following equation:
Determination of affinity constants
Binding affinities of the pyrene compound to CT-DNA have been determined from absorbance and fluorescence titrations. From the titration data the concentrations of bound and the free ligand (Cb and Cf) have been determined from the absorbance or fluorescence change at a fixed wavelength which usually corresponds to the wavelength of maximum changes. If AF(or IF), AB(or IB), and A(I) represents respectively the absorbance (or fluorescence) of the initially, finally, and partially titrated ligands, then the fraction of the bound ligand molecules αb would be given by| | |
αb = [AF(or IF) − A(I)]/[AF(IF) − AB(IB)]
| (1) |
The molar concentration of free (Cf) and bound (Cb) ligands molecules and r could be evaluated from the following equations where D and P represent the total input ligand and RNA phosphate concentrations respectively
Binding data obtained from spectrophotometric titration were cast into the form of Scatchard plot of r/Cf versus r, where r is the number of ligand molecules bound per mole of nucleotide. Non-linear binding isotherms were fitted to a theoretical curve drawn according to the excluded site model [1] for a non-linear non-cooperative ligand binding system using the following equation,
| |
 | (5) |
where
K′ is the intrinsic binding constant to an isolated binding site, and
n is the number of nucleotides excluded by the binding of a single ligand molecule. The binding data were analyzed using the programme Origin 7.0.
17
Fluorescence quenching studies
Fluorescence quenching experiments have been performed with an anionic quencher K4[Fe(CN)6] as reported earlier.18,19
UV-optical melting study
Absorbance versus temperature profiles (melting curves) of CT-DNA were measured where melting curves has been recorded on a Jasco V-630 unit equipped with the Peltier controlled Jasco PAC-743 model accessory (Jasco International Co. Ltd. Tokyo, Japan).19,20
Circular dichroic study
All circular dichroic measurements were performed by a JASCO: J-815 spectropolarimeter (Japan Spectroscopic Ltd., Japan) controlled by a PC. A rectangular quartz cell having 1 cm path length has been used for all CD measurements performing at 25 ± 0.5 °C.20,21
Isothermal titration calorimetric studies
To study the heat capacity change and enthalpy of binding isothermal titration calorimetric experiments have been performed using a VP ITC calorimeter.20 Aliquots of degassed CT-DNA solution (650 μM) were injected from a rotating syringe (1500 rpm) into the isothermal sample chamber containing the (COMPOUND) solution (10 μM).
Molecular docking studies
Compound 1 has been docked into four DNA decamer sequences viz. S1 to S4, in order to find out any base sequence specific binding of 1. The selected B-DNA duplex sequences consist of 10 base pairs each with a central core having four specific bases from the 5′-end in each DNA duplex (Table S1†). The structural coordinates of sequences DNA-1 to DNA-4 have been generated in PDB format according to Arnott et al. using the scfbio server at IIT-Delhi.22 Docking calculations using MOE program have been conducted using Alpha PMI as the placement methodology. The docked poses obtained thus have further been refined using force field method available in the MOE program. The docking has been done by placing 1 in between the DNA base pair and the search space has been set to the pocket. Once the ligand has been placed, the docking run has been initiated with the input parameters described above.
Cell cultures
Human breast cancer cells MDA-MB 468 have been obtained from National Institute of Cell Science (NCCS), Pune, India. Cells have been grown in DMEM medium with 10% fetal bovine serum (FBS), penicillin/streptomycin (100 units per ml) at 37 °C and 5% CO2. All the treatments have been performed at 37 °C and at a cell density allowing exponential growth.
Cell survivability assay
Cells have been evaluated for cytotoxicity with 1 according to standard protocol. Cells have been seeded in 96-well plates at a density of 1 × 10⁴ cells per well and cultured for 24 h. Briefly, cells have been seeded in 96 well plates at 1 × 10⁴ cells per well and exposed to 1 at the concentrations of 0 μg ml−1, 5 μg ml−1, 20 μg ml−1, 50 μg ml−1, 100 μg ml−1, 150 μg ml−1 for 24 h. After incubation, cells have been washed with 1× PBS twice and incubated with MTT solution (450 μg ml−1) for 3–4 h at 37 °C. The resulting formazan crystals have been dissolved in an MTT solubilisation buffer and the absorbance have been measured at 570 nm by using a microplate reader (Biorad) and the value has compared with the control cells. Each variable was assessed through MTT assay in triplicate.
Synthesis and structural characterization of 1
2-Hydroxymethyl-2-[(pyren-1-ylmethyl)-amino]-propane-1,3-diol has been prepared by two steps, (i) the condensation reaction between pyrene-1-carboxaldehyde (500 mg, 2.91 mmol) and Tris(hydroxymethyl) aminomethane (350 mg, 2.91 mmol) to synthesize 2-hydroxymethyl-2-[(pyren-1-ylmethylene)-amino]-propane-1,3-diol. Then to a methanolic suspension of 2-hydroxymethyl-2-[(pyren-1-ylmethylene)-amino]-propane-1,3-diol solid NaBH4 (220 mg, 5.82 mmol) has been added portion wise at 0 °C with constant stirring for 1 h (Scheme S1†). The solvent has been evaporated under reduce pressure and the solid products have been dissolved in water. A clear solution has been obtained. Then the solution has been naturalized (pH ∼ 7) with dilute HCl. Compound 1 precipitates as grey solid, which has been filtered and washed thoroughly with water. The solid has been dried under vacuum, yield 90%.
1H NMR (300 MHz, d6-DMSO, 20 °C) δ (ppm): 8.469–7.915 (m, 9H), 4.360 (s, 2H), 3.805 (s, 1H), 3.448 (s, 6H), 1.96 (s, 3H); 13C NMR (75.5 MHz, d6-DMSO, 20 °C) δ (ppm): 43.82, 61.60, 124.18, 124.37, 124.45, 125.13, 125.22, 125.41, 125.49, 136.63, 127.30, 127.71, 128.83, 128, 130.36, 130.75, 131.15 IR (KBr): 3277, 2913, 2869, 1598, 1468, 1398, 1235, 1105, 1048 cm−1.
Result and discussion
Absorption and emission study
The absorption spectra of compound 1 show mainly two absorbance bands at 341 nm, 325 nm with a hump at 312 nm (Fig. 1a and Table 1). The absorption band structure is observed to be typically the spectral pattern of pyrene unit which is expected. Absorption spectral changes of compound 1 have been studied with varying concentration of CT-DNA in citrate phosphate buffer. With addition of CT-DNA to the solution of 1 the absorbance values decreases appreciably with the appearance of a new band at 352 nm. CT-DNA induced spectral changes may be explained in terms of formation of a new 1–DNA complex as a result of strong binding interaction between 1 and CT-DNA. The presence of a clear isosbestic point at 347 nm also provides the evidence of 1–DNA complex formation via one type of binding interaction between 1 and CT-DNA (Fig. 2a).23,24
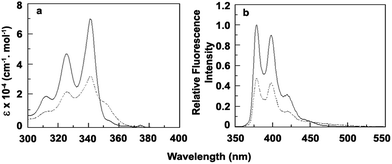 |
| | Fig. 1 (a) Molar extinction coefficient and (b) relative fluorescence intensity (λex = 335 nm) of free (solid line) and bound (broken line) form of 1 with CT-DNA. | |
Table 1 Summary of optical properties of free and bound 1 with CT-DNAa
| |
|
λmax (free) nm |
εf (M−1 cm−1) |
λmax (bound) nm |
εb (M−1 cm−1) |
| Average of three data. Optical properties were determined in CP buffer containing 5 mM Na2HPO4, pH 7.0 at 25.0 °C. |
| Absorbance |
Peak 1 |
341 |
70![[thin space (1/6-em)]](https://www.rsc.org/images/entities/char_2009.gif) 000 000 |
342 |
31![[thin space (1/6-em)]](https://www.rsc.org/images/entities/char_2009.gif) 391 391 |
| Peak 2 |
325 nm |
46![[thin space (1/6-em)]](https://www.rsc.org/images/entities/char_2009.gif) 478 478 |
325 |
21![[thin space (1/6-em)]](https://www.rsc.org/images/entities/char_2009.gif) 602 602 |
| Peak 3 |
312 nm |
18![[thin space (1/6-em)]](https://www.rsc.org/images/entities/char_2009.gif) 460 460 |
312 |
8687 |
| |
|
λmax,ex (nm) |
λmax,em (nm) |
Fb/F0 |
| Fluorescence |
Peak 1 |
335 |
378 |
0.47 |
| Peak 2 |
398 |
0.47 |
| Peak 3 |
419 |
0.47 |
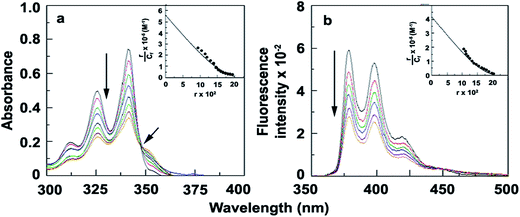 |
| | Fig. 2 (a) UV-Vis titration of 1 with increasing concentration of CT-DNA (inset: Scatchard plot obtained from absorbance study) (b) fluorescence titration (λex = 335 nm) of 1 with increasing concentration of CT-DNA (inset: Scatchard plot obtained from fluorescence study). | |
The emission profile of 1 shows three emission bands at 378, 398 and 419 nm upon excitation at 335 nm in CP buffer which can be attributed to the usual vibronic band pattern of pyrene (Fig. 1b and Table 1).25 With the addition of increasing concentration of CT-DNA fluorescence intensity of 1 decreases gradually with an iso-emissive point at 450 nm (Fig. 2b). The observed fluorescence quenching also supports binding interaction between 1 and DNA through 1–DNA complex formation.
Evaluation of binding parameter
Since the estimation of the binding constant can provide some idea about the mode of binding, we have calculated the binding constant using noncooperative Scatchard analysis method from both the absorption and the emission titration data (Fig. 2a and b). This analysis shows that the binding constant obtained from UV-Vis titration is 5.60 × 10⁵ M−1 and from fluorometric titration is 4.52 × 10⁵ M−1 where the number of excluded binding sites are 2.1 base pair and 2.52 base pair respectively indicating intercalation mode of interaction (Fig. 2a and b, inset). The results obtained from the above study collaborate well with molecular docking study which has been discussed later.
Ionic strength dependence of the binding and analysis of the free energy of binding
With the increment of ionic strength of the solution the negative charges of the phosphate backbone of the DNA gets neutralized. Therefore, the unwinding tendency caused by the electrostatic repulsions present in between the phosphate groups decreases which results in a shrinking of the helix affecting both the intercalation and groove binding. To study the contribution of ionic strength in the present binding process UV-Vis titration of 1 with CT-DNA has been done at three different salt concentrations (10 mM, 20 mM and 50 mM) of [Na+] and binding constants have been evaluated. The relation between binding constant (K) and salt concentration has been determined using the following equation as stated by Record et al.26| |
 | (6) |
where Z is the apparent charge on the bound ligand and ψ is the fraction of the [Na+] bound per DNA phosphate. Plot of log![[thin space (1/6-em)]](https://www.rsc.org/images/entities/char_2009.gif) K versus log[Na+] yields a straight line showing a decrease in binding constant with increasing salt concentration, i.e. the concentration of [Na+] (Fig. 3a). The slope (ZΨ) of the curve is actually 0.438 which indicates the number of ions released which is in good agreement with that reported data for mono cationic molecules binding to double stranded DNAs and RNAs.16,19 The observed free energy can be partitioned between two contributions, namely the non-polyelectrolytic contribution (ΔGt) and the polyelectrolytic contribution (ΔGpe)27,28 using following equation:
K versus log[Na+] yields a straight line showing a decrease in binding constant with increasing salt concentration, i.e. the concentration of [Na+] (Fig. 3a). The slope (ZΨ) of the curve is actually 0.438 which indicates the number of ions released which is in good agreement with that reported data for mono cationic molecules binding to double stranded DNAs and RNAs.16,19 The observed free energy can be partitioned between two contributions, namely the non-polyelectrolytic contribution (ΔGt) and the polyelectrolytic contribution (ΔGpe)27,28 using following equation:| |
ΔG = −RT![[thin space (1/6-em)]](https://www.rsc.org/images/entities/char_2009.gif) ln ln![[thin space (1/6-em)]](https://www.rsc.org/images/entities/char_2009.gif) K = ΔGt + ΔGpe K = ΔGt + ΔGpe
| (7) |
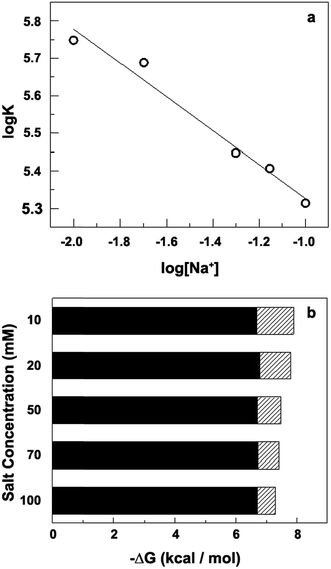 |
| | Fig. 3 (a) log![[thin space (1/6-em)]](https://www.rsc.org/images/entities/char_2009.gif) K vs. log[Na+] plot. (b) The solid parts and hatched parts indicate the nonpolyelectrolytic (ΔGt) and the polyelectrolytic (ΔGpe) contribution respectively to the binding free energy. K vs. log[Na+] plot. (b) The solid parts and hatched parts indicate the nonpolyelectrolytic (ΔGt) and the polyelectrolytic (ΔGpe) contribution respectively to the binding free energy. | |
Record and coworkers have shown that ΔGpe = −(ZΨ)RT![[thin space (1/6-em)]](https://www.rsc.org/images/entities/char_2009.gif) ln[MX], where MX is the monovalent salt concentration. The magnitude of ΔGpe is the free energy contribution arising from coupled polyelectrolytic forces particularly that from the release of condensed counter ions from the DNA helix upon binding of charged ligands. The free energy of binding of 1 to the DNA and the polyelectrolytic and the non-polyelectrolytic contribution to the same have been calculated and presented in Table 2.
ln[MX], where MX is the monovalent salt concentration. The magnitude of ΔGpe is the free energy contribution arising from coupled polyelectrolytic forces particularly that from the release of condensed counter ions from the DNA helix upon binding of charged ligands. The free energy of binding of 1 to the DNA and the polyelectrolytic and the non-polyelectrolytic contribution to the same have been calculated and presented in Table 2.
Table 2 Binding constants at different salt concentration determined by spectrophotometric process and analyzed by Scatchard analysis
| Salt concentration (mM) |
Binding constant K × 10−5 (M−1) |
ΔGt (cal mol−1) |
ΔGpe (cal mol−1) |
ΔGobs (cal mol−1) |
| 10 |
5.60 |
−6688 |
−1202 |
−7890 |
| 20 |
4.88 |
−6786 |
−1021 |
−7807 |
| 50 |
2.80 |
−6696 |
−782 |
−7478 |
| 70 |
2.55 |
−6726 |
−694 |
−7420 |
| 100 |
2.08 |
−6696 |
−602 |
−7298 |
In all cases, the values of K are obtained from noncooperative Scatchard analysis. A graphical representation of the same has been presented in Fig. 3b where the electrostatic contribution is predominant. The value of ΔGt remains invariant at all ionic strengths while the ΔGpe contribution decreases with increasing concentration of [Na+] ion. These phenomena indicate that binding process has been forced by both electrostatic (high) and non-electrostatic contribution (low).
Time-resolved fluorescence decay measurements
To get a generalized picture of the interactions involved, we have done the fluorescence decay experiment of 1 in presence and absence of CT-DNA. Compound 1 is found to exhibit a bi-exponential decay pattern in aqueous buffer phase which composed of a long lived component (∼263 ns) ascribed to the free molecule and another component having lifetime ∼2.29 ns attributed to the hydrated cluster of the molecule.29 After addition of DNA, as expected the decay profile of the molecule shows three components in which the magnitude of the component corresponding to the free molecule and the hydrated cluster decreases in high extent with the development of a new component having distinctly different lifetime (Fig. 4, Table 3). The new component may be ascribed as 1–DNA complex. This phenomenon also corroborates to the presence of an isosbestic point in the both absorption and emission spectra indicating specifically one mode of binding.
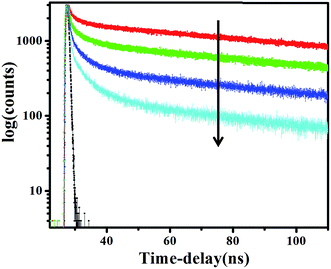 |
| | Fig. 4 Fluorescence decay profile of 1 with increasing DNA concentration, λex = 336 nm, λem (max) = 419 nm. | |
Table 3 Time-resolved fluorescence decay parameters of 1 with increasing concentrations of DNA
| [DNA] in μM |
α1 (%) |
α2 (%) |
α3 (%) |
τ1 (ns) |
τ2 (ns) |
τ3 (ns) |
χ2 |
| 0 |
64 |
36 |
— |
263.6 |
2.29 |
|
1.12 |
| 50 |
21 |
10 |
70 |
280.5 |
5.03 |
0.47 |
1.08 |
| 100 |
5 |
14 |
81 |
283.4 |
3.98 |
0.56 |
1.08 |
| 150 |
2 |
10 |
87 |
284.7 |
4.33 |
0.58 |
1.07 |
Optical melting study
The DNA melting study is an evidence for the mode of binding interaction between 1 and CT-DNA. The DNA melting temperature is defined as the temperature at which half of a DNA samples is melted to form random-coil state which mainly depends on the stability of its double helix.30 It is well established that intercalation of natural or synthetic molecules increases the DNA melting temperature whereas non-intercalation binding causes no obvious change in melting temperature. Here, DNA melting study has been done by monitoring the absorbance at 260 nm for the DNA in the absence and presence of 1 which displays a increment of the melting temperature from 340.9 K to 346.7 K (Fig. 5a and b). This result indicates intercalation type of binding and the DNA helix becomes more stable in presence of 1 indicating a strong binding. The binding constant determined from the melting study is 1.96 × 10⁵ M−1 which shows good agreement with other results. The van't Hoff enthalpies of melting of free and bound DNA are 52.56 kcal mol−1 and 59.20 kcal mol−1 respectively which may be a sign of stabilization of DNA double helix due to binding with 1.
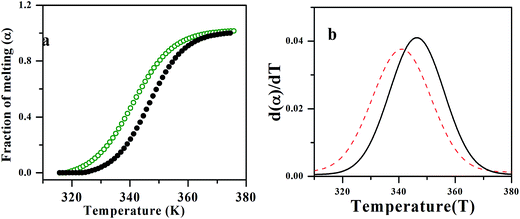 |
| | Fig. 5 Plot indicating (a) fraction of denaturation vs. temperature for free DNA (green line) and 1–DNA complex (black line). (b) Derivative of fraction of denaturation vs. temperature for DNA (red line) and 1–DNA complex (black line). | |
Fluorescence quenching studies
Generally, the negatively charged phosphate backbone of DNA repels highly negatively charged quencher. Therefore, if the binding mode between the molecule and DNA is intercalation, very little or no change will be observed as the molecule remains protected within the negatively charged DNA helix.31 Alike intercalation, in case of groove binding the fluorescence intensity of the molecule quenches with the addition of the quencher. To investigate the mode of binding of 1 with CT-DNA, fluorescence quenching experiment has been performed using [Fe (CN)6]4− as quencher. The quenching of fluorescence intensity of 1 and 1–DNA complex has been observed in the presence of [Fe(CN)6]4− which shows that quenching constants for 1 and 1–DNA complex are 2.01 mM−1 and 0.047 mM−1 respectively indicating intercalation mode of binding of 1 into the DNA base pairs (Fig. 6).
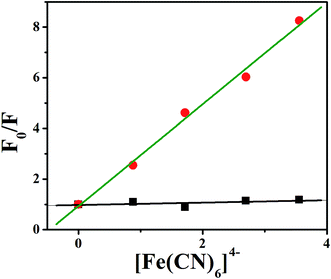 |
| | Fig. 6 Fluorescence quenching plots of 1 by K4[Fe(CN)6] in the absence and presence of DNA in CP buffer at room temperature (green line stands for the absence of DNA and black line for presence of DNA). | |
Fluorescence energy transfer
When compound 1 intercalates into the DNA base pair it may transfer its energy to DNA. The amount of energy transfer has been measured by quantum efficiency using the following equation:32,33
where qb and qf denote the quantum efficiency of the 1–DNA complex and the free 1, εf and εb are the ε values of the free and bound form of 1 and Ib and If are the fluorescence intensities of the bound and free form of 1 respectively. From the data and it has been observed that quantum efficiency is 1.04 which is the indication of higher retention of fluorescence energy of bound form of 1 than that of free due to shielding of probe from solvent by DNA.
Conformational aspects of binding
To study the conformational change of DNA helix, intrinsic CD spectra of DNA in presence and absence of 1 have been taken. The intrinsic CD spectra of the DNA display B-form conformation characterized by a large positive band at 275 nm and a large negative band at 238 nm. These bands are caused due to the stacking interactions between the bases and the helical structure of DNA that provide asymmetric environment for the bases. In presence of increasing concentration of 1, the ellipticity of the long wavelength positive band (275 nm) increased and negative band (235 nm) decreased as the interaction progressed (Fig. 7). As the compound 1 has no optical activity, the change of ellipticity i.e. the conformational changes of DNA is obviously due to binding of 1 with CT-DNA. The increasing of positive band is the indication of increase of stacking because of intercalation of 1 in the DNA helix.34,35
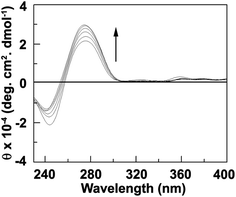 |
| | Fig. 7 Intrinsic CD spectra of CT-DNA (50 μM) in presence of 0, 10, 15, 20, 25, 30 and 35 μM of 1 (curve 1 to 7). | |
Isothermal calorimetric titration studies
To evaluate the thermodynamic parameters during binding process of 1 and CT-DNA, the isothermal calorimetric study has been done in water buffer at 25 °C. 1500 μM of CT-DNA has been added into 10 μM of aqueous solution of 1. The upper panel of Fig. 8 indicates the heat change due to addition of DNA into 1. The lower panel showed the integrated value of heat change due to binding. The data has been fitted by one site binding process and it has been found that the binding constant K is 3.54 × 10⁵ M−1. Here the number of excluded binding site is 2.64 base pair. The heat change (ΔH) entropy change (ΔS) corresponding to this binding phenomenon are −2612 cal mol−1 and 16.8 cal mol−1 K−1 respectively. These results clearly show that the binding process has been favoured by both negative enthalpy change and positive entropy change.
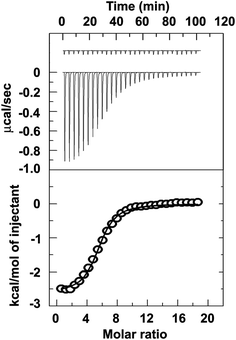 |
| | Fig. 8 Representative ITC profiles for the titration of CT-DNA with 1 at 25 °C. The top panel represent the raw data for the sequential injection of DNA into the 1, and the bottom panel show the integrated heat data after correction of heat of dilution against the molar ratio of DNA/[1]. The data points were fitted to one site model, and the solid lines represent the best-fit data. | |
Molecular docking study
Molecular docking study has been performed using MOE program to obtain the detail theoretical interpretation of binding of compound 1 with CT-DNA. MOE program predicts that 1 intercalates into the DNA base pairs via π⋯π stacking interaction between the pyrene ring of 1 and DNA base pairs (Fig. 9a and b). The free energy of binding is in the range between −8.50 to −7.08 kcal mol−1 which collaborates well with the experimental results. It has been also observed that the outer side chain remain out side the DNA base pairs and the complex has been stabilized by hydrogen bonding of hydroxyl groups of the compound 1.
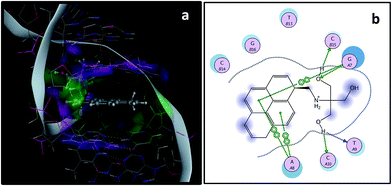 |
| | Fig. 9 Molecular docking using MOE: (a) 1 in the DNA (b) two dimensional interaction diagram of 1–DNA system (buttons with A & T represent adenine and thymine bases in DNA). | |
Cell survivability assay
Cytotoxicity of a particular compound is a very important parameter for practical applications. In order to test cytotoxicity of 1, we have performed MTT assay in MDA-MB 468 cells treated with various concentrations (0–150 μg ml−1) of compound 1 for up to 24 h. The percentage of cell survivability at different concentration of compound 1 has been shown in Fig. 10 which provides us enthusiastic information regarding its cellular application at the indicated dose and time of incubation without much concern about its cytotoxicity.
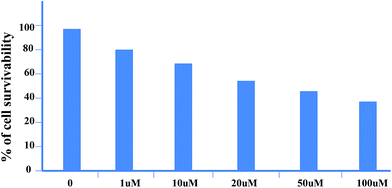 |
| | Fig. 10 Cytotoxic effect of 1 on MDA-MB-468 cells. Cells have been incubated with increasing concentrations 1 and its survivability has been assessed by MTT assay. Results are expressed as mean of three independent experiments. | |
Conclusion
In conclusion we have synthesized a water soluble pyrene based fluorescent probe by a simple condensation between 1-pyrenecarboxaldehyde and Tris(hydroxymethyl)aminomethane followed by reduction and have explored its binding interaction with Calf-thymus DNA in CP buffer. It is seen that the photophysical and dynamical behavior of the molecule are found to be remarkably modified due to interaction with CT-DNA in the aqueous buffer phase. From the sequence of studies done here, the mode of binding of the molecule with DNA is found to be principally intercalative in nature. High binding constant, negative enthalpy change and positive entropy change evidence for a very strong binding of the molecule with CT-DNA. Furthermore, to assess the merit of the molecule to function as a therapeutic agent i.e. the influence of molecule binding on the secondary structural contents has been explored from CD measurements. Moreover, cytotoxicity experiment provides us enthusiastic information regarding the cellular application of compound 1. Thus, the present study may provide valuable information regarding drug–DNA interactions, which may be useful for the greater clinical efficacy of rational drug design.
Acknowledgements
Soumen Ghosh would like to thank UGC for senior research fellowship.
References
- J. M. Berg, J. L. Tymoczko and L. Stryer, Biochemistry, W. H. Freeman and Company, New York, 5th edn, 2002 Search PubMed.
- R. Acher, Proteins and Nucleic Acids, Comprehensive Biochemistry, Elsevier Publishing Company, New York, 1963, vol. 8 Search PubMed.
- O. Kennard, Pure Appl. Chem., 1993, 65, 1213–1222 CrossRef CAS.
- I. Saha, M. Hossain and G. S. Kumar, J. Phys. Chem. B, 2010, 114, 15278–15287 CrossRef CAS PubMed.
- P. B. Dervan, Bioorg. Med. Chem., 2001, 9, 2215 CrossRef CAS PubMed.
- B. Armitage, Chem. Rev., 1998, 98, 1171 CrossRef CAS PubMed.
- R. Palchaudhuri and P. J. Hergenrother, Curr. Opin. Biotechnol., 2007, 18, 497–503 CrossRef CAS PubMed.
- S. Das and G. S. Kumar, J. Mol. Struct., 2008, 872, 56–63 CrossRef CAS.
- M. Hossain and G. S. Kumar, Mol. BioSyst., 2009, 5, 1311–1322 RSC.
-
(a) J. B. Chaires, Curr. Opin. Struct. Biol., 1998, 8, 314–320 CrossRef CAS PubMed;
(b) F. Yang, N. G. Nickols, B. C. Li, G. K. Marinov, J. W. Said and P. B. Dervan, Proc. Natl. Acad. Sci. U. S. A., 2013, 110, 1863–1868 CrossRef CAS PubMed;
(c) P. B. Dervan, Bioorg. Med. Chem., 2001, 9, 2215–2235 CrossRef CAS PubMed.
-
(a) G. Zhang, L. Wang, X. Zhou, Y. Li and D. Gong, J. Agric. Food Chem., 2014, 62, 991–1000 CrossRef CAS PubMed;
(b) Y. Ma, G. Zhang and J. Pan, J. Agric. Food Chem., 2012, 60, 10867–10875 CrossRef CAS PubMed;
(c) Y. Zhang, G. Zhang, Y. Li and Y. Hu, J. Agric. Food Chem., 2013, 61, 2638–2647 CrossRef CAS PubMedX. Zhou, G. Zhang and L. Wang, Int. J. Biol. Macromol., 2014, 67, 228–237 CrossRef CAS PubMed.
-
(a) A. Ganguly, S. Ghosh and N. Guchhait, Phys. Chem. Chem. Phys., 2015, 17, 483–492 RSC;
(b) G. Zhang, P. Fu, L. Wang and M. Hu, J. Agric. Food Chem., 2011, 59, 8944–8952 CrossRef CAS PubMed;
(c) H. K. Liu and P. J. Sadler, Acc. Chem. Res., 2011, 44, 349–359 CrossRef CAS PubMed.
- N. Cho and S. A. Asher, J. Am. Chem. Soc., 1993, 115, 6349 CrossRef CAS.
- M. M. Islam, A. Basu, M. Hossain and G. S. Kumar, DNA Cell Biol., 2011, 30, 123–133 CrossRef CAS PubMed.
- M. M. Islam, P. Pandey, S. Kumar, C. S. Roy and G. S. Kumar, J. Mol. Struct., 2008, 891, 498–507 CrossRef CAS.
- K. Bhadra and G. S. Kumar, Med. Res. Rev., 2011, 31, 821–862 CrossRef CAS PubMed.
-
(a) J. D. McGhee and P. H. von Hippel, J. Mol. Biol., 1974, 86, 469–489 CrossRef CAS PubMed;
(b) M. M. Islam and G. S. Kumar, Biochim. Biophys. Acta, 2009, 1790, 829–839 CrossRef CAS PubMed.
- S. Sarkar and K. Bhadra, J. Photochem. Photobiol., B, 2014, 130, 272–280 CrossRef CAS PubMed.
- M. M. Islam, R. Sinha and G. S. Kumar, Biophys. Chem., 2007, 125, 508–520 CrossRef CAS PubMed.
- M. M. Islam, S. R. Chowdhury and G. S. Kumar, J. Phys. Chem. B, 2009, 113, 1210–1224 CrossRef CAS PubMed.
- M. M. Islam, A. Basu and G. S. Kumar, MedChemComm, 2011, 2, 631–637 RSC.
- S. Arnott, P. J. Campbell-Smith and R. Chandrasekaran, Nucleic Acids, in Handbook of Biochemistry and Molecular Biology, ed. G. P. Fasman, CRC Press, Cleveland, 3rd edn, 1976, vol. II, pp. 411–422 Search PubMed.
- K. W. Kohn, M. J. Waring, D. Glaubiger and C. A. Friedman, Cancer Res., 1975, 35, 71–76 CAS.
- M. V. Minasyants, Proc. of the Yerevan State Univ. Chemistry and Biology, 2014, pp. 51–57 Search PubMed.
- K. Kalyanasundaram and J. K. Thomas, J. Am. Chem. Soc., 1977, 99, 2039–2044 CrossRef CAS.
- M. T. Record Jr, J.-H. Ha and M. Fisher, Methods Enzymol., 1991, 208, 291–343 CAS.
- J. B. Chaires, S. Satyanarayana, D. Suh, I. Fokt, T. Przewloka and W. Priebe, Biochemistry, 1996, 35, 2047–2053 CrossRef CAS PubMed.
- J. B. Chaires, Anti-Cancer Drug Des., 1996, 11, 569–580 CAS.
- P. Roy, A. K. Jana, S. Das and D. N. Nath, Chem. Phys. Lett., 2011, 516, 182–185 CrossRef CAS.
- B. Jana, S. Senapati, D. Ghosh, D. Bose and N. Chattopadhyay, J. Phys. Chem. B, 2012, 116, 639–645 CrossRef CAS PubMed.
- C. Reichardt, Solvatochromic Dyes as Solvent Polarity Indicators, Chem. Rev., 1994, 94, 2319–2358 CrossRef CAS.
- S. D. Bernal, T. J. Lampidis, I. C. Sum Merhayes and L. B. Chen, Science, 1982, 218, 1117–1119 CAS.
- M. M. Islam, M. Chakraborty, P. Pandya, A. A. Masum, N. Gupta and S. Mukhopadhyay, Dyes Pigm., 2013, 99, 412–422 CrossRef CAS.
- B. Nguyen, D. Hamelberg, C. Bailly, P. Colson, J. Stanek, R. Brun, S. Neidle and W. D. Wilson, Biophys. J., 2004, 86, 1028–1041 CrossRef CAS PubMed.
- M. A. Nazif, R. Rubbiani, H. Alborzinia, I. Kitanovic, S. Wolfl, I. Ott and W. S. Sheldrick, Dalton Trans., 2012, 41, 5587–5598 RSC.
Footnote |
| † Electronic supplementary information (ESI) available: Synthetic scheme. Detail of docking tables done by MOE. LigX plot of S1–S4 with 1–DNA complex. See DOI: 10.1039/c6ra20267e |
|
| This journal is © The Royal Society of Chemistry 2016 |
Click here to see how this site uses Cookies. View our privacy policy here. 

![[thin space (1/6-em)]](https://www.rsc.org/images/entities/char_2009.gif) 000
000![[thin space (1/6-em)]](https://www.rsc.org/images/entities/char_2009.gif) 391
391![[thin space (1/6-em)]](https://www.rsc.org/images/entities/char_2009.gif) 478
478![[thin space (1/6-em)]](https://www.rsc.org/images/entities/char_2009.gif) 602
602![[thin space (1/6-em)]](https://www.rsc.org/images/entities/char_2009.gif) 460
460
![[thin space (1/6-em)]](https://www.rsc.org/images/entities/char_2009.gif) K versus log[Na+] yields a straight line showing a decrease in binding constant with increasing salt concentration, i.e. the concentration of [Na+] (Fig. 3a). The slope (ZΨ) of the curve is actually 0.438 which indicates the number of ions released which is in good agreement with that reported data for mono cationic molecules binding to double stranded DNAs and RNAs.16,19 The observed free energy can be partitioned between two contributions, namely the non-polyelectrolytic contribution (ΔGt) and the polyelectrolytic contribution (ΔGpe)27,28 using following equation:
K versus log[Na+] yields a straight line showing a decrease in binding constant with increasing salt concentration, i.e. the concentration of [Na+] (Fig. 3a). The slope (ZΨ) of the curve is actually 0.438 which indicates the number of ions released which is in good agreement with that reported data for mono cationic molecules binding to double stranded DNAs and RNAs.16,19 The observed free energy can be partitioned between two contributions, namely the non-polyelectrolytic contribution (ΔGt) and the polyelectrolytic contribution (ΔGpe)27,28 using following equation:![[thin space (1/6-em)]](https://www.rsc.org/images/entities/char_2009.gif) ln
ln![[thin space (1/6-em)]](https://www.rsc.org/images/entities/char_2009.gif) K = ΔGt + ΔGpe
K = ΔGt + ΔGpe

![[thin space (1/6-em)]](https://www.rsc.org/images/entities/char_2009.gif) K vs. log[Na+] plot. (b) The solid parts and hatched parts indicate the nonpolyelectrolytic (ΔGt) and the polyelectrolytic (ΔGpe) contribution respectively to the binding free energy.
K vs. log[Na+] plot. (b) The solid parts and hatched parts indicate the nonpolyelectrolytic (ΔGt) and the polyelectrolytic (ΔGpe) contribution respectively to the binding free energy.![[thin space (1/6-em)]](https://www.rsc.org/images/entities/char_2009.gif) ln[MX], where MX is the monovalent salt concentration. The magnitude of ΔGpe is the free energy contribution arising from coupled polyelectrolytic forces particularly that from the release of condensed counter ions from the DNA helix upon binding of charged ligands. The free energy of binding of 1 to the DNA and the polyelectrolytic and the non-polyelectrolytic contribution to the same have been calculated and presented in Table 2.
ln[MX], where MX is the monovalent salt concentration. The magnitude of ΔGpe is the free energy contribution arising from coupled polyelectrolytic forces particularly that from the release of condensed counter ions from the DNA helix upon binding of charged ligands. The free energy of binding of 1 to the DNA and the polyelectrolytic and the non-polyelectrolytic contribution to the same have been calculated and presented in Table 2.


