 Open Access Article
Optical absorption and electronic spectra of chlorophylls a and b†‡
Leila
Hedayatifar§
a,
Elnaz
Irani§
a,
Mahmood
Mazarei§
a,
Soroush
Rasti§
a,
Yavar T.
Azar§
b,
Ali T.
Rezakhani
a,
Alireza
Mashaghi
*c,
Farzaneh
Shayeganfar
d,
Mehrnaz
Anvari
e,
Tiam
Heydari
a,
Ali Rahimi
Tabar
f,
Nasser
Nafari
a,
Mohammad Ali
Vesaghi
a,
Reza
Asgari
g and
Mohammad Reza
Rahimi Tabar
a
aDepartment of Physics, Sharif University of Technology, Tehran 14588, Iran
bTheoretical and Computational Physics Group, School of Physics and Accelerators, AEOI, P. O. Box 14395-836, Tehran, Iran
cDivision of Analytical Biosciences & Systems Pharmacology Cluster, Leiden Academic Centre for Drug Research, Faculty of Mathematics and Natural Sciences, Leiden University, Leiden, The Netherlands. E-mail: a.mashaghi.tabari@lacdr.leidenuniv.nl
dDepartment of Civil and Environmental Engineering, Rice University, Houston, TX 77005, USA
eInstitute of Physics and ForWind, Carl von Ossietzky University, 26111 Oldenburg, Germany
fGymnasium Eversten Oldenburg, 26129 Oldenburg, Germany
gSchool of Physics, Institute for Research in Fundamental Sciences (IPM), P. O. Box 19395-5531, Tehran, Iran
First published on 17th November 2016
Abstract
Photosynthesis includes capturing sunlight by an assembly of molecules, called chlorophylls, and directing the harvested energy in the form of electronic excitations to the reaction center. Here we report, using real-space density functional theory and time-dependent density functional theory together with GW calculations, the optical and electronic properties of the two main chlorophylls in green plants, namely, chlorophylls a and b. Furthermore, we estimate the dipole and primitive quadrupole electric moments of these molecules. We employ Casida's assignment ansatz to study the absorption spectra of the chlorophylls in the two main red and blue regions at various environments with different exchange–correlation functionals. In addition, we obtain the band gap of chlorophylls a and b, which are all in remarkable agreement with experimental observations.
I. Introduction
Recently there has been a surge of interest in research on renewable (clean) energy sources to replace environment-unfriendly sources. For millions of years, green plants have obtained their required energy from the Sun through a complex network of chemical and physical reactions in their leaves, within cellular compartments known as chloroplasts. In this process, the incident photons are absorbed by two complex molecular systems, namely, photosystem I (PSI) and photosystem II (PSII), both associated with thylakoid membranes of chloroplasts. The absorbed energy is transported over a large distance from the light-harvesting parts to the reaction center, where energy is stored in the form of chemical energy. Inspired by photosynthesis in plants, many researchers have tried to engineer solar fuel generators that use sunlight, water, and carbon dioxide to work—see, e.g., ref. 1–4 and the references therein.PSI and PSII are complex supermolecular structures composed of various proteins and molecules, such as chlorophylls a and b (Chl a and Chl b) and carotenoids, which have various roles and interactions. These interactions have significant effects on the conformation, electronic structures, and vibrational dynamics of each component.5,6 Recent progress in two-dimensional molecular imaging by coherent Raman spectroscopy and structural biology has enabled imaging the structure and functioning of photosystems with an unprecedented sub-nanometer resolution.7–10 Yet, there remain numerous relevant questions in quantum level to address.11
It has been known that chlorophylls in photosystems harvest incident photons with special wavelengths and transfer their energy—as “excitons”—to the reaction centers with ultrafast quantum coherent and incoherent energy transfer mechanisms.12 Each chlorophyll has a porphyrin ring (head group) and a hydrophobic tail, which retains it in the thylakoid wall. This ring, with a magnesium atom in its center and four nitrogen atoms surrounding it, is responsible for harvesting photons and transferring the energy. Diversity of chlorophylls in the nature is limited and depends on the side chains attached to the porphyrin ring. Chl a and Chl b with chemical formulas C55H72MgN4O5 and C55H70MgN4O6 consist of 137 and 136 atoms, respectively. Note that the only difference between Chl a and Chl b is that the methyl group on the side chains of Chl a is replaced with an aldehyde group in Chl b. Spectral and kinetic properties of these molecules have been addressed in various experimental13,14 and theoretical studies.15–32
Since the reduction of the system size causes a decrease of the screening and enhancement of the Coulomb interaction between charge carriers, the excited states are no longer negligible in nanostructures, and thus the single particle Kohn–Sham (KS) density functional theory (DFT) is not reliable to study the electronic and optical properties of these systems. Accordingly, we need to incorporate many-body interactions in our treatment to go beyond the standard DFT and bear the cost of heavier calculations. In addition, owing to the inherent complexity of large systems and the associated computational costs, conducting full quantum mechanical simulations on the whole system may be infeasible. This complexity is even more problematic for polyatomic molecules because of the difficulty of explaining the dissociation mechanism and controlling molecular processes. First-principles simulations based on the DFT, time-dependent density functional theory (TD-DFT) and single-shot GW method33,34 calculations, which provide the electron density profile and electronic and optical properties, are the most commonly used computational approach to study large molecular systems. This approach offers in silico description of molecular processes in a quantitatively reliable manner at reasonable computational cost (sufficiently low to be able) to treat realistic systems.15 It has been known that the deviation of m/m0 ratio from 1 is a reasonable criterion for relativistic effect, and that the elements of the first three periods of the periodic table show the ratio changes of less than 1%.35 Noting that all consisting atoms of the chlorophyll(s), especially the central metal Mg, belong to these three periods, negligible relativistic effects for these molecules are expectable.
Recently several groups have employed DFT and TD-DFT simulations to extract ground-state and excited-state properties of the chlorophylls.15–25 Some properties such as bond lengths, vertical excitations, energies, molecular orbitals, and fluorescence lifetimes, as well as absorption spectra have been investigated and compare with experimental results. Since the chlorophyll tail has little impact on the electronic properties, it was removed in some studies to reduce computational costs.17,18
Here, we employ DFT and TD-DFT, together with GW calculations (including many-body effects), to investigate the molecular structure, optical properties, charge density profile, electronic excitations, electric dipole and quadrupole moments, and electrochemical properties of Chl a and Chl b, and compare our findings with known experimental and theoretical results. For a proper analysis of the ground-state electronic properties, the exchange–correlation (XC) potential and KS potential are presented. Furthermore, the calculations of quasiparticle energies and band gap are obtained with high accuracy by using GW calculations. We have also studied the absorption spectra in the two main red and blue absorption regions at various environments, based on Casida's assignment ansatz, using B3LYP, CAM-B3LYP, and PBE0 hybrid functionals.36–38 We show that in the case of isolated molecules, transitions with higher oscillator strengths have small charge-transfer character owing to the non-negligible role of the pigment–pigment interactions for a realistic description of the photosystems.
This paper is organized as follows. In Section II, we provide the details of the computational techniques for DFT, TD-DFT, and GW calculations. Section III is devoted to the results and discussions. The paper is summarized in Section IV.
II. Computational techniques
We carry out first-principles simulations based on DFT. The ground-state and excited-state electronic properties of Chl a and Chl b are explored by solving the KS equations using different basis sets and configuration approaches. Initial coordinates of the molecules are obtained from the protein data bank (“PDB”) archive.32 At first we use the SIESTA package, which is based on the locality of Wannier-like wave functions for electrons.39,40 Using this package enables investigating electronic properties of large systems, such as phospholipids and graphene, whose results have exhibited fair agreement with experimental measurements.41–43In order to achieve the ground-state or minimum energy by using the SIESTA package, we allow the structure to relax by using the conjugate gradient algorithm, until the maximum force applied on any atom attain the threshold of 0.01 eV Å−1. A unit cell with adequately larger dimensions of 47 × 27 × 47 Å is considered. To calculate the electron density in the space of the cellular, the mesh cutoff is set to 500 Ry, which is equivalent to 640 × 384 × 640 points in the real-space mesh. The size of the unit cell and the mesh cutoff are chosen such that the energy or the dipole moment converge to a relatively constant value. The “projector augmented wave” method along with the Perdew–Burke–Ernzerhof (PBE)38 form of the XC functional are adopted for the calculation of the XC energy. The geometrical optimization is performed according to the force and stress (see ESI, Appendix A‡), and it is satisfied when all components of all forces are less than 10−3 eV Å−1.
In order to clearly keep track of the accuracy of the methods and analysis of the electronic and optical properties, we consider the isolated configuration approach with real-space grids and atomic orbitals by using the Octopus and GAMESS packages.44,45 In the Octopus code, a numerical grid in the three-dimensional real space is introduced by spheres with the radius of 6 a.u. and Δr = 0.1 a.u., generated around each atom. The XC potential with the B3LYP functional is employed to investigate the electronic structure of Chl a and Chl b with high accuracy. We consider around 50 excited electronic states in our analysis.
For the representation of the band gap by solving the Dyson equation, we use the Octopus package in conjunction with BerkeleyGW.46 In the GW calculations, to initiate the mean-field calculation, we carry out DFT by using the Octopus package. The dielectric response functions are obtained within the “random phase approximation”, and the matrix elements of the self-energy operator are evaluated by using a 24 Ry cutoff and 90 unoccupied orbitals with the BerkeleyGW code. These conditions result in the quasiparticle energy gaps converged within ≈0.1 eV. We also perform the linear response TD-DFT calculations with the 6-31G* level of the theory using the hybrid B3LYP, PBE0, and CAM-B3LYP XC functionals with the GAMESS (US) package. The nonequilibrium version of the polarizable conductor calculation model (C-PCM)47 is employed to include solvent polarization effects. Note that in this version of the calculation of the vertical excitation energies, only the electronic response of the solvent is considered, in which the solvent atoms are assumed to be frozen.48 We have repeated our UV-Vis spectra calculations by employing bigger basis sets (including polarization and diffusion, 6-31+G** and 6-31++G**) for both chlorophylls. Considering negligible variations in the calculated positions of the peaks and for a fair balance between accuracy and computational cost, we have used 6-31+G* in our calculations.
To stimulate the adsorption spectra, the resulting oscillator strengths in each case are convoluted by Gaussian functions with an appropriate full width at half maximum Δ1/2, as49
 | (1) |
III. Results and discussion
The structures of Chl a and Chl b have been geometrically optimized at the PBE/DPZ—PBE together with a double-ζ plus polarization function (DZP) basis set—level, and the bond lengths in the relaxed molecules appeared to be in good agreement with results of crystallographic analyses.50,51 The electronic properties of the relaxed chlorophylls have been computed for two configurations, and the numerical results are summarized in Table 1.| Chl a (PBE/DPZ) SIESTA | Chl b (PBE/DPZ) SIESTA | Chl a (real-space grid) Octopus | Chl b (real-space grid) Octopus | Chl a (B3-LYP/6-31G*) GAMESS | Chl b (B3-LYP/6-31G*) GAMESS | Chl a (GW) BerkeleyGW | Chl b (GW) BerkeleyGW | Chl a (Exp.a) | Chl b (Exp.) | |
|---|---|---|---|---|---|---|---|---|---|---|
| a Experimental. b Vacuum. c Solvent. d Trace of the primitive quadrupole tensor (ESI, Appendix B). | ||||||||||
| Ionization potential (eV) | 4.19 | 4.45 | 4.96 | 5.22 | 4.79 (vb) | 5.17 (v) | 4.96 | 5.22 | 6.10 (ref. 14 and 65–67) | 5.16 (ref. 68) |
| 4.96 (sc) | 5.15 (s) | 4.93 (ref. 68) | ||||||||
| Electron affinity | 2.64 | 2.79 | 3.30 | 3.38 | 2.48 (v) | 2.66 (v) | 3.09 | 3.32 | 2.96 (ref. 68) | 3.13 (ref. 68) |
| 2.63 (s) | 2.64 (s) | |||||||||
| KS band gap (eV) | 1.55 | 1.66 | 1.66 | 1.84 | 2.31 (v) | 2.51 (v) | 1.86 | 1.90 | 1.87–1.92 (ref. 14 and 55–58) | 1.90–1.92 (ref. 55–57 and 59) |
| 2.33 (s) | 2.51 (s) | |||||||||
| Dipole (D) | 4.79 | 1.36 | 4.92 | 1.14 | 6.49 (v) | 2.73 (v) | ||||
| 11.19 (s) | 4.23 (s) | |||||||||
| Tr[Q]d (ea02) | 191.50 | 135.46 | 222.44 | 228.54 | 288.20 | 296.40 | ||||
| Electronegativity | 3.41 | 3.62 | 4.13 | 4.30 | 3.63 (v) | 3.91 (v) | 4.03 | 4.27 | ||
| 3.79 (s) | 3.89 (s) | |||||||||
The KS band gap has been obtained 1.55 eV and 1.66 eV with the PBE/DPZ level, 1.66 eV and 1.84 eV with real-space grid, 2.31 and 2.50 eV with B3LYP/6-31G* level for Chl a and Chl b, respectively. We note that the hybrid XC functionals such as B3LYP and PBE0 overestimate the band gap.52 Moreover, within the GW calculations the band gap is obtained to be 1.86 eV and 1.90 eV, respectively, for Chl a and Chl b, which are in remarkable agreement with experimental results; this is one of the main results of our paper. In fact, the experimental value of the band gap is in the range of 1.87–1.92 eV for Chl a and 1.90–1.92 eV for Chl b.14,53–57 For Chl a and Chl b, the ionization potentials are determined to be 4.19 eV and 4.45 eV in the PBE/DPZ level; however, it is obtained 4.96 and 5.22 by using the Octopus code, as well as 4.79 and 5.17 by applying the B3LYP/6-31G* hybrid functionals.
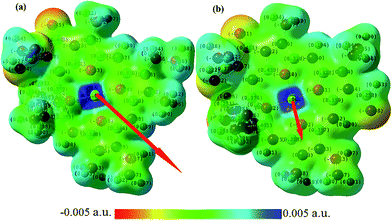
Furthermore, we also calculate the electric dipole and quadrupole moments—two important factors in the inter-molecular interactions and energy transfer. Our obtained dipole moment of Chl a (4.79 D) is larger than that of Chl b (1.36 D). For the B3LYP/6-31G* level and grid basis set, the dipole moment is obtained to be 6.49 D, 2.73 D and 4.92 D, 1.14 D, respectively, for Chl a and Chl b. Note that the dipole moment of a water molecule is about 1.85–2.6 D,58 whereas the reported value using the cavity model for the dipole moment of Chl a is about 4.6 D.59,60 The orientation of the electric dipole moment of Chl a and Chl b and partial charge distributions are shown in Fig. 1.
The calculated primitive quadrupole tensor for the chlorophylls with respect to their center of mass is presented in ESI, Appendix B.‡ In agreement with the results of ref. 61, the obtained magnetic dipole moments of these molecules are negligible because of the symmetry between the charge densities of the spin-up and spin-down sub-bands.
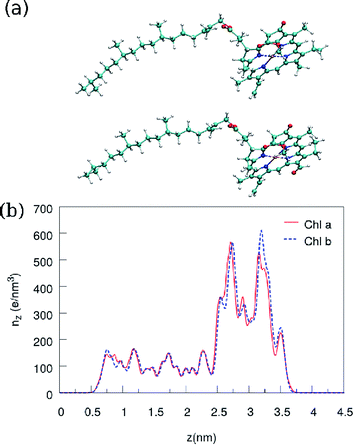
Fig. 2 shows the charge density profile along the long axis, the z direction of Chl a and Chl b. The charge density is averaged over a disc with the slight thickness of 0.073 Å and the obtained charge density in the ring is about 2–3 times greater than its value in the tail of the chlorophylls. The calculated charge density is in remarkable agreement with the result obtained in ref. 19, where DFT with the B3LYP/TZVP basis sets has been employed for calculations.
Each excitation of a system could be described as a combination of transitions between the occupied and unoccupied single-particle KS orbitals. Because of this, we only calculate the frontier molecular orbitals (and the results are depicted in ESI Fig. 1‡). Similar results are obtained also for Chl b. The frontier orbitals (HOMOs and LUMOs) in the chlorophylls are mainly distributed over the chlorine ring, whereas the hydrocarbon tail has no significant contribution to these orbitals. Consequently, as expected the hydrocarbon chain part of the molecule has no considerable optical activity.
As shown in Fig. 1, the direction of the arrow shows the electric dipole-moment orientation of the chlorophylls. This should give a good insight into the optimized molecular alignment by an external field. The oxygen and nitrogen atoms with higher electronegativity have higher net charge and thus the area around them have more negative potential. More interestingly, the red and blue parts specify, respectively, electron-rich and electron-deficient regions of the molecules. This can help predict the possible electrostatic interaction of different parts of the molecule with the charged or polarized species in the chlorophyll environment. The transition dipole-moment orientations upon photo-excitation can display the energy transfer in the absorption process. The Förster resonance energy transfer mechanism can explain the energy transfer between pigments.62 This mechanism is based on electric dipole–dipole interactions between chromophores. Orientation of two chlorophylls and their center-to-center distance are the other main parameters in the rate of energy transfer. We have visualized the transition dipole moment for the excitations with a dominant contribution in the absorption spectra in Fig. 3.
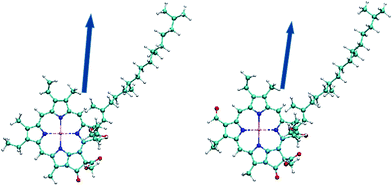 | ||
| Fig. 3 Dark blue arrows represent the orientation of transition dipole moments corresponding to S0 → S1 excitations for Chl a [right] and Chl b [left]. | ||
In general, a molecular electrostatic potential map yields useful, intuitive information about the charge distribution, charge related properties, and active sites of a molecule. Total potential and the contribution of the XC are calculated and projected onto a plane passing through the molecule as depicted in Fig. 4. Comparing the two contour plots indicates that the XC potential has a dominant contribution far from the nuclei. In the vicinity of the atomic centers, the VXC/VT ratio is about 0.25, where VT denotes the total potential. On the other hand, VT is averaged and plotted over the xy plane before and after excluding the XC contribution. Comparing the two averaged potentials indicates that a significant contribution of the XC in the averaged potential belongs again to the head. We find also similar potential profile for Chl b as shown for Chl a in Fig. 4.
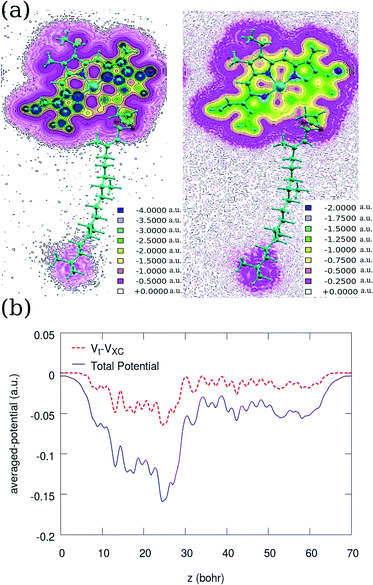 | ||
| Fig. 4 Contour plots of (a) the normalised total potential [right] and the XC potential [left] of Chl a. (b) A comparison between the averaged total (solid line) and XC-excluded potential (dashed) along the z direction (in atomic units). The direction of the z axis is similar to Fig. 2, where the tail starts from z ≃ 0. Inspecting these two plots indicates that the VXC/VT ratio increases with distance from atomic centers. | ||
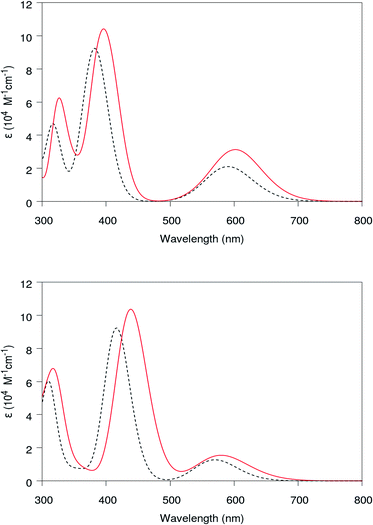
Now let us summarize our findings about the absorption spectra of the chlorophylls in the two main red and blue regions at various environments with different XC functionals. We calculate the strengths within the TD-DFT framework according to Casida's assignment ansatz37 and by using the lowest 40 excitation energies and their corresponding oscillator. By convoluting them at Δ = 0.37 eV, the absorption spectra of the chlorophylls can be obtained in a vacuum and a solvent environment. According to ref. 27 and 63, the extraction of chlorophyll is usually achieved by 95% ethanol or 80% acetone solvents. Thus we employ the PCM solvent model64 to compare our results with experiment. It should be mentioned that on the PCM solvent model, polarization effects mainly depend on macroscopic dielectric constant (and not on the molecular structure of the solvent). Comparing results obtained from vacuum with ethanol (ε = 24.55) yields a reliable prospect about environment polarization effects on the absorption spectra, which can be generalized to other solvents with similar dielectric constants. The obtained absorption spectra are shown in Fig. 5.
The calculated position of the first peak is about 1.85 (1.91) eV for Chl a (Chl b), which agrees well with existing experimental data.14 The first and seventh singlet excitations (S1) and (S7) have a dominant contribution to these peaks and determination of the character of the excitation in the red and blue regions. According to our numerical results, for these two excitations, the HOMO → LUMO transition has dominant contribution (84%) in the first excitation S1, where the 7th excitation mainly (72%) originated from HOMO−1 → LUMO+1 molecular orbitals. As shown in Fig. 5, including the solvent (ethanol) in the PCM framework leads to the red shift for both peaks of the absorption spectra. The media polarization effects on the absorption spectra (solvatochromic effect) are studied by introducing a nonequilibrium C-PCM model in the TD-DFT calculations.1,50 Taking into account the solvent polarization in our TD-DFT calculations yields a small red shift in both calculated Chl a and Chl b spectra. Considering direct relation between the solvent reaction field and solute dipole moment, these relatively small solvatochromic shifts may be interpreted as a result of small electric dipole moments for these chlorophylls. Additionally, our calculations show similar absorption spectra for both chlorophylls with a small blue shift in the position of the first peak for Chl b with respect to that of Chl a, which is necessary for the effective energy transfer from Chl b to Chl a.
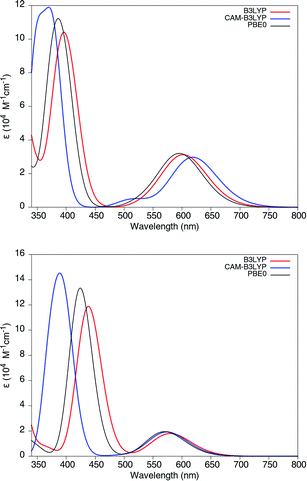
We remark that all TD-DFT calculations have been performed by using the standard B3LYP hybrid functional, range-separated CAM-B3LYP, and PBE0. As shown in Fig. 6, there is a relatively good agreement between the adsorption spectra obtained from these functionals, which can be explained by the localized character of the lowest excitations in Chl a and Chl b. We note that ref. 65 has explained a close relation between the charge transfer character of the excitations and excitation energy errors obtained from different functionals, and the diagnostic parameter λ has been introduced there to quantify the charge transfer character of the excitations: the values 0 < λ < 1, where 0 indicates complete charge transfer and 1 indicates the localized character of the excitation. In addition, a better prediction of the charge transfer excitation (with small λ) has been reported in this reference by using range-separated functionals. Bearing this understanding in mind, similar adsorption spectra in our work may be concluded as a direct result of the local excitation of these molecules because here λ ≈ 0.77, which can be obtained from the isodensity plot of the frontier orbitals and the charge transfer isodensity.
Finally, to gain more accurate insight into the charge-separation (electron–hole) formation through the above excitations, we have characterized the electron density difference map (EDDMs) in ESI Fig. 1.‡ This figure shows the addition (red) and depletion (gray) regions of the electron charge density in the S1 (left side) and S7 excitations (right side) for Chl a. A negligible charge transfer character of these excitations is evident from the significant overlap between the above regions. It is seen that in the case of isolated molecules, transitions with higher oscillator strengths have small charge-transfer character. This result is in contrast with our knowledge about the photosynthesis mechanism. This finding emphasizes the non-negligible role of pigment–pigment interactions for a realistic description of the photosystems. Similar localized excited states are observed for Chl b too through charge difference calculations.
IV. Summary
We have aimed at obtaining the electronic structure and electronic excitations of chlorophylls (Chl) a and b by using extensive first-principles density functional theory (DFT) and time-dependent DFT (TD-DFT) calculations. We have determined that there is no significant charge transfer for the excitation in the visible region of the absorption spectrum, which implies a small electron–hole separation radius in the isolated chlorophylls. The calculations of the first excitation energy and the band gap optimized and augmented by the GW approximation have shown good agreement with the available experimental data. We have also analyzed the role of different environments and the effect of different exchange–correlation functionals of B3LYP, CAM-B3LYP, and PBE0 in the excitation energy transfer and the absorption spectra. The calculated position of the first peak by using TD-DFT—1.85 eV (1.91 eV) for Chl a (Chl b)—also agree remarkably with the existing experimental data. Additionally, we have concluded that the XC energy has a significant contribution to the total potential around the head of the chlorophylls.Acknowledgements
This work was partially supported by Sharif University of Technology's Office of Vice President for Research under Grant No. G930209. Alireza Mashaghi thanks Leiden Academic Centre for Drug Research and the Faculty of Mathematics and Natural Sciences, Leiden University, for financial support.References
- K. J. Young, L. A. Martini, R. L. Milot, R. C. Snoeberger, V. S. Batista, C. A. Schmuttenmaer, R. H. Crabtree and G. W. Brudvig, Coord. Chem. Rev., 2012, 256, 2503–2520 CrossRef CAS PubMed.
- H. Chang and H. Wu, Energy Environ. Sci., 2013, 6, 3483–3507 CAS.
- L.-L. Li and E. W.-G. Diau, Chem. Soc. Rev., 2013, 42, 291–304 RSC.
- J. R. McKone, N. S. Lewis and H. B. Gray, Chem. Mater., 2014, 26, 407–414 CrossRef CAS.
- R. Grondelle, J. P. Dekker, T. Gillbro and V. Sundstrom, Biochim. Biophys. Acta, 1994, 1187, 1–98 CrossRef CAS.
- C. Konig and J. Neugebauer, Phys. Chem. Chem. Phys., 2011, 13, 10475–10490 RSC.
- N. Nathan and F. Yocum Charles, Annu. Rev. Plant Biol., 2006, 57, 521–565 CrossRef PubMed.
- A. Alexey, D. Omri and N. Nathan, Nature, 2007, 447, 58–63 CrossRef PubMed.
- Y. Umena, K. Kawakami, J. R. Shen and N. Kamiya, Nature, 2011, 473, 55–60 CrossRef CAS PubMed.
- C. Kupitz, et al. , Nature, 2014, 513, 261–265 CrossRef CAS PubMed.
- T. van Mourik, M. Bühl and M.-P. Gaigeot, Philos. Trans. R. Soc., A, 2014, 372, 20120488 CrossRef PubMed.
- R. Hildner, D. Brinks, J. B. Nieder, R. J. Cogdell and N. F. van Hulst, Science, 2013, 340, 1448–1451 CrossRef CAS PubMed.
- L. O. Björn, G. C. Papageorgiou, R. E. Blankenship and A. Govindjee, Photosynth. Res., 2009, 99, 85–92 CrossRef PubMed.
- N. Shafizadeh, M. H. Ha-Thi, B. Soep, M. Gaveau, F. Piuzzi and C. Pothier, J. Chem. Phys., 2011, 135, 114303 CrossRef CAS PubMed.
- H. Hubener and F. Giustino, Phys. Rev. B: Condens. Matter Mater. Phys., 2014, 89, 085129 CrossRef.
- A. B. J. Parusel and S. Grimme, J. Phys. Chem. B, 2000, 104, 5395–5403 CrossRef CAS.
- K. Karki and D. Roccatano, J. Chem. Theory Comput., 2001, 7, 1131–1135 CrossRef PubMed.
- Z.-L. Cai, M. J. Crossley, J. R. Reimers, R. Kobayashi and R. D. Amos, J. Phys. Chem. B, 2006, 110, 15624–15632 CrossRef CAS PubMed.
- M. Etinski, M. Petković and M. M. Ristić, J. Serb. Chem. Soc., 2013, 78, 1775–1787 CrossRef CAS.
- A. Pandey and S. N. Datta, J. Phys. Chem. B, 2005, 109, 9066–9072 CrossRef CAS PubMed.
- S. Parameswaran, R. Wang and G. Hastings, J. Phys. Chem. B, 2006, 112, 14056–14062 CrossRef PubMed.
- S. Sinnecker, W. Koch and W. Lubitz, J. Phys. Chem. B, 2002, 106, 5281–5288 CrossRef CAS.
- R. Wang, S. Parameswaran and G. Hastings, Vib. Spectrosc., 2007, 44, 357–368 CrossRef CAS.
- J. Linnanto and J. Korppi-Tommola, Phys. Chem. Chem. Phys., 2000, 2, 4962–4970 RSC.
- A. Marchanka, W. Lubitz and M. Gastel, J. Phys. Chem. B, 2009, 113, 6917–6927 CrossRef CAS PubMed.
- D. Sundholm, Chem. Phys. Lett., 1999, 302, 480–484 CrossRef CAS.
- X. Hu, A. Tanaka and R. Tanaka, Plant Methods, 2013, 9, 19 CrossRef CAS PubMed.
- P. N. Ciesielski, C. J. Faullkner, M. T. Irwin, J. M. Gregory, N. H. Tolk, D. E. Cliffel and G. K. Jennings, Adv. Funct. Mater., 2010, 20, 4048–4054 CrossRef CAS.
- M. Marques, M. I. McMahon, E. Gregoryanz, M. Hanfland, C. L. Guillaume, C. J. Pickard, G. J. Ackland and R. J. Nelmes, Phys. Rev. Lett., 2011, 106, 095502 CrossRef CAS PubMed.
- K. N. Ferreira, T. M. Iverson, K. Maghlaoui, J. Barber and S. Iwata, Science, 2004, 303, 19 CrossRef PubMed.
- M. Alberto, T. Marino, N. Russo, E. Sicilia and M. Toscano, Phys. Chem. Chem. Phys., 2012, 14, 14943–14953 RSC.
- H. M. Berman, J. Westbrook, Z. Feng, G. Gilliland, T. N. Bhat, H. Weissig, I. N. Shindyalov and P. E. Bourne, Nucleic Acids Res., 2000, 28, 235–245 CrossRef CAS PubMed.
- M. S. Hybertsen and S. G. Louie, Phys. Rev. B: Condens. Matter Mater. Phys., 1986, 34, 5390–5413 CrossRef CAS.
- R. W. Godby, M. Schlüter and L. J. Sham, Phys. Rev. B: Condens. Matter Mater. Phys., 1988, 37, 10159 CrossRef CAS; M. van Schilfgaarde, T. Kotani and S. Faleev, Phys. Rev. Lett., 2006, 96, 226402 CrossRef PubMed; F. Bruneval and M. Gatti, Top. Curr. Chem., 2014, 347, 99–135 CrossRef PubMed.
- M. Barysz, Relativistic Methods for Chemists, Springer, 2010, ch. 2 Search PubMed.
- T. Yanai, D. P. Tew and N. C. Handy, Chem. Phys. Lett., 2004, 393, 51–57 CrossRef CAS.
- M. E. Casida, Recent Advances in Density Functional Methods (Part I), ed. D. P. Chong, World Scientific, Singapore, 1995 Search PubMed.
- J. P. Perdew, K. Burke and M. Enzerhof, Phys. Rev. Lett., 1996, 77, 3865–3868 CrossRef CAS PubMed.
- J. Kim, F. Mauri and G. Galli, Phys. Rev. B: Condens. Matter Mater. Phys., 1995, 52, 1640–1648 CrossRef CAS.
- P. Ordejon, D. A. Drabold, R. M. Martin and M. P. Grumbach, Phys. Rev. B: Condens. Matter Mater. Phys., 1995, 51, 1456 CrossRef CAS.
- A. Mashaghi, P. Partovi-Azar, T. Jadidi, N. Nafari, K. Esfarjani, P. Maass, M. R. Rahimi Tabar, H. J. Bakker and M. Bonn, J. Phys. Chem. B, 2012, 116, 6455–6460 CrossRef CAS PubMed.
- A. Mashaghi, P. Partovi-Azar, T. Jadidi, N. Nafari, P. Maass, M. R. Rahimi Tabar, M. Bonn and H. J. Bakker, J. Chem. Phys., 2012, 136, 114709 CrossRef PubMed.
- P. Partovi-Azar, N. Nafari and M. R. Rahimi Tabar, Phys. Rev. B: Condens. Matter Mater. Phys., 2011, 83, 165434–165439 CrossRef.
- A. Castro, M. A. L. Marques, H. Appel, M. Oliveira, C. A. Rozzi, X. Andrade, F. Lorenzen, E. K. U. Gross and A. Rubio, Phys. Status Solidi B, 2006, 243, 2465–2488 CrossRef CAS.
- M. Cossi and M. Barone, J. Chem. Phys., 2001, 115, 4708–4717 CrossRef CAS.
- J. Deslippe, G. Samsonidze, D. A. Strubbe, M. Jain, M. L. Cohen and S. G. Louie, Comput. Phys. Commun., 2012, 183, 1269–1289 CrossRef CAS.
- V. Barone and M. Cossi, J. Phys. Chem. A, 1998, 102, 1995–2001 CrossRef CAS.
- A. V. Marenich, C. J. Cramer, D. G. Truhlar, C. A. Guido, B. Mennucci, G. Scalmani and M. J. Frisch, Chem. Sci., 2011, 2, 2143–2163 RSC.
- A. Serr and N. O'Boyle, Convoluting UV-Vis Spectra Using Oscillator Strengths, http://gausssum.sourceforge.net/GaussSum_UVVis_Convolution.pdf.
- C. Adamo and D. Jacquemin, Chem. Soc. Rev., 2013, 42, 845 RSC.
- H. Chow, R. Serlin and C. E. Strouse, J. Am. Chem. Soc., 1975, 97, 1230–1234 CrossRef.
- M. Jain, M. Chelikowsky and S. G. Louie, Phys. Rev. Lett., 2011, 107, 216806 CrossRef PubMed.
- G. Zhang and C. B. Musgrave, J. Phys. Chem. A, 2007, 111, 1554–1561 CrossRef CAS PubMed.
- R. Serlin, H.-C. Chow and C. E. Strouse, J. Am. Chem. Soc., 1975, 97, 7237–7242 CrossRef CAS.
- M. Bazzaz, Photobiochem. Photobiophys., 1981, 2, 199–207 CAS.
- V. P. Shedbalkar and C. A. Rebeiz, Anal. Biochem., 1992, 207, 261–266 CrossRef CAS PubMed.
- B. Grimm, R. J. Porra, W. Rüdiger, and H. Scheer, Chlorophylls and Bacteriochlorophylls - Biochemistry, Biophysics, Functions and Applications, Springer, Dordrecht, 2006 Search PubMed.
- L. L. Thomas, J. H. Kim and T. M. Cotton, J. Am. Chem. Soc., 1990, 112, 9378–9386 CrossRef CAS.
- J. W. Springer, K. M. Faries, J. R. Diers, C. Muthiah, O. Mass, H. L. Kee, C. Kirmaier, J. S. Lindsey, D. F. Bocian and D. Holten, Photochem. Photobiol., 2012, 88, 651–674 CrossRef CAS PubMed.
- S. A. Clough, Y. Beers, G. P. Klein and L. S. Rothman, J. Chem. Phys., 1973, 59, 2254–2259 CrossRef CAS; C. A. Coulson and D. Eisenberg, Proc. R. Soc. London, Ser. A, 1966, 291, 445–453 CrossRef; P. L. Silvestrelli and M. Parrinello, Phys. Rev. Lett., 1999, 82, 3308–3311 CrossRef.
- D. Carbonera, Photosynth. Res., 2009, 102, 403–414 CrossRef CAS PubMed.
- V. G. Kozlov, V. Bulovic, P. E. Burrows and S. R. Forrest, Nature, 1997, 389, 362–364 CrossRef CAS.
- S. Su, Y. Zhou, J. G. Qin, W. Yao and Z. Ma, J. Freshwater Ecol., 2010, 25, 599–606 CrossRef.
- J. Tomasi, B. Mennucci and R. Cammi, Chem. Rev., 2005, 105(8), 2999–3094 CrossRef CAS PubMed.
- K. Hasegawa and T. Noguchi, Biochemistry, 2005, 44, 8865–8872 CrossRef CAS PubMed.
- Y. Nakato, T. Chiyoda and H. Tsubomura, Bull. Chem. Soc. Jpn., 1974, 47, 3001 CrossRef CAS.
- M. R. A. Blomberg, P. E. M. Siegbahn and G. T. Babcock, J. Am. Chem. Soc., 1998, 120, 8812–8824 CrossRef CAS.
- W. Arnold and J. R. Azzi, Proc. Natl. Acad. Sci. U. S. A., 1968, 61, 29–38 CrossRef CAS.
Footnotes |
| † PACS numbers: 78.40.Fy, 71.35.Pq, 31.15.A-. |
| ‡ Electronic supplementary information (ESI) available. See DOI: 10.1039/c6ra20226h |
| § These authors contributed equally to this work. |
| This journal is © The Royal Society of Chemistry 2016 |

