F. Y. Adeowo,
B. Honarparvar* and
A. A. Skelton*
School of Health Sciences, School of Pharmacy and Pharmacology, Discipline of Pharmacy, University of KwaZulu-Natal, Durban 4001, South Africa. E-mail: skelton@ukzn.ac.za; honarparvar@ukzn.ac.za; Tel: +27 31 2608520 Tel: +27 31 26084
First published on 15th August 2016
1,4,7-Triazacyclononane-1,4,7-triacetic acid (NOTA) is a key chelator for radiolabelling pharmaceuticals. The ability of alkali metals in the human body to complex with NOTA and compete with radiometals can influence the radiolabelling process. The focus of the present work is to evaluate the NOTA–alkali metal complexation with density functional theory (B3LYP functional) using the 6-311+G(2d,2p) basis set for Li+, Na+ and K+ and Def2-TZVPD for Rb+. Two NOTA–ion conformations are reported in the study: ‘A’ where six NOTA hetero atoms (N, O) are in close proximity to the cation, and ‘B’, where four NOTA hetero-atoms interact with the cation. Interaction and relaxation energies, Gibbs free energies and entropies show that the stability of NOTA–ion complexes decreases down the group of the periodic table. Implicit water solvation affects the NOTA–ion complexation, causing a decrease in the stability of the system. NBO analysis performed through the natural atomic charges (NAC) and second order perturbation analysis reveals charge transfer between NOTA and alkali metals. The theoretical 1H NMR chemical shifts of NOTA, in vacuum and water media, are in good agreement with experiments, these values being influenced by the presence of the ions, which have a deshielding effect on the protons of NOTA. Global scalar properties, such as HOMO/LUMO energies, ΔELUMO–HOMO gap, and chemical hardness and softness, show that the chemical stability of NOTA–alkali metal complexes decreases down the periodic table. This study sheds light on the impact of competing alkali metal ions to the radiolabelling efficiency of NOTA.
1,4,7-Triazacyclononane-1,4,7-triacetic acid (NOTA), 1,4,7-triazacyclododecane-1,4,7-tetraacetic acid (DOTA), diethylene triaminepentaacetic acid (DTPA), 1,4,7-triazacyclononane phosphinic acid (TRAP), 1,2-[[6-carboxy-pyridin-2-yl]-methylamino]ethane (H2dedpa), and N,N′-bis(6-carboxy-2-pyridylmethyl)-ethylenediamine-N,N′-diacetic acid (H4octapa) are examples of the most widely researched chelators for radiolabelling. The focus of the present article is to investigate NOTA and its complexation to alkali metals.
NOTA, a hexadentate chelator, is one of the most extensively investigated macrocyclic BFCs, and is utilized for the complexation of a large array of bi- and trivalent metal ions.11 NOTA chelator has the geometry of the N3O3 coordination sphere and consists of three carboxylic (–COOH) functional arms (see Fig. 1 for the structure of NOTA).
Several studies involving NOTA, its derivatives, and other chelators, such as DOTA, an analogue of NOTA with four nitrogen and four pendant arms, have been performed.12–27 NOTA has been identified as a potential chelating agent for various radiopharmaceutical experiments and confirmed as a “gold standard” chelator for Ga3+ with a short radiolabelling time and outstanding in vivo stability.3 Velikyan et al.28 reported that the 68Ga–NOTA complex is stable in human plasma at 37 °C. Chakravarty25 et al., also reported that even in the presence of up to 10 ppm of other metal ion contaminations, such as Zn+, Cu+, Fe+, Al+, Sn+ and Ti+ ions, NOTA-based bifunctional chelators (NOTA–NCs) could be radiolabelled instantly with 68Ga at room temperature. Jeong and co-workers14 confirmed that NOTA is a better BFC than DOTA is for 68Ga, exhibiting a high stability even when hindered by various metal ions. Ferreira and co-authors22 reported that at room temperature, a short reaction time is required when 68Ga is radiolabelled with P–NO2–Bn–NOTA, a NOTA derivative. Radiolabelling 64Cu with NOTA has shown a better result than when 64Cu is radiolabelled with common chelators, such as DOTA, EDTA, DTPA, and TETA.19,24 The results from these experiments show that NOTA is compatible with the heat sensitive, antibody vector due to its short radiolabelling time and ability to radiolabel at room temperature.29 Geraldes et al.,30 reported that there is a weak complex species between NOTA and alkali ions in aqueous solution. Potentiometric measurements, multinuclear nuclear magnetic resonance spectrometry (NMR) and density functional theory calculations of the gallium complexes of NOTA derivatives revealed that phosphinic derivatives of NOTA (TRAP ligands) exhibit higher selectivity than NOTA for binding small metal ions.31
Our recent study showed the conformational behaviour and complexation between Na+ cation and diazacrown32 using density functional theory (DFT), Møller–Plesset (MP2) and molecular mechanics methods. It was shown that, upon complexation, there was charge transfer between the diazacrown and Na+, causing a reduction in the +1 charge of the free ion. Behjatmanesh-Ardakani et al.,33 analyzed the host–guest interaction between alkali metals (Li+, Na+, and K+) and some selected ligands using DFT-B3LYP level of theory. The same authors studied the interactions between aza, diaza, and triaza-12-crown-4 ligands as host molecules and Na+ ion as a guest species using B3LYP/6-311G level of theory.34
To the best of our knowledge, little or no computational research has been performed on the complexations of alkali metals with NOTA chelator. In light of this, the aim of the present research is to perform electronic structure calculations to provide insight into the factors affecting the chelating ability of NOTA with alkali metals. This investigation will explore how NOTA interacts with alkali metal ions, Li+, Na+, K+ and Rb+? This can be expanded into exploiting the possible impacts of these competitive ions on the radiolabelling yield of NOTA, which is useful to predict how well NOTA will complex radio metals in the presence of other ions in vivo. To gain an in depth insight into the complexation of NOTA with alkali metals, the interaction energy values, relaxation energy of NOTA–alkali metal complexes and other thermodynamic properties, entropy, enthalpy, Gibbs free energy and interatomic distances of the optimized NOTA and ion complexes will be reported. NBO and NMR chemical shift analysis and DFT-based reactivity descriptors, the electron affinity (EA), ionization potential (IP), softness (S) and hardness (η) will also be reported.
Two different NOTA–ion complex configurations were geometry optimized. The first configuration had six hetero atoms (three oxygen and three nitrogen atoms) in close proximity to the alkali metal cations (conformation ‘A’), while the second configuration had four hetero atoms (two oxygen and two nitrogen atoms) interacting with the cations (conformation ‘B’) (Fig. 2). The atoms in the complexes are classified based on the connectivity of the atoms involved in different functional groups.
Interaction energies (Eint), between NOTA and the different metal ions, were calculated using the following equation:32
Eint = EMOL1–MOL2 − EMOL2 − EMOL1 | (1) |
The Polarizable Continuum Model (PCM), using the integral equation-formalism polarizable continuum model (IEF-PCM), was used to evaluate the solvent effect on the NOTA complexation with alkali metals. Thermodynamic properties (free energy, enthalpy, and entropy) were performed. Normal mode analysis was used in calculating the vibrational, translational and rotational contributions to entropy.46 Electron donation between the filled donor and empty acceptor orbitals and their estimated energetic significance was assessed using second-order perturbation theory, with the NBO program implemented in Gaussian 09.47–49
The calculated Basis Set Superposition Error (BSSE) with different basis sets provided rationale for selecting the basis set, 6-311+G(2d,2p), which showed the lowest BSSE value for the NOTA–Rb+ complex, as well as reasonably low BSSE values for other ions compared with the more expensive 6-311G++(3d,3p) basis set (see Tables 1S and 2S†).
The second-order Fock matrix was presented to evaluate the donor–acceptor interactions in the system.50,51 To provide a clear picture of electron delocalization between NOTA and the metals in the complexes, the donor and acceptor orbitals with the highest stabilization energy are presented in terms of E2 from second-order theory.52,53 The second order perturbation energy E2 of the occupied NBO(i) of an electron donor, which interacts with the unoccupied NBO(j) of electron acceptor, is estimated by the expression:
![]() | (2) |
The energy values of the highest occupied molecular orbital (EHOMO) and the lowest unoccupied molecular orbital (ELUMO) of all the complexes were calculated. Several other electronic properties, such as ionization potential (IP), electronic affinities (EA), hardness (η) and softness (S) were calculated. The ionisation potential (IP) is defined as the difference in ground state energy between the radical cationic (Ec) and the neutral species (En):
IP = Ec − En | (3) |
The electron affinity (EA) is defined as the difference in ground state energy between the radical anionic (Ea) and its corresponding neutral species (En):
EA = Ea − En | (4) |
The term “neutral” is the standard charge state, for instance, the ions have +1 charge and cationic and anionic species would have +2 and 0 charges, respectively.
Single point energies, at the geometry-optimized configurations of standard charge states, were performed for these calculations. The DFT-based structural features, chemical hardness, η, and softness, S, were obtained using the following equations:54,55
![]() | (5) |
![]() | (6) |
Complexes | ΔErelative OC (kcal mol−1) | ΔErelative OH (kcal mol−1) |
---|---|---|
NOTA–Li+ | 0 | 14.67 |
NOTA–Na+ | 0 | 14.23 |
NOTA–K+ | 0 | 13.23 |
NOTA–Rb+ | 0 | 12.87 |
According to Table 1, the OC–ion conformations were more stable than those of OH–ion and this trend decreased down the alkali metal series. Consequently, it can be inferred that OC–ion interactions have a more crucial contribution in the intermolecular ion chelation than OH–ion.
Complex | Eint | Erelax | EBSSE | |||
---|---|---|---|---|---|---|
Complex ‘A’ | Complex ‘B’ | Complex ‘A’ | Complex ‘B’ | Complex ‘A’ | Complex ‘B’ | |
a Brackets indicate interaction energy values of the complexes in solvent, Eint: interaction energy, Erelax; relaxation energy, EBSSE: basis sets superposition error. | ||||||
NOTA–Li+ | −118.04 [−23.48] | −92.98 [−13.11] | 12.36 | 6.70 | 1.38 | 1.08 |
NOTA–Na+ | −89.78 [−18.33] | −65.93 [−11.06] | 8.04 | 5.00 | 1.80 | 1.42 |
NOTA–K+ | −64.01 [−14.08] | −44.28 [−9.10] | 7.42 | 4.07 | 0.72 | 0.55 |
NOTA–Rb+ | −54.25 [−7.44] | −33.24 [−5.65] | 6.35 | 3.72 | 0.43 | 0.28 |
For conformations ‘A’ and ‘B’, the interaction energies for NOTA complexation with alkali metal ion follow a decreasing order: NOTA–Li+ > NOTA–Na+ > NOTA–K+ > NOTA–Rb+. The interaction energy values for complexes in conformation ‘A’ are significantly more negative than that of the complexes in conformation ‘B’, which signifies that there is greater intermolecular NOTA–ion interaction for complex ‘A’, with six atoms in close proximity to the ions than for the complex ‘B’, with four atoms interacting with the respective ion. Furthermore, complex ‘A’ appears in the reported range for the coordination number of ions; that is, for Li+ the coordination number is 4 or 6, Na+ ranges between 4 and 8, K+ ranges between 5.6 and 8.3 while for Rb+ varies between 6 and 8.56 The interaction energy values in both cases, however, indicated that the stability of NOTA complexation with alkali metals decreases down the group of the periodic table, which agrees with the increased values of the distances between the hetero-atoms and the ions in the complexes, down the group (see Section 3.3.). For all complexes, the calculated BSSE energy values were lower than 2 kcal mol−1, which validates the reliability and effectiveness of the size of the applied basis set for the considered system.
The relaxation energy values decrease down the periodic table for conformations ‘A’ and ‘B’. This implies that the larger the intermolecular interaction in NOTA–alkali metal complexes, the more the ion can induce a specific conformation that could be different from its preferred conformation. Conformation ‘A’ complexes show greater relaxation energy values than conformation ‘B’, this being due to the former having more hetero atoms in close proximity to the cations and the cations therefore having a greater effect on the conformation of the complexes than the latter.
To take into account the long-range and dispersion interactions, the geometry optimization of complex B was performed using the ωB97XD functional and the interaction energies are listed in Table 7S.† Since less negative interactions energies were observed with the ωB97XD functional, it seems that dispersion is an important factor in binding of NOTA with alkali metal ions. It is notable that the interaction energies obtained with both B3LYP and ωB97XD functionals correlate as the observed decreasing trend within the alkali metal series was maintained; therefore, the results obtained with B3LYP are qualitatively valid.
Complexes | ΔH (kcal mol−1) | ΔG (kcal mol−1) | ΔS (cal mol−1 K−1) | ΔSRot (cal mol−1 K−1) | ΔSTrans (cal mol−1 K−1) | ΔSVib (cal mol−1 K−1) |
---|---|---|---|---|---|---|
a Parentheses indicate thermodynamic values of the complexes ‘B’. | ||||||
NOTA–Li+ | −115.92 (−91.25) | −102.70 (−80.55) | −44.33 (−35.88) | −0.55 (−0.39) | −31.73 (−31.73) | −12.05 (−3.77) |
NOTA–Na+ | −88.14 (−64.83) | −75.64 (−54.62) | −41.92 (−34.92) | −0.19 (−0.16) | −35.12 (−35.12) | −6.61 (1.03) |
NOTA–K+ | −62.51 (−43.33) | −50.80 (−33.84) | −39.18 (−31.84) | 0.12 (0.07) | −36.55 (−36.55) | −2.75 (4.64) |
NOTA–Rb+ | −49.28 (−32.29) | −38.09 (−23.43) | −37.53 (−37.53) | 0.42 (0.40) | −38.50 (−38.50) | 0.56 (8.35) |
For complexes with conformations ‘A’ and ‘B’, ΔH values are slightly less negative than the interaction energy values (Table 2). The interaction energy value for the Li+ complex is approximately 2 kcal mol−1 greater than the ΔH value, while for the other complexes, the interaction energy values are approximately 1 kcal mol−1 more than the ΔH values. The ΔH and ΔG values for the complexes in conformations ‘A’ and ‘B’ become less negative down the periodic table (Table 3). This emphasises the fact that the stability of the complexation of NOTA with alkali metals decreases down the group. While ΔS also becomes less negative down the group, it should be noted that a negative entropy value indicates a decrease in entropy of the system, which acts against the stability of the NOTA–alkali metal complexes ΔG = ΔH − TΔS.
The translational entropy contribution for all the complexes becomes more negative down the group, as the translation entropy for the free cations increases moves in this direction (Table 3S†). Additionally, translational entropy contributions are of similar value for the two ‘A’ and ‘B’ conformations. The rotational and vibrational entropy contributions become more positive down the group.
The effect of implicit solvation on the enthalpy, Gibbs free energy and entropy was considered. Table 4 shows that the ΔH and ΔG values of the complexes are significantly less negative than the ΔH values of the complexes in vacuum (Table 3). Less negative ΔS values were observed in the water medium than the vacuum. The rotational and translational entropies decrease down the group, but are similar to the corresponding values in the vacuum. As for the contribution of solvent to the vibrational entropy, ΔSVib values have become more positive for all NOTA–ion complexes, although the trend remains the same. According to Table 4S,† it can be inferred that the driving force behind the increase in ΔSVib is the decrease in vibrational entropy for free NOTA (−9.52 cal mol−1 K−1) upon solvation. The reason for the drastic change in vibrational entropy could be attributed to the fact that in vacuum, there is great repulsion between the carboxylic pendant arms, which causes the distance between these arms to be greater than in the water medium, where the repulsion between the arms is reduced (Fig. 1S†). The larger distance between the carboxylic arms, in vacuum, compared to the shorter distances that appear in the water medium lead to an increase in the structural flexibility of the NOTA, and an increase in entropy. Overall, the values highlighted above indicate that the complexation of NOTA with alkali metal ions in water is less favourable and less stable. The formation of NOTA–Rb+ complex appears to be significantly less favourable than other NOTA–ion complexes.
Complexes | ΔH (kcal mol−1) | ΔG (kcal mol−1) | ΔS (cal mol−1 K−1) | ΔSRot (cal mol−1 K−1) | ΔSTrans (cal mol−1 K−1) | ΔSVib (cal mol−1 K−1) |
---|---|---|---|---|---|---|
NOTA–Li+ | −22.34 | −12.05 | −34.53 | −0.46 | −31.73 | −2.34 |
NOTA–Na+ | −17.91 | −9.29 | −28.91 | −0.11 | −35.12 | 6.31 |
NOTA–K+ | −14.27 | −6.40 | −26.42 | 0.23 | −36.55 | 9.89 |
NOTA–Rb+ | −7.85 | −0.27 | −25.41 | 0.51 | −38.50 | 12.57 |
Complex | Average O–ion distance (≤3 Å) | Average N–ion distance (≤3 Å) |
---|---|---|
a Curly brackets indicate bond distances between heteroatoms and alkali metal ions in complexes in conformation ‘B’. | ||
NOTA–Li+ | 2.06 {1.98} | 2.26 {2.13} |
NOTA–Na+ | 2.34 {2.33} | 2.58 {2.49} |
NOTA–K+ | 2.76 {2.71} | 2.99 {2.96} |
NOTA–Rb+ | 2.90 {2.91} | 3.22 {3.25} |
The distances between the ions and heteroatoms for both ‘A’ and ‘B’ complexes increased down the group. The heteroatom-oxygen distances for all complexes match closely to the results in the literature regarding alkali metals with different molecules: Li+–O = 1.98;57,58 Na+–O = 2.34;59,60 K+–O = 2.76;60–62 Rb+–O = 2.95.63–65 The ion–heteroatoms distances for complexes in conformation ‘B’, however, are closer than those for complex ‘A’, with the increased competition between the six heteroatoms in complex ‘A’ resulting in a slight increase in the ion–heteroatom distances. The close proximity and high negative charge value of NOTA oxygen and nitrogen atoms, after geometry optimization, (see “Natural bond orbital (NBO) analysis” section, Table 6) signifies the importance of the contribution of these two atoms (N, O) for NOTA complexation with alkali metal ions.
Atom groups | NOTA–Li+ | NOTA–Na+ | NOTA–K+ | NOTA–Rb+ | Free NOTA |
---|---|---|---|---|---|
a Bracket indicates values for complex ‘B’. The numbers in () represent the number of atoms within the specific group shown in Fig. 2. | |||||
Ion | 0.48 [0.63] | 0.69 [0.77] | 0.77 [0.84] | 0.79 [0.85] | Not applicable |
N(3) | −0.59 [−0.60] | −0.59 [−0.60] | −0.58 [−0.59] | −0.58 [−0.59] | −0.57 |
OH(3) | −0.66 [−0.68] | −0.66 [−0.70] | −0.66 [−0.70] | −0.66 [−0.70] | −0.71 |
OC(3) | −0.60 [−0.60] | −0.63 [−0.61] | −0.63 [−0.61] | −0.63 [−0.61] | −0.61 |
CIN(6) | −0.17 [−0.17] | −0.17 [−0.18] | −0.18 [−0.18] | −0.17 [−0.18] | −0.18 |
HIN(12) | 0.20 [0.21] | 0.20 [0.20] | 0.20 [0.20] | 0.20 [0.20] | 0.19 |
CA(3) | −0.26 [−0.26] | −0.26 [−0.26] | −0.27 [−0.27] | −0.27 [−0.26] | −0.26 |
HAC(6) | 0.23 [0.23] | 0.23 [0.23] | 0.22 [0.23] | 0.22 [0.22] | 0.22 |
C(COOH)(3) | 0.84 [0.84] | 0.83 [0.82] | 0.83 [0.82] | 0.83 [0.82] | 0.81 |
H(COOH)(3) | 0.50 [0.51] | 0.50 [0.51] | 0.50 [0.50] | 0.50 [0.50] | 0.49 |
To evaluate the dispersion effect on the geometric parameters, the interatomic distances using the ωB97XD functional are reported in Table 8S.† It can be noticed average N–ion distances are smaller with ωB97XD than with B3LYP; hence, it can be inferred that, with this functional the nitrogen in NOTA plays a more important role to interact with the ions in comparison to B3LYP where the carboxyl arms were in close proximity with the ions. The optimized geometry of free NOTA using the ωB97XD functional is also provided in Fig. 3S.†
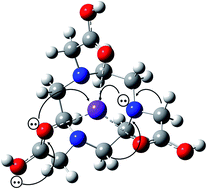
The NBO analysis shows that there are considerable changes in the charges for the cations after complexation with alkali metals for all the complexes. For conformations ‘A’ and ‘B’, the alkali metals, with a charge of +1 before complexation, become less electron deficient after complexation, the atomic charge deficiency decreasing down the group, and implies that there was electron density transfer from NOTA to the alkali metal. The cations in complexes ‘A’ are more electron deficient as more heteroatoms are involved in intermolecular NOTA–ion interactions. Furthermore, nitrogen and oxygen (OC) atoms are more negatively charged in the complexed-NOTA compared to the free NOTA. This implies that charge transfer occurred to those atoms upon complexation (Fig. 3). The charges for the NOTA oxygen and nitrogen atoms are more negatively charged than all other atoms in the complexes, which explains the greater electrostatic interaction, and the closer distances of the oxygen atoms and nitrogen atoms to the alkali metals.
Complexes | Donor | Acceptor | E2 (kcal mol−1) |
---|---|---|---|
a Brackets indicate values for complex ‘B’. | |||
Within NOTA | |||
NOTA–Li+ | LP(O) | σ*(C–O) | 45.47 [56.17] |
NOTA–Na+ | LP(O) | σ*(C–O) | 38.94 [54.40] |
NOTA–K+ | LP(O) | σ*(C–O) | 38.82 [53.57] |
NOTA–Rb+ | LP(O) | σ*(C–O) | 38.69 [53.28] |
NOTA | LP(O) | σ*(C–O) | 43.46 [45.62] |
![]() |
|||
From NOTA to ions | |||
NOTA–Li+ | LP(O) | LP*(Li+) | 17.31 [23.33] |
NOTA–Na+ | LP(O) | LP*(Na+) | 15.88 [12.28] |
NOTA–K+ | LP(O) | LP*(K+) | 14.82 [9.45] |
NOTA–Rb+ | LP(O) | LP*(Rb+) | 12.17 [7.42] |
The highest stabilization energy values, due to the charge transfer within NOTA, are electron donations from the LP in OH to the antibonding acceptor σ*(C–OC). For conformations ‘A’ and ‘B’, the stabilization energy follows a decreasing order: NOTA–Li+ > NOTA–Na+ > NOTA–K+ > NOTA–Rb+. The stabilization energy values within complexes in conformation ‘B’ are greater than those in conformation ‘A’. This signifies that the existence of a greater number of heteroatoms in close proximity to the cations in conformation ‘A’, leads to competition for heteroatom–ion interactions; this results in a reduced charge transfer per heteroatom.
For complexes ‘A’ and ‘B’, the stabilization energy values for electron transfer from a lone pair of OC of NOTA to a lone pair* of alkali metals, decreases down the group. There is a charge transfer from the nitrogen atom lone pair to the lone pair* of ions (Table 5S†), although this is lower than that of the oxygen to ion charger transfers.
The result of the second perturbation theory emphasises the fact that electron transfer is prevalent from oxygen and nitrogen atoms of NOTA to the alkali metals in the complexes. A similar result was obtained from our previous work, where we evaluated the interaction between diazacrown and sodium cation.32 A description of charge transfer that occurs from the NOTA molecule to the cations is represented in Fig. 3, where arrows indicate the path of charge transfer.
Proton | δTheo Li+ (ppm) | δExp (ppm) | δTheo Na+ (ppm) | δExp (ppm) | δTheo K+ (ppm) | δExp (ppm) |
---|---|---|---|---|---|---|
a δExp are experimental results.30 Δvac and Δsolv indicate the difference between the experimental and theoretical chemical shift, in vacuum and solvent, respectively. | ||||||
G1 | 7.18 [6.81], NAC = 0.50 | Not reported | 7.09 [6.84], NAC = 0.50 | Not reported | 6.99 [6.76], NAC = 0.50 | Not reported |
G2 | 3.83 [3.74], NAC = 0.23 | 3.76, Δvac = 0.07, Δsolv = −0.02 | 3.71 [3.65], NAC = 0.23 | 3.48, Δvac = 0.23, Δsolv = 0.17 | 3.69 [3.60], NAC = 0.22 | 3.52, Δvac = 0.17, Δsolv = 0.08 |
G3 | 3.23 [3.14], NAC = 0.20 | 3.26, Δvac = −0.03, Δsolv = −0.12 | 3.34 [3.19], NAC = 0.20 | 3.03, Δvac = 0.31, Δsolv = −0.16 | 3.20 [3.18], NAC = 0.20 | 3.06, Δvac = −0.14, Δsolv = −0.12 |
G4 | 3.00 [2.97], NAC = 0.20 | Not reported | 2.84 [2.88], NAC = 0.20 | Not reported | 2.58 [2.71], NAC = 0.19 | Not reported |
G5 | 2.68 [2.68], NAC = 0.21 | Not reported | 2.80 [2.78], NAC = 0.20 | 2.98, Δvac = −0.18, Δsolv = −0.20 | 2.95 [2.94], NAC = 0.20 | 3.03, Δvac = −0.08, Δsolv = −0.07 |
G6 | 2.55 [2.52], NAC = 0.21 | Not reported | 2.40 [2.40], NAC = 0.21 | Not reported | 2.32 [2.33], NAC = 0.20 | Not reported |
In most cases, the theoretical δ values follow a decreasing order down the group, which is due to the ions having a deshielding effect on the protons of the NOTA that are in close proximity. The decrease in the δ values is consistent with the decrease in the electron withdrawing effect of the ions, which causes a decline in NAC values down the group. It should be noted that the theoretical chemical shift values are in good agreement with the experiment (differences are less than 1 ppm), which indicates the suitability of the applied DFT functional and basis set. Furthermore, there is no significant difference between the 1H NMR in the vacuum and the water.
Fig. 4 shows the groups of protons (G1 to G6) characterized by different theoretical chemical shifts. It is notable that the theoretical NMR analysis implies that each group has different chemical environments, which could not be detected in the experiment. This motivated a measurement of the theoretical chemical shifts for all proton groups, for which a detailed discussion is provided.
![]() | ||
Fig. 4 NOTA–alkali ions complex based on the intensity of the different chemical shifts. G indicates the different groups of hydrogen. Hydrogen atoms with the same colour code belong to the same chemical environment (indicated by the number of the chemical shift in Table 8). |
For both Na+ and K+ complexes, the highest δ values are found for the carboxyl protons (G1), which have the most positive atomic charges, followed by the proton of the methylene group (–CH2–) within the pendant arm (G2), this ranking of δ values agreeing with experimental results. The G3 to G6 are protons in the ring with the same functional group but different chemical environments, the protons in G3 having higher δ values than the other protons, which is caused by the G3 protons facing towards the each other.
It should be noted that the δ ranking for G3 to G6 is not only caused by their proximity to the ion, but by their environment in relation to other atoms within the NOTA. This is evident by the fact that the δ ranking for the free NOTA is exactly the same as for complexed NOTA (Table 6S†). The free NOTA G3 has the highest δ value amongst G3 to G6, which appears to be due to these protons facing towards each other. Furthermore, G2, G3 and G4 become less deshielded upon complexation, while G1, G5 and G6 become more deshielded. In contrast, natural atomic charges of all groups (G1–G6) are more positive upon complexation suggesting two different electronic effects that contribute to the chelation process. First, the inductive effect, through charge transfer from σ(C–H) ring to the σ(N–C), as demonstrated in Fig. 3 (arrow C), could be responsible for the observed trend in natural atomic charges. Secondly, short-range coupling should affect δ values, although this effect is complicated by the chemical environment of the proton with respect to the other NOTA atoms as well as the ions.
To evaluate the stability of complexation, the HOMO and LUMO energy eigenvalue (EHOMO, ELUMO) of the NOTA–ion complexes, and individual components in the complexes, are presented in Table 9.
Complexes/ions | EHOMO (eV) | ELUMO (eV) | ΔELUMO–HOMO (eV) |
---|---|---|---|
a Bracket indicates values for complexes in conformation ‘B’. | |||
Li+ | −63.92 | −6.95 | 56.97 |
Na+ | −39.16 | −7.10 | 24.33 |
K+ | −26.53 | −5.94 | 20.59 |
Rb+ | −22.88 | −5.53 | 17.34 |
NOTA | −7.80 | −2.86 | 4.93 |
NOTA–Li+ | −9.11 [−8.17] | −3.27 [−3.35] | 5.84 [−4.81] |
NOTA–Na+ | −8.92 [−8.14] | −3.20 [−3.39] | 5.72 [−4.76] |
NOTA–K+ | −8.79 [−8.11] | −3.17 [−3.40] | 5.62 [−4.71] |
NOTA–Rb+ | −8.84 [−8.14] | −3.28 [−3.50] | 5.57 [−4.64] |
The EHOMO energy value of the individual alkali metal becomes less negative down the group. In conformations ‘A’ and ‘B’, the EHOMO becomes less negative down the group from Li+ to K+, whilst EHOMO for NOTA–Rb+ is slightly higher than for the K+ complex, which could be an artefact of using a different basis sets for Rb+. The EHOMO values for conformation ‘A’ are slightly more negative than those for ‘B’ due to the greater stability of conformation in the former.
A question may arise regarding the impact on EHOMO of NOTA upon complexation with each ion. The presence of the ion, in the NOTA complexes, has a significant effect on the EHOMO of the complexes, and increases the ability of NOTA to donate an electron; this effect is decreased down the alkali metal series.
The ΔELUMO–HOMO gap is a commonly used stability index,75 the higher its value, the more stable the chemical system.76 For the alkali metal ions before complexation, the order is Li+ > Na+ > K+ > Rb+. The ΔELUMO–HOMO for free metals is significantly higher than the complexes. For both conformations ‘A’ and ‘B’, the ΔELUMO–HOMO energy gap decreases down the group in the following order: NOTA–Li+ > NOTA–Na+ > NOTA–K+ > NOTA–Rb+. However, the ΔELUMO–HOMO gap for complexes in conformation ‘A’ is slightly greater than that of complexes ‘B’. This signifies that complexes in conformation ‘A’, with six atoms in close proximity to the cations, are more stable than conformation ‘B’, with only four atoms. The ΔELUMO–HOMO energy gap values imply that the stability for the alkali metal, and that of the NOTA–ion complexes, decreases down the group.
The calculated DFT-based quantities, such as electron affinity (EA), ionization potential (IP), chemical hardness (η) and softness (S) for the complexes, are presented in Table 10.
Complex | EA (eV) | IP (eV) | η (eV) | S (eV) |
---|---|---|---|---|
a Parenthesis indicates values of complex ‘B’. | ||||
Li+ | −5.62 | 76.04 | 40.83 | 0.01 |
Na+ | −5.42 | 47.62 | 26.52 | 0.02 |
K+ | −4.50 | 31.69 | 18.10 | 0.03 |
Rb+ | −4.30 | 27.92 | 16.11 | 0.03 |
NOTA | 0.60 | 7.11 | 3.26 | 0.15 |
NOTA–Li+ | −2.44 [−2.73] | 11.58 [11.04] | 7.01 [6.89] | 0.071 [0.0726] |
NOTA–Na+ | −2.40 [−2.80] | 11.47 [10.96] | 6.94 [6.88] | 0.072 [0.0727] |
NOTA–K+ | −2.41 [−2.84] | 11.28 [10.77] | 6.84 [6.81] | 0.073 [0.0735] |
NOTA–Rb+ | −2.41 [−2.94] | 11.09 [10.61] | 6.75 [6.77] | 0.074 [0.0738] |
For the free metals, the electron affinity (EA) becomes less negative and the ionization potential (IP) becomes less positive, which leads to a decreasing chemical hardness down the group.
A comparison of free-NOTA with the complexes revealed that the presence of the ions leads to an increase in hardness, and therefore an increase in stability upon complexation. The smaller the ion, the greater the hardness, this observation being consistent with the trend in interaction energies and thermochemical properties (Tables 2 and 3). Furthermore, these results indicate that the ability of the complexes to exchange electrons, and their electron polarizability, increases down the group.
The hardness values for conformations ‘A’ and ‘B’ follows a similar decreasing order, although conformation ‘A’, with 6 heteroatoms interacting with ions, has a higher hardness values. It is notable that the decreasing order of hardness is consistent with the decreasing ΔELUMO–HOMO. The softness value is the inverse of the hardness value, and thus follows an increasing order down the group.
The displacement of radio metals, as a result of competition from alkali metals or other competing ions, can be disastrous, as some radio metals, when released from bifunctional chelators (BFC), are stored in some organs in the body. For example, 89Zr and 68Ga are known to accumulate in the bone, where 64Cu accumulates in the liver.3 Furthermore, it is assumed that the rate of the competition of alkali metals with radio metals, during complexation with NOTA, decreases down the group, as NOTA–Li+ is the most stable complex. Another factor that should be noted is that the concentration of alkali metals in the biological system varies considerably: Li+ = 3.1 × 10⁻⁸ kg kg−1, Na+ = 2.5 × 10⁻³ kg kg−1, K+ = 1.5 × 10⁻³ kg kg−1, Rb+ 4.6 × 10⁻⁶ kg kg−1.81 Despite Li+ being the most optimal match to NOTA (Tables 2 and 3), it might not constitute much competition as it is in low quantities in the body. Na+ and K+ are in much higher quantities and can reasonably bind with NOTA, which can constitute competition with radio metals for complexation with NOTA. Amongst the aforementioned ions, Na+ should be the greatest competitor, as it has the highest concentration and binds more strongly to NOTA than K+. There is a need to establish the level of alkali metal competition with radio metals by comparing the stability of NOTA–radio metal with NOTA–alkali metal complexes. It is therefore our future intention to evaluate the complexation of NOTA chelator with some selected radio metals. This information can be used to propose chelators that bind to alkali metals less strongly than NOTA does, yet maintains radio metal stability.
Footnote |
† Electronic supplementary information (ESI) available. See DOI: 10.1039/c6ra20203a |
This journal is © The Royal Society of Chemistry 2016 |