DOI:
10.1039/C6RA20081H
(Paper)
RSC Adv., 2016,
6, 92638-92647
Effects of an alkali-acid purification process on the characteristics of eucalyptus lignin fractionated from a MIBK-based organosolv process†
Received
9th August 2016
, Accepted 19th September 2016
First published on 21st September 2016
Abstract
In this study, the effects of an alkali-acid purification process on the properties of eucalyptus lignin isolated from a methyl isobutyl ketone (MIBK)/methanol/water-based organosolv fractionation process were evaluated. The results showed that the treatment reduced the content of carbohydrates, ash, nitrogen and sulfur, and improved lignin solubility (up to 218%) in five organic solvents (acetone, methanol, ethanol, tetrahydrofuran and dimethyl sulfoxide) and removed lignin fractions with smaller molecular weights. However, analysis by Py-GC/MS, solid state NMR and 2D-HSQC NMR indicated that the alkali-acid treatment process did not cause changes to the monomeric lignin subunits and linkages of the lignin polymer. The treated lignin showed slightly higher thermal stability at temperatures <250 °C, though its maximum rate of decomposition occurred at 325 °C, 26 °C lower than that of the untreated lignin. On the basis of these results, the significant improvement in solvent solubility of the lignin by the treatment process will widen lignin application.
1. Introduction
Lignin is an amorphous aromatic polymer and contains both aliphatic and aromatic hydroxyl groups, and so has the potential to be used as feedstock for the development of many renewable materials including chemicals, fuel additives, carbon-fibres, surfactants, adhesives and so on.1,2 Lignins are generally isolated by the organosolv and alkaline pulping processes. The solvents used for biomass fractionation and pretreatment are from a wide range of organic solvents, including acetone, methanol, ethanol, organic acids (i.e., acetic acid, formic acid), inorganic and organic bases, ketones, ethylene glycol, esters and combined solvents with and without catalysts (acid, alkaline, etc.).3–5 It is therefore expected that the process employed in isolating lignin from native lignocellulosic biomass has a significant influence on its structure, purity, and physicochemical properties,6 and thus on its application.
Recently, a new organosolv technology has been applied for the selective dissolution of lignin and hemicelluloses from lignocellulosic materials, using a ternary mixture of ketone (e.g., methyl isobutyl ketone (MIBK)), alcohol (e.g., methanol, ethanol) and water in the presence of an acid promoter (e.g., H2SO4, heterogeneous acid catalyst).7,8 This fractionation process is very attractive because lignin and hemicellulose sugars can be phase-separated. Although lignin is one of the major products (cellulose pulp, hemicellulose sugars and lignin) produced in this process, most of previous studies have only focused on the process optimization and the production of digestible cellulose pulp. Only one study reported the preliminary characterization results of lignins from a number of biomasses including sugarcane bagasse, switchgrass, eucalyptus, aspen, poplar, oak and biomass mixtures fractionated using MIBK/ethanol/water mixture in the presence of H2SO4.9 In that study, only thermal and Fourier transform infrared spectroscopy (FT-IR) analysis were used and the results showed that the abundances of lignin subunits (H, S and G) varied significantly depending on the biomass types and fractionation conditions.
In the present work, the effects of alkali-acid treatment purification process on the characteristics of eucalyptus wood lignin recovered from the H2SO4 catalyzed MIBK/methanol/water process was investigated. The purified lignin composition was determined by elemental analysis and the well-known biomass compositional analysis method developed by the National Renewable Energy Laboratory (NREL), US. Lignin solubility was evaluated in several organic solvents, viz., acetone, methanol, ethanol, tetrahydrofuran (THF) and dimethyl sulfoxide (DMSO). Solvent solubility is an important parameter that affects depolymerization and dehydrodeoxegenation reactions of lignins as well as the resulting product yields.10 The purified lignin was further characterized by Mannich reaction (to provide information on the vacant sites in the aromatic ring), size exclusion chromatography (SEC), X-ray photoelectron spectroscopy (XPS) analysis, FT-IR, solid-state nuclear magnetic resonance (NMR), pyrolysis coupled to gas chromatography-mass spectrometry (Py-GC/MS) and thermal gravimetric analysis (TGA).
2. Materials and methods
2.1 Lignin preparation
Lignin preparation procedures have been described elsewhere in our previous publications.8,11 Briefly, eucalyptus wood chips (80 g on a dried weight basis), which consisted of 45.4% cellulose, 21.1% hemicellulose, 30.4% lignin and 3.3% other components (e.g., ash),8 was sequentially fractionated by a ternary mixture of methyl isobutyl ketone![[thin space (1/6-em)]](https://www.rsc.org/images/entities/char_2009.gif) :methanol:water (25:42:33) in the presence of 0.008 M H2SO4 as acid promoter at 180 °C for 60 min using 1 L Parr reactor (Parr Instrument, USA). The fractionation was conducted in four replicate batches to prepare enough lignin (OL) for the purification experiment.
:methanol:water (25:42:33) in the presence of 0.008 M H2SO4 as acid promoter at 180 °C for 60 min using 1 L Parr reactor (Parr Instrument, USA). The fractionation was conducted in four replicate batches to prepare enough lignin (OL) for the purification experiment.
The OL sample was treated and purified using an alkali-acid precipitation process according to our previous publication.11 In detail, 20 g of OL was placed in a 600 mL beaker, to which 200 mL 2 M NaOH was added drop-wise. The mixture was warmed at 35 °C in a water bath for 30 min. The base-soluble lignin was then separated from the insoluble residue by filtration on a Whatman No. 52 filter paper. The residual base insoluble lignin (BIL) was washed (4 × 400 mL distilled water) until a neutral filtrate was observed. The base-soluble lignin was acidified to regenerate lignin following the procedure described previously.12 2 M H2SO4 was added drop-wise to the base-soluble lignin solution to drop the pH to 5.5. At this pH the appearance of the mixture began to change from dark black to murky brown, as a result of the initial stage of lignin precipitation. The mixture was stirred for 20 min and thereafter further acid was added until pH 3. The mixture was then transferred to a water bath and heated at 65 °C and continuously stirred for 30 min. The precipitated lignin was recovered by vacuum filtration and washed with hot water (70–80 °C). The washed lignin was dried in a vacuum oven at 45 °C overnight and named as treated organosolv lignin (TOL).
2.2 Lignin solubility test
The organic solvents, acetone, methanol, ethanol, THF and DMSO, used for the lignin solubility test were purchased from Sigma-Aldrich (Australia). Dried lignin (2 g) sample (OL or TOL) was mixed with 100 mL of each solvent in 250 mL Schott bottles. Mixing was conducted at room temperature (24 °C) with a magnetic stirring speed of 100 rpm. After 18 h mixing, the solvent solution was filtered under vacuum and dried at 70 °C for 48 h. The solubility was expressed as g lignin/100 mL solvent.
2.3 Lignin characterization
2.3.1 Elemental analysis. A FLASHEA 1112 Elemental Analyzer instrument was used for analysis of the lignin samples (OL and TOL). The sample preparation was the same as reported previously.13
2.3.2 Composition analysis. Compositional analysis (cellulose, hemicelluloses, lignin and ash) of the lignin preparations OL and TOL was conducted according to the standard methods for biomass compositional analysis developed by NREL, US.14
2.3.3 Mannich reaction. The amounts of free C-5 positions in the aromatic rings of the lignins were determined by Mannich reaction using the method developed previously.15 The detailed procedure has been described previously.13
2.3.4 Determination of weight-average (Mw) and number-average (Mn) molecular weights. SEC was used to determine the average molecular weights of different lignins. A high-performance liquid chromatography (HPLC) instrument was used with a Shodex Asahipak GS-320 HQ column and a Water 2487 UV detector (280 nm). The detailed procedure has been described previously.13 Lignin weight-average molecular weight (Mw) and number-average molecular weights (Mn) were calculated after comparison with standards.
2.3.5 X-ray photoelectron spectroscopy (XPS) analysis. XPS was used to analyze the surface chemistry of the lignin samples using a Kratos Axis ULTRA X-ray photoelectron spectrometer (Kratos Analytical, UK) incorporating a 165 mm hemispherical electron energy analyzer. The incident radiation was monochromatic Al Kα X-rays (1486.6 eV) at 150 W (15 kV, 10 ma) and then photoelectron data were collected at takeoff angle of θ = 90°. Survey (wide) scans were operated with pass energy of 160 eV and multiplex (narrow) high-resolution scans were operated at 40 eV. Survey scans were performed over a binding energy range from 1200 eV to 0 eV with an interval step of 1.0 eV and a dwelling time of 100 ms. Narrow high-resolution scans were run with an interval step of 0.05 eV and a dwelling time of 250 ms. The base pressure was 1.0 × 10⁻⁹ to 1.0 × 10⁻⁸ torr in the analysis chamber during sample analysis. Atomic contents (%) were calculated using the CasaXPS version 2.3.14 software (Manchester, UK). Peak fitting of the high-resolution data were also carried out using the CasaXPS software.
2.3.6 Thermal gravimetric analysis (TGA). Q500TGA instrument was used for the analysis with a flow rate of the purge gas (N2) of 20 mL min−1. The TGA method and data process were the same as reported previously.13 A derivative of TGA curve (DTG) was produced to indicate the temperatures at which the maximum rates of weight loss occurred.
2.3.7 Attenuated total reflectance (ART)-Fourier transform-infrared (FT-IR) spectroscopy analysis. The FT-IR spectra of the solid lignin samples were obtained on a Nicolet 5700 Diamond FT-IR spectrometer (Madison, WI, USA). Spectra were manipulated and plotted with the use of the Galactic Industries Corporation GRAMS/32 software package (Salem, NH, USA). The details of ATR-FTIR have been described elsewhere.13
2.3.8 Solid-state nuclear magnetic resonance (NMR). The macromolecular structural of the lignin samples was determined using 13C-cross-polarization magic-angle-spinning (CP/MAS) solid-state probe mounted on Inova 400 Varian (Agilent, US) operated at 100 MHz. Magic angle spinning was conducted at 13 kHz, a recycle time of 2 s, an acquisition time of 33 ms, 4000 scans.
2.3.9 2D HSQC NMR. Approximately 40 mg of sample was dissolved in 0.75 mL of deuterated dimethylsulfoxide (DMSO-d6). 2D-NMR HSQC spectra were acquired at 25 °C on a Bruker AVANCE III 500 MHz spectrometer fitted with a cryogenically cooled 5 mm TCI gradient probe with inverse geometry (proton coils closest to the sample) equipped with a cryogenically-cooled z-gradient triple-resonance probe at the NMR facilities of the General Research Services of the University of Seville. The 2D 13C–1H correlation spectra were carried out using an adiabatic HSQC pulse program (Bruker standard pulse sequence ‘hsqcetgpsisp2.2’) and the following parameters: spectra were acquired from 10 to 0 ppm in F2 (1H) using 1000 data points for an acquisition time of 140 ms, an interscan delay of 1 s, and from 165 to 0 ppm in F1 (13C) using 256 increments of 32 scan, for a total acquisition time of 2 h 40 min. The 1JCH used was 145 Hz. Processing used typical matched Gaussian apodization in 1H and a squared cosine bell in 13C. The central solvent peak was used as an internal reference (δC/δH 39.5/2.49). 2D-NMR cross-signals were assigned as in previous publications.16
2.3.10 Pyrolysis coupled to gas chromatography and mass spectrometry (Py-GC/MS). Pyrolysis of the lignin samples (ca. 0.1 mg) was performed at 500 °C in an EGA/PY-3030D micro-furnace pyrolyzer (Frontier Laboratories Ltd., Fukushima, Japan) connected to a GC 7820A (Agilent Technologies, Inc., Santa Clara, CA) and an Agilent 5975 mass-selective detector (EI at 70 eV). The column used was a 30 m (length) × 0.25 mm (internal diameter), 0.25 μm film thickness, DB-1701 (J&W Scientific, Folsom, CA). The oven temperature was programmed from 50 °C (1 min) to 100 °C at 20 °C min−1 and then to 280 °C (5 min) at 6 °C min−1. Helium was the carrier gas (1 mL min−1). Identification of the released compounds was made by comparison of their mass spectra with those of the Wiley and NIST libraries and with those reported in the literature17,18 and, when possible, by comparison with the retention times and mass spectra of authentic standards. Molar peak areas were calculated for each lignin degradation product released, the summed areas were normalized, and the data for two replicates were averaged and expressed as percentages.
3. Results and discussion
3.1 Effect on lignin composition
OL yield from the fractionation was 15.0% compared to the total amount of initial biomass (or 49.3% of original lignin in biomass). TOL accounted for approximately 85% of the OL with the remaining being BIL. Table 1 shows the elemental compositions, empirical and C9 formula of OL and TOL. The empirical formula of the macromolecule was calculated based on the elemental composition and atomic weight while the C9 formula, which is commonly given as a hypothetical hydroxyphenyl structural unit in lignin chemistry, present six carbon atoms in the benzene ring and an additional three carbon atoms making up the propyl side-chain.13 Based on C9 formula, the purification process reduced hydrogen atom number but improved oxygen atom number in lignin (Table 1). The oxygen content in TOL was 32.3%, slightly higher than that in OL (31.1%), possibly indicating lignin oxidation occurred during alkaline treatment process. Nitrogen in OL was possibly from protein while sulfur may be from H2SO4, which was used as the catalyst in the biomass fractionation process. The purification process removed nitrogen and sulfur and the absence of sulfur in lignin is desirable, as it makes the material more amenable to chemical modification.19
Table 1 Lignin elemental composition and formula
| Lignin |
C |
H |
O |
N |
S |
Empirical formula |
C9 formulae |
| OL |
60.42 |
5.66 |
31.11 |
0.08 |
0.53 |
C5.03H5.62O1.94N0.006S0.017 |
C9H10.05O3.48N0.010S0.03 |
| TOL |
59.33 |
5.48 |
32.29 |
— |
— |
C4.94H5.44O2.02 |
C9H9.9O3.68 |
Table 2 shows the lignin compositions. The purification process reduced the carbohydrate (glucan, xylan, and arabinan) and ash contents in OL, and slightly improved lignin purity. Mass balance calculations indicated that about 6 wt% of the lignins was not accounted for, possible because the extractives components were not determined in this study. Similar results were obtained with lignins recovered from acid-catalysed ethylene glycol and acid-catalysed ionic liquid pretreatment processes.13
Table 2 Lignin biomass composition
| Lignin |
Contenta (% wt) |
| Glucan |
Xylan |
Arabinan |
Ash |
AIL |
ASL |
Total lignin |
| Error in analysis (% ±2). |
| OL |
0.03 |
0.91 |
0.05 |
0.12 |
92.59 |
0.04 |
92.63 |
| TOL |
0.01 |
0.29 |
0.02 |
0.04 |
93.14 |
0.10 |
93.24 |
3.2 Effect on lignin solubility
Table 3 shows the lignin solubility in acetone, methanol, ethanol, THF and DMSO. Lignin solubility was in the following order DMSO ≫ THF > acetone > ethanol > methanol. THF and DMSO are the commonly used organic solvents to dissolve lignins since they are polar aprotic solvents.20 The purification process improved lignin solubility by >100% in all the five organic solvents, which is attributed to the removal of BIL (likely to contain polymeric condensed structures) and lignin-carbohydrate linkages. The higher solubility of lignin in various solvent may expand its applications.
Table 3 Solubility of OL and TOL in organic solvents
| Solvent |
Solubilitya (g lignin/100 mL solvent) |
| OL |
TOL |
Increase (%, TOL compared to OL) |
| Error in analysis (% ±5). |
| Acetone |
0.20 |
0.62 |
208 |
| Methanol |
0.17 |
0.54 |
218 |
| Ethanol |
0.18 |
0.56 |
211 |
| THF |
0.30 |
0.80 |
167 |
| DMSO |
1.00 |
>2.00 |
>100 |
3.3 Effect on Mannich reactivity
Table 4 shows the lignin reactive sites for Mannich reaction based on C9 formula. The reactive sites for Mannich reaction reduced from 0.36 to 0.18 after OL was purified. It is not clear why the purification process reduced the lignin reactive sites associated with vacant aromatic sites.
Table 4 Mannich reactive sites of OL and TOL
| Lignin |
Elemental composition (wt%) |
C9 formula |
C-3 and C-5 reactive sites/C9 |
| C |
H |
N |
| OL |
57.7 |
6.89 |
2.8 |
C9H12.80N0.37 |
0.36 |
| TOL |
60.32 |
6.28 |
1.4 |
C9H11.16N0.18 |
0.18 |
3.4 Effect on average lignin molecular weights
Table 5 shows average lignin molecular weights and polydispersity index (Mw/Mn). Lignin molecular weights depend on a number of factors including plant type, plant age, and processing methods. The lignin molecular weights obtained in this study were in the range of eucalyptus wood lignins obtained from different processes.21 The Mn of TOL was higher (6.9%) than that of OL due to the removal of a higher proportion of lignin fractions with smaller molecular weights. The purification process slightly decreased the polydispersity index from 2.1 to 2.0. Nevertheless, the polydispersity index was still much higher than 1.0, indicating that the TOL lignins can be further fractionated to produce lignin fragments with similar molecular weights for use in the synthesis of polymers.22
Table 5 Average molecular weights of OL and TOL
| Lignin |
Mw (g mol−1) |
Mn (g mol−1) |
Mw/Mn |
| OL |
10940 |
5163 |
2.1 |
| TOL |
10988 |
5518 |
2.0 |
The molecular weights of these lignins are significantly higher than those reported by others for eucalyptus lignin. Xu and co-workers obtained Mn between 1360 and 2465, and Mw between 1395 and 3050, in which the eucalyptus biomass was treated with ionic liquids and alkaline ethanol.23 Using a dioxane/water mixture as the extraction process, Evtuguin et al. obtained a lignin Mn of 2180.24 Therefore as expected, the type of the pretreatment process has a significant impact on the lignin molecular weight.
3.5 XPS analysis
The surface composition of the OL and TOL was also evaluated using XPS. XPS survey scan spectra of the lignin samples were shown in ESI Fig. 1† while the high resolution multiplex spectra for C 1s and O 1s were shown in ESI Fig. 2 and 3† respectively. The peaks were assigned to different bond linkages25 and the results are summarized in Table 6, which shows that carbon and oxygen are the main components while ∼1% sulfur (S2pSO4) was detected in OL, consistent with the results in Table 1. The C–C (and C–H, C1) linkages and C–O (C2) linkages were the major bonds (each accounting for 32.5–34.5 of atomic%), followed by the O–C–O (O2) linkages (23.7–26.4 of atomic%). The O![[double bond, length as m-dash]](https://www.rsc.org/images/entities/char_e001.gif) C content increased from 0.9% to 1.4%, most likely indicating the presence of MIBK associated with OL. The reduction O–C–O from 26.4% to 23.7% is due to the removal of carbohydrates, while in the increases C–C (and C–H, C1) and C–O (C2) are likely due increase in lignin content as a result of the removal of non-lignin impurities.
C content increased from 0.9% to 1.4%, most likely indicating the presence of MIBK associated with OL. The reduction O–C–O from 26.4% to 23.7% is due to the removal of carbohydrates, while in the increases C–C (and C–H, C1) and C–O (C2) are likely due increase in lignin content as a result of the removal of non-lignin impurities.
Table 6 XPS results of OL and TOL
| Linkage |
Binding energy (eV) |
Atomic% |
| OL |
TOL |
OL |
TOL |
| C–O (O1) |
531.7 |
531.8 |
0.9 |
1.4 |
| O–CO (O2) |
533.3 |
533.5 |
26.4 |
23.7 |
| C–C or/and C–H (C1) |
284.5 |
284.5 |
33.1 |
34.2 |
| C–O (C2) |
286.6 |
286.5 |
32.5 |
34.5 |
| CO or/and O–C–O (C3) |
288.0 |
287.5 |
6.2 |
6.2 |
| S2pSO4 |
169.7 |
— |
1.1 |
— |
3.6 Effect on lignin thermal stability
Fig. 1 shows the lignin thermal stability via TGA. Lignin thermal decomposition occurred in three stages. The first of these stages occurred at a temperature <150 °C, corresponding to the losses of water and volatile components. The second decomposition stage occurred at the temperature range of 150–500 °C with the major products in this stage being coke, organic acid, and phenolic compounds together with gas products.26 In the final stage (over 500 °C), the pyrolytic degradation of lignin, decomposition, and condensation of the aromatic rings occurred.27,28
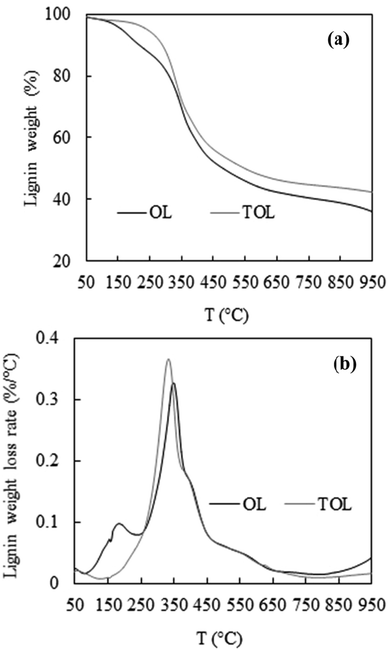 |
| | Fig. 1 (a) TGA and (b) DTG curves of OL and TOL. | |
Fig. 1a shows that the weight loss of OL was significantly higher (8.56%) than that of TOL (3.36%) from 150 °C to 250 °C, indicating that TOL was more stable at a low temperature range of 150–250 °C. From 250 °C to 350 °C, the weight loss of OL was the less (17.67%) than that of TOL (22.25%) while from 350 °C to 500 °C, the weight loss of OL (20.86%) was similar to that of TOL (19.38%). Considering the temperature range of 150–500 °C, the weight loss of OL (47.09%) was higher than that of TOL (44.99%). This possibly was attributed to the removal of thermally unstable lignin impurities.
Fig. 1b shows the lignin weight loss rates of the two lignin samples. There are two peak temperatures for OL (TM) at which lignin decomposed fastest. The first TM for OL was at 184 °C, which is partly associated with hemicellulose decomposition.29 This peak was not present in TOL partly due to the removal of hemicelluloses during the purification process. These results also indicated that the purification process removed the components which can be decomposed (i.e., hemicelluloses) or evaporated more rapidly at the temperature range of <250 °C. The second TM for OL was 351 °C, higher than the only TM for TOL (325 °C), though TOL had a much higher maximum weight loss rate. The reason for this difference is unknown.
The removal of methoxy groups (–OCH3) with the release of methane occurs around 400–600 °C.28 The amount of residue derived from TOL in the temperature range of 400–600 °C was ∼4% higher than that of OL (Fig. 1a), probably indicating similar proportion of methoxy groups in these two lignins.
3.7 FT-IR spectra
The FT-IR spectra of OL and TOL are presented in ESI Fig. 4† and assignments of FTIR spectra peaks were referred to previous publications and summarized in Table 7.13,30–33 The FT-IR spectra of these two lignins were very similar and showed similar trends (ESI Fig. 4†), so subtle differences were obtained from the subtraction spectra (Fig. 2). The subtraction spectra (i.e., the FT-IR spectra of normalized OL – those of TOL) showed increases (i.e., negative peaks below) in peak intensities for the regions 3690–3030 cm−1 and 2960–2820 cm−1 associated with phenolic hydroxyl groups and the C–H stretching in aromatic methoxyl groups, methyl or methylene groups of the side chains. These results suggest that the alkali-acid purification process may have resulted in some cleavage of β–O–4 linkages resulting in the formation of lignin subunits. The small negative peak at 1715–1690 cm−1 is related to CO stretching in unconjugated ketones and conjugated carboxylic groups (Table 7). The negative peaks of 1605 cm−1, 1515 cm−1, and 1440 cm−1 are related to the characteristic vibrations for aromatic structures in lignin clearly indicating an increase in lignin purity as a consequence of treatment.
Table 7 Assignment of FT-IR absorption bands (cm−1)13,30–33
| Wavenumber (cm−1) |
Structure correspondence |
| 3690–3030 |
O–H stretching vibrations and hydrogen bonding in phenolic and aliphatic structures |
| 2960–2820 |
C–H stretching in aromatic methoxyl groups and in methyl or methylene groups of side chains |
| 1715–1690 |
Carbonyl stretching in unconjugated ketones and conjugated carboxylic groups |
| 1605 and 1515 |
Aromatic skeletal vibrations |
| 1460 |
C–H bending of methyl and methylene groups |
| 1425 |
C–H deformation in lignin |
| 1300–1350 |
Syringyl ring breathing with C–O stretching |
| 1250–1280 |
Guaiacyl ring breathing with C–O stretching |
| 1200–1225 |
C–O stretching in both syringyl and guaiacyl rings |
| 1140–1160 |
C–O stretching vibration in cellulose and hemicelluloses |
| 1100–1120 |
C–H in-plane deformation in syringyl ring |
| 1100 |
O–H association band in cellulose and hemicelluloses |
| 10600–1030 |
C–O stretching vibration in cellulose and hemicelluloses |
| 916 and 835 |
Aromatic C–H out-of-plane deformation of syringyl units |
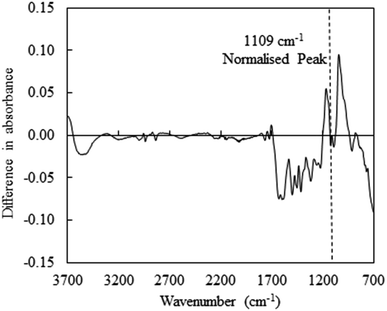 |
| | Fig. 2 Subtracted FT-IR spectra (normalised spectra of OL – those of TOL). | |
The positive peak regions of 1160–1140 cm−1 and 1060–1030 cm−1 are associated with C–O stretching vibration in cellulose and hemicelluloses (Table 7), indicating that OL lignin contained higher amounts of carbohydrates, which was consistent with lignin biomass composition results in Table 2.
3.8 13C NMR spectra
The OL and TOL samples were investigated by solid-state 13C NMR, and structural characteristics determined are shown in Fig. 3 and Table 8. The spectra of these samples can be divided into three regions; the aliphatic region (22–86 ppm), the aromatic region (106–153 ppm), and the carbonyl region (166–192 ppm).34,35 As occurred with the FT-IR spectra, the NMR profiles were similar between the OL and TOL samples, indicating a similar lignin composition. However, as in FT-IR, there were some minor variations in the intensities of some peaks (Fig. 3). The peak at 128 ppm, assigned to p-hydroxyphenyl units, was present as a sharp peak in the TOL sample but as a broader peak in the OL sample. The broader peak may indicate close association with other groups with similar shift value, as is the case of proteins, which are present in significant amounts in OL but are removed from the TOL sample after purification. The peak at 22 ppm is related to CH3 groups in acetylated xylans, which was slightly higher in the OL sample due to a higher proportion of xylan impurity.
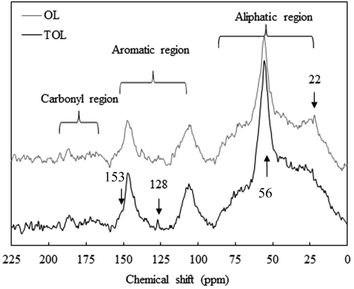 |
| | Fig. 3 13C CPMAS NMR spectra of OL and TOL. | |
Table 8 Assignment of lignin signals in the CPMAS 13C NMR spectra34,35
| 13C shift (ppm) |
Peak assignment |
| 192 |
CO in aromatic aldehyde |
| 175 |
CO in aliphatic acid |
| 170 |
CO in aliphatic ester |
| 166 |
CO in aromatic acid |
| 153 |
C3 and C5 in etherified syringyl |
| 147 |
C3 and C4 in etherified guaiacyl |
| 134 |
C1 in etherified syringyl and guaiacyl |
| 128 |
C2 and C6 in p-hydroxyphenyl |
| 116 |
C5 in guaiacyl and C3 and C5 in p-hydroxyphenyl |
| 106 |
C1 in carbohydrate and C2 and C6 in syringyl |
| 86 |
Cβ in β–O–4-linked unit (threo) |
| 81 |
Cβ in β–O–4-linked unit (erythro) and C4 in 4-O-methylglucuronic acid |
| 74 |
C2 in xylose internal unit and Cα in β–O–4–C linked unit |
| 56 |
Aromatic methoxy group |
| 43 |
Cα methylene with aliphatic substitution |
| 35 |
Cα, in arylpropanol |
| 22 |
CH3 group in acetylated xylan |
3.9 Analysis by Py-GC/MS
The pyrograms of the OL and TOL lignin samples are shown in Fig. 4 and the identities and relative molar abundances of the lignin-derived compounds released are listed in Table 9. The pyrograms of both samples are rather similar indicating a similar lignin composition of OL and TOL, as already observed by FT-IR and 13C-NMR. The pyrograms showed compounds derived from the p-hydroxyphenyl (H), guaiacyl (G) and syringyl (S) lignin units with guaiacol (2), 4-methylguaiacol (5), 4-ethylguaiacol (6), 4-vinylguaiacol (8), syringol (12), 4-methylsyringol (16),4-ethylsyringol (19), 4-vinylsyringol (22) and trans-4-propenylsyringol (27) being the most abundant phenolic compounds. Both samples are enriched in S-lignin units (with S/G ratios around 1.9–2.0) and depleted in H-lignin units (∼1%), as usually occurs in eucalyptus lignins.16,36 Finally, minor amounts of the 3-methoxycatechol (9) were also present, being slightly more abundant in OL than in TOL. This compound might have been formed during the OL isolation process by demethylation of S-units. The data indicate no major structural differences in the lignin polymer in OL and TOL samples, except for the increase of oxidized phenolic compounds released from the TOL sample (from 9.8 to 19.3%), which is in line with the higher oxygen content observed by elemental analysis (Table 1) and suggests oxidation during alkali-acid purification process.
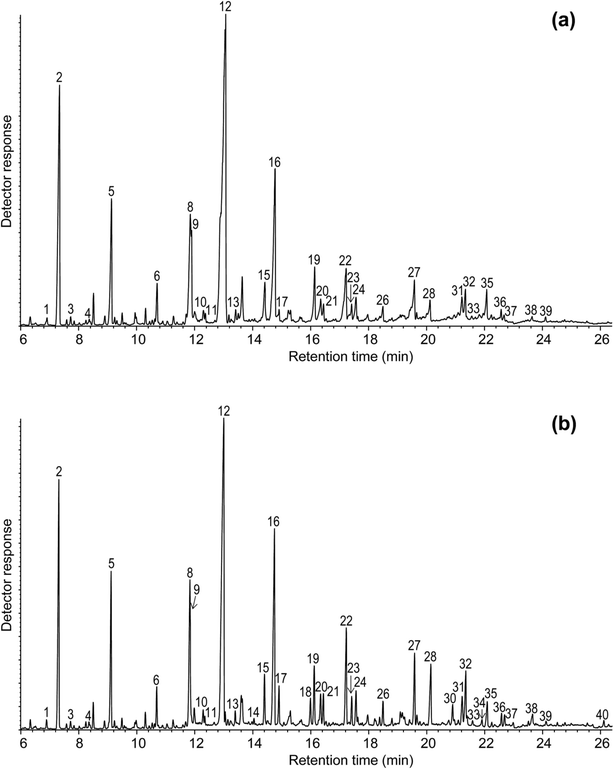 |
| | Fig. 4 Py-GC/MS chromatograms of (a) OL and (b) TOL. The identities and relative abundances of the released phenolic compounds are listed in Table 9. | |
Table 9 Identities and relative molar abundances of the compounds released upon Py-GC/MS of the OL and TOL lignin samples
| |
OL |
TOL |
| 1 |
Phenol |
0.3 |
0.3 |
| 2 |
Guaiacol |
12.6 |
10.2 |
| 3 |
3-Methylphenol |
0.3 |
0.3 |
| 4 |
4-Methylphenol |
0.2 |
0.1 |
| 5 |
4-Methylguaiacol |
5.7 |
6.0 |
| 6 |
4-Ethylguaiacol |
1.5 |
1.4 |
| 7 |
4-Vinylphenol |
0.1 |
0.1 |
| 8 |
4-Vinylguaiacol |
2.8 |
2.8 |
| 9 |
3-Methoxycatechol |
6.3 |
4.4 |
| 10 |
Eugenol |
0.5 |
0.6 |
| 11 |
4-Propylguaiacol |
0.3 |
0.3 |
| 12 |
Syringol |
35.6 |
27.1 |
| 13 |
cis-Isoeugenol |
0.5 |
0.6 |
| 14 |
trans-4-Propenylphenol |
0.1 |
0.2 |
| 15 |
trans-Isoeugenol |
2.1 |
2.0 |
| 16 |
4-Methylsyringol |
9.7 |
11.1 |
| 17 |
Vanillin |
0.4 |
1.6 |
| 18 |
Homovanillin |
0.0 |
1.2 |
| 19 |
4-Ethylsyringol |
2.4 |
2.4 |
| 20 |
Vanillic acid methyl ester |
1.6 |
1.4 |
| 21 |
Acetovanillone |
0.8 |
1.2 |
| 22 |
4-Vinylsyringol |
3.7 |
4.5 |
| 23 |
Guaiacylacetone |
1.2 |
1.0 |
| 24 |
4-Allylsyringol |
0.5 |
0.7 |
| 25 |
4-Propylsyringol |
0.8 |
0.8 |
| 26 |
cis-Propenylsyringol |
0.7 |
0.9 |
| 27 |
trans-Propenylsyringol |
3.1 |
3.0 |
| 28 |
Syringaldehyde |
1.4 |
3.1 |
| 29 |
Dihydroconiferyl alcohol |
0.2 |
0.4 |
| 30 |
Homosyringaldehyde |
0.0 |
1.0 |
| 31 |
Syringic acid methyl ester |
1.1 |
1.4 |
| 32 |
Acetosyringone |
1.2 |
2.5 |
| 33 |
trans-Coniferyl alcohol |
0.3 |
0.2 |
| 34 |
Coniferaldehyde |
0.0 |
1.2 |
| 35 |
Syringylacetone |
1.3 |
1.3 |
| 36 |
Propiosyringone |
0.3 |
0.5 |
| 37 |
Syringyl vinyl ketone |
0.2 |
0.5 |
| 38 |
Syringic acid |
0.3 |
0.8 |
| 39 |
Dihydrosinapyl alcohol |
0.2 |
0.2 |
| 40 |
trans-Sinapaldehyde |
0.0 |
0.4 |
| |
H (%) |
0.9 |
1.0 |
| |
G (%) |
30.3 |
32.2 |
| |
S (%) |
62.5 |
62.3 |
| |
3-Methoxycatechol (%) |
6.3 |
4.4 |
| |
S/G ratio |
2.0 |
1.9 |
| |
CO compounds |
9.8 |
19.3 |
3.10 2D-NMR spectra
Additional information regarding the structure of the OL and TOL lignins was obtained from 2D-NMR. The HSQC spectra of the OL and TOL are presented in Fig. 5. The main lignin cross-signals are assigned in Table 10, while the main lignin structures found are also depicted in Fig. 5. The detailed 2D-NMR characteristic of the lignins from eucalyptus wood has been described previously,16 which are composed mainly of β–O–4′ alkyl-aryl ethers, β–β resinols and with minor amounts of β–5′ phenylcoumarans. However, the only lignin inter-unit linkages observed in the OL and TOL lignin samples were β–β resinol structures (C), while basically no β–O–4′ alkyl-aryl ethers nor β–5′ phenylcoumaran structures could be detected. This indicates that the native eucalyptus lignin has been completely hydrolysed during the OL isolation process. In the aromatic region, a strong signal for C2,6–H2,6 correlations of syringyl units (S), together with a signal for the C2,6–H2,6 correlations of Cα-oxidized syringyl units (S′) and a signal ascribed to the C5–H5 and C6–H6 correlations of guaiacyl units (G) were observed. In general terms, the HSQC spectra of OL and TOL were almost identical, which indicates that both lignin samples present a similar lignin structure and that the alkali-acid precipitation process did not produce any major effect in the lignin structure, as already observed by other analytical techniques, including Py-GC/MS. However, and in contrast to what was observed by Py-GC/MS, the HSQC spectra did not show any evidence for lignin oxidation in the TOL sample, probably because the slightly oxidation is below the detection limit of the technique.
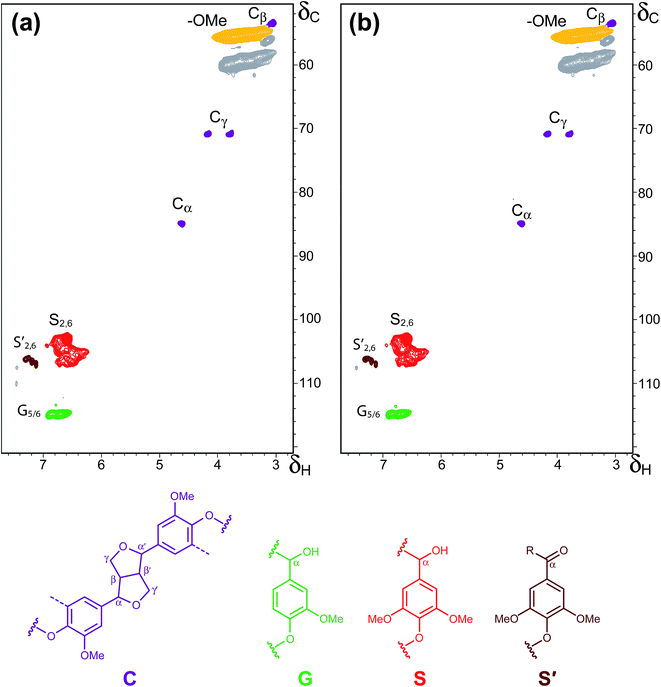 |
| | Fig. 5 2D HSQC NMR spectra of (a) OL, and (b) TOL. The main lignin structures identified are also depicted: (C) resinols; (G) guaiacyl units; (S) syringyl units; (S′) Cα-oxidized syringyl units. See Table 10 for signal assignments. | |
Table 10 Assignment of lignin signals in the 1H–13C 2D HSQC NMR spectra
| Label |
δC/δH |
Assignment |
| Cβ |
53.5/3.05 |
Cβ–Hβ in β–β′ resinol substructures (C) |
| –OCH3 |
55.6/3.73 |
C–H in methoxyls |
| Cγ |
71.0/3.83 and 4.19 |
Cγ–Hγ in β–β′ resinol substructures (C) |
| Cα |
84.7/4.64 |
Cα–Hα in β–β′ resinol substructures (C) |
| S2,6 |
103.7/6.68 |
C2–H2 and C6–H6 in syringyl units (S) |
| S′2,6 |
106.3/7.32 and 7.20 |
C2–H2 and C6–H6 in Cα-oxidized syringyl units (S′) |
| G5/G6 |
115.0/6.74 |
C5–H5 and C6–H6 in guaiacyl units (G) |
The results obtained with 2D-NMR further confirm that the solvent used in lignin isolation greatly influences the type of lignin substructures and the type of linkages. The co-authors of the present study previously reported the presence of additional lignin substructures of the types A (β-ether structure formed by β–O–4′ linkages), B (resinol structure including β–β′), D (spirodienone structures including β–1′) and F (Cα-oxidized β–O–4′ structure) units when dioxane/water (9:1, v/v) mixture was used in the lignin isolation process.37 In another study on eucalyptus lignin isolated by a dioxane/water (9:1, v/v) mixture containing 0.2 M hydrogen chloride, only A, B and C substructures were identified. The use of imidazolium ionic liquids and NaOH isolation procedure were found to produce in addition as those substructures identified in the present study, A, and B lignin substructures.38
On the basis of the type of lignin substructures isolated in the present study with the MIBK/water mixture in the presence of dilute acid, it is therefore not surprising that the work conducted by the authors on the depolymerisation of the lignin produced syringol in high yields.11,39
4. Conclusions
OL was treated by alkali-acid precipitation process, which improved its purity and enhanced its solubility in several organic solvents. The lignin composition remained largely unchanged after purification, although a relatively higher proportion of oxidized lignin units were present in the purified sample, suggesting some lignin oxidation during alkali-acid purification process. The purified sample was less stable than the untreated lignin at temperatures higher than 250 °C, although it was of slightly higher molecular weight.
Acknowledgements
The authors would to thank Dr Mark Wellard and Wanda Stolz (Queensland University of technology) for their assistance in lignin characterization (13C-NMR, Klason lignin and lignin molecular weights). We also thank Dr Manuel Angulo for performing the 2D-NMR analyses that were acquired in a Bruker Advance III 500 MHz instrument from the NMR facilities of the General Research Services of the University of Seville (SGI-CITIUS). We would also like to express our sincere appreciation of the Royal Golden Jubilee scholarship (RGJ) (Thailand), Thailand Research Fund (Thailand), and Queensland University of Technology (QUT, Australia) for financing this project.
References
- J. H. Lora and W. G. Glasser, J. Polym. Environ., 2002, 10, 39–48 CrossRef CAS.
- X. F. Sun, F. Xu, R. C. Sun, Y. X. Wang, P. Fowler and M. S. Baird, Polym. Degrad. Stab., 2004, 86, 245–256 CrossRef CAS.
- C. Vila, V. Santos and J. C. Parajó, Ind. Eng. Chem. Res., 2002, 42, 349–356 CrossRef.
- M. González, Á. Tejado, C. Peña and J. Labidi, Ind. Eng. Chem. Res., 2008, 47, 1903–1909 CrossRef.
- A. Johansson, O. Aaltonen and P. Ylinen, Biomass, 1987, 47, 1903–1909 Search PubMed.
- J. Zakzeski, P. C. A. Bruijnincx, A. L. Jongerius and B. M. Weckhuysen, Chem. Rev., 2010, 110, 3552–3599 CrossRef CAS PubMed.
- J. J. Bozell, S. K. Black, M. Myers, D. Cahill, W. P. Miller and S. Park, Biomass Bioenergy, 2011, 35, 4197–4208 CrossRef CAS.
- T. Klamrassamee, V. Champreda, V. Reunglek and N. Laosiripojana, Bioresour. Technol., 2013, 147, 276–284 CrossRef CAS PubMed.
- R. J. Sammons, D. P. Harper, N. Labbe, J. J. Bozell, T. Elder and T. G. Rials, Bioresources, 2013, 8, 2752–2767 CrossRef.
- A. K. Deepa and P. L. Dhepe, RSC Adv., 2014, 4, 12625–12629 RSC.
- T. Klamrassamee, N. Laosiripojana, D. Cronin, L. Moghaddam, Z. Zhang and W. O. S. Doherty, Bioresour. Technol., 2015, 180, 222–229 CrossRef CAS PubMed.
- P. Mousavioun and W. O. S. Doherty, Ind. Crops Prod., 2010, 31, 52–58 CrossRef CAS.
- L. Moghaddam, Z. Zhang, R. M. Wellard, J. P. Bartley, I. M. O'Hara and W. O. S. Doherty, Biomass Bioenergy, 2014, 70, 498–512 CrossRef CAS.
- A. Sluiter, B. Hames, R. Ruiz, C. Scarlata, J. Sluiter and D. Templeton, Determination of structural carbohydrates and lignin in biomass, National Renewable Energy Laboratory, Golden, Colrado, 2012 Search PubMed.
- X.-J. Pan and Y. Sano, J. Wood Sci., 1999, 45, 319–325 CrossRef CAS.
- J. Rencoret, G. Marques, A. Gutiérrez, D. Ibarra, J. Li, G. Gellerstedt, J. I. Santos, J. Jiménez-Barbero, A. T. Martínez and J. C. del Rio, Holzforschung, 2008, 62, 514–526 CrossRef CAS.
- O. Faix, D. Meier and I. Fortmann, Holz Roh–Werkst., 1990, 48, 351–354 CrossRef CAS.
- J. Ralph and R. D. Hatfield, J. Agric. Food Chem., 1991, 39, 1426–1437 CrossRef CAS.
- S. Laurichesse and L. Avérous, Prog. Polym. Sci., 2014, 39, 1266–1290 CrossRef CAS.
- R. J. A. Gosselink, A. Abacherli, H. Semke, R. Malherbe, P. Kauper, A. Nadif and J. E. G. van Dam, Ind. Crops Prod., 2004, 19, 271–281 CrossRef CAS.
- A. Tolbert, H. Akinosho and R. Khunsupat, Biofuels, Bioprod. Biorefin., 2014, 8, 836–856 CrossRef CAS.
- N. E. E. Mansouri and J. Salvadó, Ind. Crops Prod., 2006, 24, 8–16 CrossRef.
- J. K. Xu, Y. C. Sun and R. C. Sun, Process Biochem., 2015, 50, 955–965 CrossRef CAS.
- D. V. Evtuguin, C. P. Neto, A. M. S. Silva, P. M. Domingues, F. M. L. Amado, D. Robert and O. Faix, J. Agric. Food Chem., 2001, 49, 4252–4261 CrossRef CAS PubMed.
- P. Nzokou and D. P. Kamdem, Surf. Interface Anal., 2005, 37, 689–694 CrossRef CAS.
- N. Shukry, S. M. Fadel, F. A. Agblevor and S. F. El-Kalyoubi, J. Appl. Polym. Sci., 2008, 109, 434–444 CrossRef CAS.
- M. Brebu, T. Tamminen and I. Spiridon, J. Anal. Appl. Pyrolysis, 2013, 104, 531–539 CrossRef CAS.
- H. Yang, R. Yan, H. Chen, D. H. Lee and C. Zheng, Fuel, 2007, 86, 1781–1788 CrossRef CAS.
- V. R. Maliger, W. O. S. Doherty, R. L. Frost and P. Mousavioun, Ind. Eng. Chem. Res., 2011, 50, 791–798 CrossRef CAS.
- R. El Hage, N. Brosse, L. Chrusciel, C. Sanchez, P. Sannigrahi and A. Ragauskas, Polym. Degrad. Stab., 2009, 94, 1632–1638 CrossRef CAS.
- N. Labbe, T. G. Rials, S. S. Kelley, Z. M. Cheng, J. Y. Kim and Y. Li, Wood Sci. Technol., 2005, 39, 61–77 CrossRef CAS.
- S. N. Sun, M. F. Li, F. Xu and R. C. Sun, Ind. Crops Prod., 2013, 43, 570–577 CrossRef CAS.
- A. K. Chandel, F. F. A. Antunes, V. Anjos, M. J. V. 'Bell, L. N. Rodrigues, O. V. Singh, C. A. Rosa, F. C. Pagnocca and S. S. da Silva, Biotechnol. Biofuels, 2013, 6, 4 CrossRef CAS PubMed.
- G. Almendros, A. T. Martinez, A. E. Gonzalez, F. J. Gonzalez-Vila, R. Fruend and H. D. Luedemann, J. Agric. Food Chem., 1992, 40, 1297–1302 CrossRef CAS.
- R. K. Sharma, J. B. Wooten, V. L. Baliga, X. Lin, W. G. Chan and M. R. Hajaligol, Fuel, 2004, 83, 1469–1482 CrossRef CAS.
- P. Prinsen, A. Gutierrez, J. Rencoret, L. Nieto, J. Jimenez-Barbero, A. Burnet, M. Petit-Conil, J. L. Colodette, A. T. Martinez and J. C. del Rio, Ind. Crops Prod., 2012, 36, 572–583 CrossRef CAS.
- J. Rencoret, P. Prinsen, A. Gutierrez, A. T. Martinez and J. C. del Rio, J. Agric. Food Chem., 2015, 63, 603–613 CrossRef CAS PubMed.
- M. G. Aguayo, J. Ruiz, M. Norambuena and R. T. Mendonca, Maderas: Cienc. Tecnol., 2015, 17, 625–636 Search PubMed.
- T. Klamrassamee, N. Laosiripojana, K. Faungnawakij, L. Moghaddam, Z. Y. Zhang and W. O. S. Doherty, RSC Adv., 2015, 5, 45618–45621 RSC.
Footnotes |
| † Electronic supplementary information (ESI) available. See DOI: 10.1039/c6ra20081h |
| ‡ Co-first authors. |
|
| This journal is © The Royal Society of Chemistry 2016 |
Click here to see how this site uses Cookies. View our privacy policy here. 


