A review on Mn4+ activators in solids for warm white light-emitting diodes

Daqin Chen *, Yang Zhou and Jiasong Zhong
College of Materials & Environmental Engineering, Hangzhou Dianzi University, Hangzhou, 310018, P. R. China. E-mail: dqchen@hdu.edu.cn

Received 3rd August 2016 , Accepted 5th September 2016

First published on 5th September 2016


Abstract

Currently, the major commercial white light-emitting diodes consist of a blue-emitting chip and Y3Al5O12:Ce3+ yellow phosphor. However, the shortage of a red emitting component in the constructed device makes it difficult to realize warm white light with a high color-rendering index and low correlated color temperature. In this mini-review article, we provide an overview of recent progresses in developing Mn4+ doped red phosphors for promising applications in warm white light-emitting diodes. Firstly, the spectroscopic properties of Mn4+ in solids, including electronic and vibronic energy-level structures, crystal-field parameters as well as thermal stability, were briefly discussed. And then the related physical and chemical synthesis strategies were introduced in detail. Afterwards, Mn4+ doped phosphors, such as oxides, fluorides as well as glass ceramic composites, and their impact on improving the photoelectric performance of white light-emitting diodes were summarized. Finally, several challenges and perspectives for exploring novel and high-performance Mn4+ doped red phosphors will be presented.
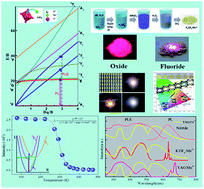

image file: c6ra19584a-p1.tif

Daqin Chen

Daqin Chen is a professor of Materials Science at Hangzhou Dianzi University (HDU). He obtained his Bachelor (2001) and Master (2004) degrees in Materials Science and Engineering from Central South University, P. R. China, and received his Ph.D degree (2008) in Condensed Matter Physics from Fujian Institute of Research on the Structure of Matter (FJIRSM), Chinese Academy of Science. Since then, he has been working as an assistant, associate and full professor in FJIRSM (2008–2014). After that, he joined HDU as a full professor. His current research interests mainly concern luminescent materials (including nanoparticles, phosphors and glass ceramic composites) targeting at sensor, PV and LED applications. He has published over 100 peer-reviewed scientific papers in the field of luminescent materials, and has more than 3000 citations.

image file: c6ra19584a-p2.tif

Yang Zhou

Yang Zhou is a Master student at Hangzhou Dianzi University under the supervision of Prof. Daiqn Chen. He obtained his Bachelor degree in Materials and Chemical Engineering from Chongqing University of Arts and Sciences, P. R. China in 2014. His research interests mainly focus on novel Mn4+ doped red phosphors for warm WLEDs.

image file: c6ra19584a-p3.tif

Jiasong Zhong

Jiasong Zhong is an assistant professor of Materials Science at Hangzhou Dianzi University (HDU). He received Ph.D. degree (2014) in Materials Science and Engineering from Tongji University, P. R. China. After that, he joined the group of Prof. Daqin Chen as an assistant professor. His research interests include nonlinear quantum dot glasses and Mn4+ doped red phosphors for warm WLEDs.


Introduction

Over the years, white light-emitting diodes (WLEDs) have been paid increasing attention due to the advantages over traditional incandescent or fluorescent lightings such as high luminous efficiency, long persistence, energy saving and therefore environmental benefits etc.1–4 The commercial strategy for WLED is mainly based upon the combination of LED chips with red/green/blue (RGB) tricolor phosphors. Nowadays, the commercial and most popular approach is the conjunction of the InGaN blue LED (typically showing an emission wavelength between 450 and 480 nm) with Y3Al5O12:Ce3+ (YAG:Ce3+) yellow phosphors. However, YAG:Ce3+ exhibits weak emission in the red spectral region, and this makes it difficult to realize warm WLEDs with a high color-rendering index (CRI, Ra > 80) and low correlated color temperature (CCT < 4500 K).5,6 In order to generate the white light with the warm perception similar to incandescent light, one of the best routes is to mix a highly efficient red phosphor showing strong blue absorption with YAG:Ce3+ yellow phosphor.

Currently, the searching of red phosphors is mainly based on rare-earth-doped strategy, and the most successfully materials are the Eu2+- or Ce3+-doped oxynitride and nitride phosphors, typically commercial Eu2+:CaAlSiN3 and Eu2+:Sr2Si5N8.7,8 Unfortunately, it is well known that most of rare earth ions are costly and some rare-earth chlorides/citrates are even toxic and harmful.9 Furthermore, the synthesis of (oxy)nitrides has to be performed at high temperature and high pressure, for example at 1900 °C and 1 MPa N2 atmosphere, which limits their practical applications in WLEDs.4,7 On the other hand, semiconductor quantum dots (QDs) have recently been regarded as the potential replacement for the rare-earth doped phosphors owing to their relatively narrow emission bands (25–60 nm) and broadband absorption.10–16 However, several issues, including the improvement of chemical/thermal/photo-stability, the development of Cd-free QDs and the avoidance of instinct self-absorption effect, are still required to be well solved for their practical application in WLEDs.17 Therefore, considerable efforts have been devoted to the development of the non-rare-earth-based phosphors usable in warm WLEDs.

Among several transition metal ions, Mn4+ is a suitable activator for red phosphors as the dominant spin-forbidden 2E → 4A2 transition of Mn4+ is usually located in the red spectral region owing to its high effective positive charge and thus the influence of strong local crystal-field.18 In general, Mn4+ luminescence exhibits both broad excitation bands in the ultraviolet-blue region and sharp emission lines, which makes Mn4+ doped red phosphors excitable by blue chips and lessens the re-absorption effect when mixing with other green or yellow phosphors.4,19 These unique optical features meet the requirement of an ideal red phosphor for warm LEDs. Moreover, the cheap and easy-to-obtain manganese raw materials are beneficial to reduce the cost of red phosphors. As a consequence, many researchers have focused on developing the Mn4+ activated red phosphors, especially, Mn4+ doped oxides and fluorides, which can be prepared under milder conditions and are cost-effective for commercial applications. Through appropriately modifying the crystal-field environments, the spectral position of Mn4+ 2Eg4A2g transition can be easily tuned over a wide range from 620 nm to 723 nm.

In this feature article, we try to make a general survey on the recent progresses of Mn4+ doped red phosphors for warm WLEDs. This differs from previously published mini-reviews written by M. G. Brik et al., reporting the spectroscopic features of Mn4+ ion from the perspective of theoretical analysis.18,20 Firstly, we discussed the optical parameters of Mn4+ activators in the octahedral crystal field of solids, followed by the introduction of both physical and chemical synthesis strategies for Mn4+ red phosphors. Then the optical performance of Mn4+ doped oxide and fluoride red phosphors and potential application in warm WLEDs were summarized. Finally, the related challenges and perspectives will be pointed out.

Mn4+ ions in solids

The understanding of electronic and vibronic energy-level structures of Mn4+ in solids is essential for the design of Mn4+-based red phosphors. There are 120 possibilities to distribute the 3d3 electrons of Mn4+ in the five d-orbitals and the electrostatic interactions among these electrons result in eight LS-coupling free-ion terms, i.e., 4F ground state and 4P, 2G, 2P, 2D(1), 2F, 2D(2), 2H excited states. When Mn4+ ions are doped into the crystal lattice, these LS-coupling terms will be split into several energy levels, which highly depend on the local site symmetry of Mn4+. For example, detailed energy levels of Mn4+ at site symmetries of Oh and D3d were deduced and plotted in Fig. 1a.4,18 After considering the spin–orbit interaction, it can be seen that all these energy levels can further split into several sublevels. Typically, both 4A2 ground state and 2E emitting-state split into two sublevels, and emissions from lower and upper sublevels of 2E were named as R1 and R2 zero phonon lines (ZPLs), respectively.
image file: c6ra19584a-f1.tif
Fig. 1 (a) Energy level splitting of Mn4+ ions at the crystallographic site of D3h symmetry with the effect of spin–orbit interaction. (b) Tanabe–Sugano diagram for the d3 electron configuration in the octahedral crystal field; inset schematically shows Mn4+ ion locating in octahedral site of host. (c) RT PL (λex = 460 nm) and PLE (λem = 630 nm) spectra of K2SiF6:Mn4+ phosphor, the calculated ZPL and vibration sidebands are also provided. (d) Low-temperature (3–30 K) high-resolution PL spectra of K2TiF6:Mn4+ phosphor, inset is the enlarged R1 ZPL at 3 K (reproduced from ref. 4 and 22 with permission from Nature Publishing and the Electrochemical Society).

Generally, Mn4+ emitting center prefers to stay in the octahedral or modified octahedral site of host owing to the strong ligand-field stabilization energy of Mn4+ in the 6-fold coordination. In the ideal octahedral site, the dependence of Mn4+ energy levels on crystal-field (CF) strength can be well illustrated by Tanabe–Sugano (T–S) energy diagram (Fig. 1b).21 Notably, the energies of most multiplets are strongly related to the CF strength except 2T1 and 2E states. Room temperature (RT) photoluminescence (PL) and PL excitation (PLE) spectra of Mn4+ are well known, as shown in Fig. 1c.22,23 Two intense broad excitation/absorption bands, assigned to spin-allowed 4A24T1 and 4A24T2 transitions of Mn4+, are observed. Upon excitation into 4T1 and 4T2 states, electrons in these intermediate states will non-radiatively relax to 2E one, from which sharp emission lines, assigned to spin-forbidden 2E → 4A2 transition, are detected.

In addition, it is found that the two excitation bands recorded at RT consists of a number of components with a spacing of a few hundred kaysers. Such phonon replica-like structure can be well understood as a vibronic progression of the fundamental frequency combined with an unsymmetrical vibration of the octahedron of host superimposed on the electronic transition. The intensity of the nth order vibration sideband, Iexn, is related to that of the ZPL, Iex0, by the expression23,24

 
image file: c6ra19584a-t1.tif(1)
where [n with combining macron] is the average phonon (local vibration) number. The vertical bars in Fig. 1c are the estimated results using eqn (1) with [n with combining macron] = 4 and 7 for 4A24T1 and 4A24T2 transitions, respectively. This analysis can determine the ZPL (n = 0) energy. The 2Eg4A2 energy separation is close to the 2G → 4F energy interval of the free ion and the energies of the free ion electrostatic terms are determined by the Racah parameters B and C. Low temperature (3–30 K) high-resolution PL spectra (Fig. 1d) clearly evidence the dominant phonon-coupled vibronic transitions, i.e., phonon sidebands of Mn4+ in solid.4 As theoretical predicted in Fig. 1a, R1 and R2 ZPLs of the 2E → 4A2 transition are observed at 30 K, and the luminescence of R2 line (hot band) gradually weakens with decrease of temperature and finally disappears at 3 K owing to the thermal deexcitation from upper sublevel of Mn4+:2E.

Table 1 lists the values of the related parameters ([n with combining macron], ZPL, E2E→4A2 and Dq) coming from different fluoride phosphors. The outer 3d → 3d transition of Mn4+ is sensitive to local crystal-field environments in the host and can be tuned by various substitutions. Therefore, the emission of Mn4+ could cover the entire red light region in solid. The local crystal-field strength Dq can be determined by the mean peak energy of the 4A24T2 transition according to the following equation4,9,21

 
image file: c6ra19584a-t2.tif(2)

Table 1 The spectroscopic parameters of Mn4+ in different fluoride phosphors. [n with combining macron] represents phonon number, ZPL is the zero-phonon line, E2E→4A2 is the energy of the Mn4+ 2E level, and Dq is the crystal field strength
Host Crystal structure [n with combining macron] ZPL (eV) E2E→4A2 (eV) Dq (cm−1) Ref.
c-K2MnF6 Cubic 3 10 2.57 2.90 1.99 2070 25
K2SiF6 Cubic 4 7 2.52 3.09 2.00 2030 26
KNaSiF6 Orthorhombic 3 9 2.52 2.93 2.00 2030 27
Na2SiF6 Trigonal 4 9 2.44 2.90 2.01 1970 28
K2GeF6 Trigonal 4 11 2.44 2.80 1.99 1970 29
BaSiF6 Trigonal 4 9 2.43 2.86 1.99 1960 30
K2SnF6 Orthorhombic 4 9 2.42 2.87 2.0 1950 31
BaTiF6 Trigonal 4 9 2.42 2.84 1.99 1950 32
Na2SnF6 Tetragonal 4 9 2.39 2.38 2.00 1930 33
Cs2SnF6 Trigonal 4 10 2.83 2.76 1.99 1920 33
h-KMnF6 Hexagonal 6 13 2.37 2.67 2.00 1910 23


On the basis of the peak energy difference between the 4A24T2 and 4A24T1 transitions, the Racah parameter B can be evaluated from the expression

 
image file: c6ra19584a-t3.tif(3)
where the parameter x is defined as
 
image file: c6ra19584a-t4.tif(4)

According to the peak energy of 2Eg4A2g derived from the emission spectrum, the Racah parameter C can be calculated by the expression

 
E(2Eg4A2g)/B = 3.05C/B + 7.9 − 1.8B/Dq (5)

The thermal stability is important in ensuring a high efficiency of phosphor-converted devices as phosphors usually suffer from the impact of aggregated heat emitted from LED chip. Higher thermal stability generally improves the lifetime of WLED. Fig. 2a depicts the typical temperature-dependent PL spectra. The decrease in emission intensity with elevation of temperature can be explained by thermal quenching at the configurational coordinate diagram (Fig. 2b). The thermal quenching activation energy is usually expressed by the following equation34,35

 
image file: c6ra19584a-t5.tif(6)
where I0 and IT are the initial emission intensity and the luminescent intensity at temperature T, respectively, c is a constant, Ea is the quenching activation energy and k is Boltzmann constant. The experimental data can be well-fitted by eqn (6), as demonstrated in Fig. 2b. The value of Ea reflects the thermal stability of phosphors, and the higher the quenching activator energy, the better the thermal stability.


image file: c6ra19584a-f2.tif
Fig. 2 (a) Typical temperature-dependent emission spectra of Y3Al5O12:Mn4+ red phosphor. (b) Integrated red PL intensity of Mn4+ as a function of temperature. Solid line represents the fitting result. Inset is the configurational coordinate diagram of Mn4+ in YAG host, showing the possible thermal quenching process (reproduced from ref. 21 with permission from Royal Society of Chemistry).

Synthetic strategy

Currently, the solid-state reaction method and wet chemical route were widely adopted to synthesize the Mn4+ red emitting phosphors.32,34,36,37 Mn4+ activated oxide red phosphors were usually prepared by solid-state reaction and the sintered temperature maintained above 1000 °C. The starting materials of solid-state reaction were powders. The powders were weighed according to the desired ratio and mixed with an appropriate amount of ethanol in an alumina mortar with a pestle. After drying, the powder mixture was pressed into a block, which was placed on an alumina plate and heated at specific temperature in air using an electric furnace. Mn4+ activated fluoride red phosphors were usually prepared through a convenient chemical route. In general, KMnO4 was firstly added to HF solution to synthesis K2MnF6 precursor. Then, K2MnF6 and adding SiO2 reacted in HF solution to gain K2SiF6:Mn4+ phosphors. The reactants, such as KMnO4 and SiO2, could be replaced for synthesizing diverse fluoride phosphors.

The synthesis process of solid-state reaction is simple and convenient and could produce in enormous quantities, but suffers from the compositional uncertainty of phosphors and the existence of impurity phases due to partial evaporation of some components during high temperature reaction. In addition, the particle size is usually large and inhomogeneous. Wet chemical method provides an alternative approach to synthesis Mn4+ red phosphors. It has several advantages over solid-state reaction: lower processing temperature, easier composition control, and better chemical homogeneity of the product. However, the synthetic approach may be not practical for the low-cost mass production and has problems in controlling the valence states of manganese in the host. Moreover, surface inorganic/organic defects of phosphors could result in low luminescence efficiency.

Fig. 3a exhibits the most common chemical method to prepare K2SiF6:Mn4+. Pure SiO2 powders were dissolved in HF at room temperature for 2 hours to form the H2SiF6 solution. A stoichiometric amount of KMnO4 was dissolved in the H2SiF6 solution. After the color of the solution changed from colorless to a deep purple, H2O2 was added drop-by-drop, and subsequently the yellow precipitates of K2SiF6:Mn4+ were achieved. After completion of the reaction, the powders were filtered and dried at 80 °C in the oven.38–40 The overall chemical reaction of K2SiF6:Mn4+ can be described as22,41,42

SiO2 + 4KMnO4 + 12HF → K2SiF6 + K2MnF6 + 3MnO2 + 6H2O + 3O2


image file: c6ra19584a-f3.tif
Fig. 3 (a) Schematic diagram of the routine wet chemical synthesis process of K2SiF6:Mn4+ phosphors. (b) Schematic illustration of the cation exchange procedure for synthesizing Mn4+-activated fluoride compounds (reproduced from ref. 4 and 38 with permission from Royal Society of Chemistry and Nature Publishing).

Notably, the main difficulty for synthesizing Mn4+ activated fluoride compounds lies in that manganese has diverse valence states and its valence states often change during synthesis, resulting in undesired by-products.

Recently, a novel cation exchange procedure (Fig. 3b) was provided to prepare highly efficient K2TiF6:Mn4+ red phosphor and other Mn4+ doped fluorides (K2SiF6:Mn4+, NaGdF4:Mn4+, NaYF4:Mn4+) by X. Y. Chen, et al.4 The preparation was carried out by simply mixing K2TiF6 host with a small volume of HF solution dissolved with K2MnF6 powders. After stirring, a muddy mixture was formed, and then heated for a period time, which afforded the final product of K2TiF6:Mn4+. The strategy based on cation exchange shows two distinct advantages: (1) the consumption of HF is far lower than that of cocrystallization method, being beneficial for the waste processing of hazard HF; (2) the synthetic duration is obviously shortened and the reaction process is well controllable, being crucial for mass production.

In addition, J. Wang et al. reported a green synthetic route to prepare narrow red emitting K2SiF6:Mn4+ phosphors without the usage of toxic and volatile HF solution.43 They show that K2SiF6:Mn4+ can be produced in common low-toxic H3PO4/KHF2 liquid instead of high-toxic HF one. Firstly, it needs to synthesize soluble manganese(IV) (MnL2, L = HPO42−). Then, SiO2, KHF2 and as-prepared MnL2 solution were thoroughly mixed, sealed up in a stainless steel autoclave and reacted at 180 °C for 6 hours to obtain K2SiF6:Mn4+ red phosphor.

Finally, sol–gel method, showing several advantages, such as good mixing of starting materials, relatively low reaction temperature and more homogeneous products,44–46 is also an efficient technique for preparing Mn4+ doped red phosphor. For example, magnesium titanate Mg2TiO4:Mn4+ was successfully synthesized via a sol–gel route by using butyl titanate and magnesium nitrate ethanol solution as reagents.44 Typically, a solution of butyl titanate precursor in acetic acid was added into an ethanol solution of magnesium nitrate and manganese nitrate. After stirring at a certain temperature in a water-bath, the formed yellow solution was dried and then calcined to obtain final products.

Mn4+-Activated oxide/fluoride red phosphors

Compared to the ionic nature of metal–F-bonds, the oxide hosts with strong covalence, low thermal vibration, and weak polarizability are favorable to achieve red emission.66 Fig. 4a shows typical PLE and PL spectra of YAG:Mn4+ red phosphor. PL spectrum exhibits two emission bands centered at 646 and 673 nm owing to the Mn4+ spin-forbidden 2E → 4A2 transition. PLE spectrum monitored at 673 nm emission consists of two strong excitation peaks centered at 352 and 480 nm, respectively, assigning to 4A24T1 and 4A24T2 transitions of Mn4+.21 Apart from different emission/excitation peak positions, similar PL and PLE spectra can be observed for other Mn4+ doped oxide phosphors.19,34,36,44,47–66 Table 2 collects a summary of the spectroscopic data, including excitation/emission wavelength and quantum efficiency (QE), for the Mn4+ ions in a number of crystalline solids. In fluorides the energy of the 2Eg level exhibits a restricted variation from 626 nm to 635 nm with an average value of 15[thin space (1/6-em)]873 cm−1 (630 nm). In oxides, however, the energy of the 2Eg level varies widely from 652 nm to 713 nm with an average value of 14[thin space (1/6-em)]858 cm−1 (673 nm). In more covalent hosts, the strong nephelauxetic effect makes the levels of oxide split more seriously than fluorides. Therefore, the emission wavelengths of oxides have a wider variation range and larger value. The data tabulated in Table 2 are grouped in such a way that all fluoride matrices are listed after the oxides. It becomes immediately clear that the 2Eg level in fluorides is at considerably higher energy than in oxides. As we all know, the Mn4+ activators prefer to occupy octahedral site. In oxide host, Mn4+ substitutes the cations, such as Al3+, Si4+, Zr4+, Ti4+, Ge4+ and so on, in the centre of octahedron. Charge compensations are required when Mn4+ ions substitutes the cations with different valences, such as Al3+. Therefore the charge compensating dopants were required to improve the luminescence of phosphors. Mg2+ as a kind of effective charge compensator was systematically investigated. Fig. 4b exhibits the proposed mechanism of Mg2+ as charge compensator to enhance the phosphor luminescence. Mn4+–Mg2+ pairs will be formed to replace Al3+–Al3+ pairs without the requirement of charge compensation and additional oxygen ions. Mg2+ ions can not only act as charge compensating centers but also suppress the adverse energy migration among neighboring Mn4+ ions.21,74,75 Ge4+, Ca2+, Li+, Na+, K+, Cl could also serve as charge compensators to enhance the luminescence of red phosphors.2,51,58,76 Fig. 4c depicts the influence of Li+, Na+, K+ and Mg2+ codoping on the fluorescence intensities of SrAl12O19:Mn4+. The different charge compensators have different effects for improving Mn4+ red emission.
image file: c6ra19584a-f4.tif
Fig. 4 (a) PLE and PL spectral of Y3Al5O12:Mn4+ (YAG:Mn4+) red phosphor. Inset shows the corresponding luminescent photograph of red phosphor under UV illumination. (b) Schematic illustration of the mechanism that Mn4+–Mn4+ pairs in connection with interstitial O2− are transformed into isolated Mn4+ ions with charge compensation provided by Mg2+ ions. (c) Emission spectra and relative intensity of SrAl12O17:Mn4+, M (M = Li+, Na+, K+, Mg2+) red phosphors (reproduced from ref. 61 with permission from Wiley-VCH).
Table 2 Spectroscopic parameters of Mn4+ ions in various crystals (λex/λem is the excitation/emission wavelength, QE is the quantum efficiency)a
Red phosphors λex (nm) λem (nm) QE (%) Ref.
a * represents internal quantum efficiency, Δ represents external quantum efficiency.
Ca14Zn6Al10O35:Mn4+ 314 465 713 19
MgAl2Si2O8:Mn4+ 258 358 710 47
Ca14Al10Zn6O35:Mn4+ 318 462 708 50.7 34
La2LiTaO6:Mn4+ 330 495 707 21.4 48
Gd2ZnTiO6:Mn4+ 378 504 705 39.7* 49
Y3Al5O12:Mn4+ 352 480 673 21
LiAlO2:Mn4+ 330 430 670 48*, 33Δ 50
SrMgAl10O17:Mn4+ 320 465 660 51
BaMg6Ti6O19:Mn4+ 338 475 660 12* 52
BaMgAl10O17:Mn4+ 335 465 660 36
MgO·MgF2·GeO2:Mn4+ 330 420 659 53 and 54
Sr2MgAl22O36:Mn4+ 312 468 658 80 55
Mg2TiO4:Mn4+ 350 475 657 38.3* 44, 56 and 57
CaAl12O19:Mn4+ 330 465 657 63* 52 and 58
CaAl4O7:Mn4+ 335 467 656 59
CaMg2Al16O27:Mn4+ 390 468 655 35.6*, 16Δ 60
SrAl12O19:Mn4+ 325 475 655 61
Sr4Al14O25:Mn4+ 325 450 652 62–66
K2TiF6:Mn4+ 362 468 635 98 4 and 67
BaGeF6:Mn4+ 360 460 634 68
Cs2SnF6:Mn4+ 370 470 633 33
K2SiF6:Mn4+ 360 460 632 74 26, 37 and 69
K2GeF6:Mn4+ 360 460 632 29
BaSiF6:Mn4+ 365 466 632 30
BaTiF6:Mn4+ 360 470 632 32
ZnTiF6:Mn4+ 360 465 631 26.4*, 6.2Δ 70
K2SnF6:Mn4+ 360 470 630 40Δ 31
KNaSiF6:Mn4+ 360 460 630 27
ZnSiF6:Mn4+ 356 460 629 71
Na2SnF6:Mn4+ 370 470 627 33
Na2SiF6:Mn4+ 360 460 627 28, 72 and 73
NaGdF4:Mn4+ 363 469 627 4
NaYF4:Mn4+ 360 470 626 4


The A2XF6:Mn4+ and BXF6:Mn4+ fluorides, where A is the alkali metal ions, B = Ba and Zn and X = Si, Ge, Zr, Sn, and Ti, are the most common reported red phosphors. RT PL, PLE and temperature-dependent PL spectra were usually used to discuss optical properties of fluoride phosphors. Fig. 5 shows RT PL spectra obtained from (a) K2GeF6:Mn4+, (b) K2SiF6:Mn4+, (c) Na2GeF6:Mn4+ and (d) Na2SiF6:Mn4+.29 All these spectra were measured by exciting at λex = 325 nm (He–Cd laser). No obvious difference in the PL intensities was observed among these samples. The ZPLs in Fig. 5a–d correspond to (a) 1.990, (b) 1.993, (c) 2.005, and (d) 2.017 eV, respectively. The internal vibronic frequencies νi (i = 1–6) of the MnF62− octahedron in dialkali and alkali earth hexafluorometallates can be principally determined by its molecular dynamics only. Fig. 5e shows the PL spectra for K2GeF6:Mn4+ phosphor measured at temperatures between 20 K and 300 K with a He–Cd laser as an excitation light source.22 As previously mentioned, the sharp red emissions can be assigned to the 2Eg4A2g transition of the 3d3 electrons in the MnF62− octahedron. The Mn 3d3 transitions are electronic dipole forbidden but gain intensity by the activation of vibronic modes. At T = 20 K, many sharp peaks dominate on the long-wavelength side of the zero-phonon line (ZPL). At T = 300 K, these sharp peaks become very broad and appear not only on the long-wavelength side but also on the short-wavelength one. The long- and short-wavelength emission peaks are known as the Stokes and anti-Stokes lines, respectively.


image file: c6ra19584a-f5.tif
Fig. 5 RT PL spectra of (a) K2GeF6:Mn4+, (b) K2SiF6:Mn4+, (c) Na2GeF6:Mn4+ and (d) Na2SiF6:Mn4+ phosphors with a He–Cd laser as the excitation light source. (e) Temperature-dependent PL spectra for K2SiF6:Mn4+ phosphor between 20 and 300 K (reproduced from ref. 22 and 29 with permission from the Electrochemical Society and American Institute of Physics).

Generally, Mn4+ doped oxide phosphors exhibit deep red (λ ≥ 650 nm) and broadband emissions, and their absorption in the blue wavelength region is relatively weak. Therefore, the application of oxide red phosphors is restricted in term of blue-light-excited WLED. In the research of oxide red phosphors, the quantum efficiency (QE) is rarely mentioned. Due to high temperature sintering, oxide hosts usually have a large amount of defects leading to low QE of Mn4+ luminescence. These defects could also affect the thermal stability of phosphors. On the contrary, Mn4+ doped red fluoride phosphors have strong absorption for blue excitation light. In addition, the shorter emission wavelength and narrower emission band make them more suitable as the red component applying in the warm WLED. So far, the highest PL QE up to 98% was realized for the K2TiF6:Mn4+ red phosphor.4 Notably, further research must be carried out to realize mass production of Mn4+ doped red fluoride phosphors and improve their thermal stability as well as humidity resistance.

Application in white-LED

Currently, the major commercial WLED is the phosphor converted LED made of the InGaN blue-emitting chip and the YAG:Ce3+ yellow phosphor dispersed in the organic epoxy resin or silicon. Due to lack of red component, the CCT and CRI are unsatisfactory. Hence, the general solution needs to add excess red phosphor to organic epoxy resin or silicon. Fig. 6 shows the PLE and PL of CaAlSiN3:Eu2+ red phosphor, YAG:Ce3+ yellow phosphor, Mn4+ active oxide and fluoride red phosphors. Obviously, PLE spectra of nitride red phosphors and PL of YAG:Ce3+ yellow phosphor have a large degree of overlap, which leads to serious reabsorption and reduces luminous efficiency of WLED. In comparison, this reabsorption effect is greatly lessened between YAG:Ce3+ yellow phosphor and Mn4+ doped oxide/fluoride red phosphors, which ensures their possible application in warm WLED as red component. Fig. 7a shows the WLEDs based on the combination of a UV LED chip with the mixture of blue (BaMgAl10O17:Eu2+), green (Sr2SiO4:Eu2+) and red GdZnTiO6:Mn4+ phosphors.49 By modifying the RGB ratio, the white light was found evolving from cool to warm with a tunable CCT from 6977 K to 4742 K, a CRI up to 82.9 and an improved R9 value to 43, verifying GdZnTiO6:Mn4+ a promising red component for UV-based WLED. Fig. 7b exhibits the WLEDs consisting of a blue chip (455 nm), YAG:Ce3+ yellow (or aluminate green) and K2TiF6:Mn4+ red phosphors. Photographs of three typical lighted WLEDs are shown in Fig. 7c–e. Benefited from the incremental red light component in the electroluminescence spectrum of LED (owing to the increase of K2TiF6:Mn4+ content), a significantly warmer tone of the emitting white light was found. The color coordinates of these WLEDs with CCTs of 5954, 3556 and 2783 K, (0.322, 0.342), (0.400, 0.382) and (0.457, 0.416), are marked in CIE 1931 color spaces, respectively, and all three color points are close to the black body locus (inset of Fig. 7e). Table 3 presents the important photoelectric parameters for WLEDs by using several typical Mn4+ doped red phosphors, which clearly demonstrates the ability of these red phosphors to improve CCT and CRI of WLEDs.
image file: c6ra19584a-f6.tif
Fig. 6 PLE and PL of Eu2+ doped CaAlSiN3:Eu2+ red phosphors, YAG:Ce3+ yellow phosphor, Mn4+ activated oxide and fluoride red phosphors.

image file: c6ra19584a-f7.tif
Fig. 7 (a) Photographs of lighted WLEDs fabricated by coupling the 365 nm UV chip with the mixture of blue (BaMgAl10O17:Eu2+), green (Sr2SiO4:Eu2+) and red GdZnTiO6:Mn4+ phosphors and the corresponding chromaticity coordinations. (b) Photographs of WLEDs consisting of blue chip (455 nm), YAG:Ce3+ yellow (or aluminate green) and K2TiF6:Mn4+ red phosphors. (c–e) Lighted WLEDs exhibit CCTs of (c) 5954, (d) 3556 and (e) 2783 K as the content of K2TiF6:Mn4+ red phosphor increases. Inset of (e) shows the corresponding chromaticity coordinations of three typical WLEDs (reproduced from ref. 4 and 49 with permission from Royal Society of Chemistry and Nature Publishing).
Table 3 Important photoelectric parameters for WLEDs with different red phosphors
Red phosphor blend LE (lm W−1) CCT (K) CRI Chromaticity coordinate Ref.
45.21 6283 76 1 and 68
BaMgAl10O17:Mn4+ 55.1 3622 96 (0.43, 0.45) 36
Ca14Al10Zn6O35:Mn4+ 4130 (0.39, 0.44) 19
La2LiTaO6:Mn4+ 150 5500 72 (0.29, 0.32) 48
Mg2TiO4:Mn4+ (0.41, 0.56) 56
CaMg2Al16O27:Mn4+ 58.3 3896 85.5 (0.40, 0.42) 60
Sr4Al14O25:Mn4+ 35 5406 93.23 (0.33, 0.36) 62
Na2SiF6:Mn4+ 77.6 6875 86 (0.31, 0.30) 28
K2SiF6:Mn4+ 116 3900 89.9 (0.38, 0.33) 39
K2TiF6:Mn4+ 116 3556 81 (0.46, 0.41) 4
BaGeF6:Mn4+ 52.12 4210 84 68
ZnTiF6:Mn4+ 92.21 3987 83.1 (0.39, 0.40) 70
K2GeF6:Mn4+ 3974 89 (0.40, 0.45) 77


Furthermore, the easy aging of the organic binder ascribing to the accumulated heat emitting from the InGaN chip will reduce the long-term reliability and actual lifetime of WLEDs. Inorganic glass ceramic (GC), a kind of composite with YAG:Ce3+ micro-crystals distributing among glass matrix, exhibits excellent thermal resistance and easy formability, and may simultaneously play the key roles of luminescent convertor and encapsulating material as the traditional phosphor powder and organic resin respectively used in WLEDs.2,21,60,78,79 Recently, YAG:Mn4+ embedded inorganic glass ceramic was successfully fabricated to replace phosphor in organic silicone as the color converter, and a stacking geometric configuration by sequentially coupling a YAG:Ce3+ glass ceramic and a YAG:Mn4+ glass ceramic with an InGaN blue chip was designed to explore its possible application in warm white light-emitting diodes, as shown in Fig. 8a.21 As YAG:Mn4+ content increases in GC sample, red luminescence enhances gradually, leading to the decrease of CCT from 5707 K to 4671 K (Fig. 8b). On the other hand, dual-phase (such as YAG:Ce3+ yellow and BaMgAl10O17 (BMA):Mn4+ red phosphors) embedded GCs were designed by Y. S. Wang et al. and then coupled with InGaN blue chips, aiming to achieve warm white light, as shown Fig. 8c and d.36 Scanning electron microscope (SEM) observations and energy-dispersive X-ray spectrometer (EDS) analyses clearly distinguish two kinds of embedded crystallites from their different contrasts (Fig. 8c). The constructed GC-based remote-type WLED is superior to the conventional conformal one because of the lower heat accumulation experienced by the phosphors as well as the reduced glare to human eyes (Fig. 8d). By simply modifying the weight ratio of BMA:Mn4+ red phosphor, the appearance of the lighted WLED (Fig. 8e) evolves from cold white to natural white and, finally, to warm white. As a consequence, the CIE chromaticity coordinates shift from (0.339, 0.349) to (0.427, 0.448), the LE decreases from 99.2 to 55.1 lm W−1, the CCT decreases from 6608 to 3622 K, and the CRI increases from 68.4 to 86.0, meeting the requirements for indoor lighting applications. Similar results were also reported in YAG:Ce3+ and CaMg2Al16O27:Mn4+ dual-phase GC-based WLEDs.60


image file: c6ra19584a-f8.tif
Fig. 8 (a) Photograph of the WLED device constructed by coupling YAG:Ce3+ GC and YAG:Mn4+ GC stacking structure with blue chips and (b) electroluminescence spectra of GC-based WLEDs with increase of YAG:Mn4+ content. (c) SEM observations and EDS analyses of GC embedded with BMA:Mn4+ red and YAG:Ce3+ yellow dual-phase phosphors. (d) Schematic illustration of the constructed remote-type WLED with dual-phase embedded GC as color converter and (e) the corresponding electroluminescent spectra of WLEDs with increase of BMA:Mn4+ content. Insets of (e) show luminescent photographs of the WLEDs in operation under 350 mA current (reproduced from ref. 21 and 36 with permission from Royal Society of Chemistry and American Chemical Society).

Challenges and perspectives

So far, Mn4+ activated oxide and fluoride red phosphors have drawn more and more attention due to their special advantages, such as relatively simple preparation route and low-cost. Depending on the host, the spectral position of the 2Eg4A2g transition can be modified over a wide range and the absorption/excitation bands locate in the UV-blue wavelength region. Hence, these Mn4+ doped materials, being an alternative to traditional rare earth doped red phosphors, show greatly potential applications in warm WLEDs. Despite the fact that a large amount of Mn4+ doped red phosphors have been successfully developed, there are a number of research issues that are particularly interesting, but require concerted effort for success. For Mn4+ doped oxide phosphors, blue shifting of the emission wavelength from deep-red to orange/red and enhanced absorption/excitation in blue wavelength region are highly desired. One of the possible solutions is to reduce the covalency of oxide matrix through impurity doping. For Mn4+ doped fluoride phosphors, more concerns should be focused on thermal stability as well as humidity resistance. It is expected that surface controlling by coating or designing core@shell structure is an effective strategy to improve their thermal stability and humidity resistance.80 Finally, the quantum efficiency should be further improved by optimizing synthesis procedure and decreasing matrix defects.

Acknowledgements

This work was supported by the Natural Science Foundation of Zhejiang Province for Distinguished Young Scholars (LR15E020001), National Natural Science Foundation of China (21271170, 61372025, 51402077 and 51572065) and the 151 talent's projects in the second level of Zhejiang Province.

References

  1. P. Pust, P. J. Schmidt and W. Schnick, Nat. Mater., 2015, 14, 454–458 CrossRef CAS PubMed.
  2. D. Q. Chen, W. D. Xiang, X. J. Liang, J. S. Zhong, H. Yu, M. Y. Ding, H. W. Lu and Z. G. Ji, J. Eur. Ceram. Soc., 2015, 35, 859–869 CrossRef CAS.
  3. C. C. Lin and R. S. Liu, J. Phys. Chem. Lett., 2011, 2, 1268–1277 CrossRef CAS PubMed.
  4. H. M. Zhu, C. C. Lin, W. Q. Luo, S. T. Shu, Z. G. Liu, Y. S. Liu, J. T. Kong, E. Ma, Y. G. Cao, R.-S. Liu and X. Y. Chen, Nat. Commun., 2014, 5, 1–10 CrossRef.
  5. M. M. Shang, J. Fan, H. Z. Lian, Y. Zhang, D. L. Geng and J. Lin, Inorg. Chem., 2014, 53, 7748–7755 CrossRef CAS PubMed.
  6. W. Lu, W. Z. Lv, Q. Zhao, M. M. Jiao, B. Q. Shao and H. P. You, Inorg. Chem., 2014, 53, 11985–11990 CrossRef CAS PubMed.
  7. M. Y. Peng, X. W. Yin, P. A. Tanner, M. G. Brik and P. F. Li, Chem. Mater., 2015, 27, 2938–2945 CrossRef.
  8. Z. X. Qiu, T. T. Luo, J. L. Zhang, W. L. Zhou, L. P. Yu and S. X. Lian, J. Lumin., 2015, 158, 130–135 CrossRef CAS.
  9. T. Takahashi and S. Adachi, J. Electrochem. Soc., 2008, 155, E183–E188 CrossRef CAS.
  10. T. Erdem and H. V. Demir, Nat. Photonics, 2011, 5, 126 CrossRef CAS.
  11. T. Erdem and H. V. Demir, Nanophotonics, 2013, 2, 57–81 CrossRef CAS.
  12. Z. Zhang, D. Liu, D. Li, K. Huang, Y. Zhang, Z. Shi, R. Xie, M. Han, Y. Wang and W. Yang, Chem. Mater., 2015, 27, 1405–1411 CrossRef CAS.
  13. D. Roy, T. Routh, A. V. Asaithambi, S. Mandal and P. K. Mandal, J. Phys. Chem. C, 2016, 120, 3483–3491 CAS.
  14. K. H. Lee, C. Y. Han, H. D. Kang, H. Ko, C. Lee, J. Lee, N. S. Myoung, S. Y. Yim and H. Yang, ACS Nano, 2015, 9, 10941–10949 CrossRef CAS PubMed.
  15. A. Aboulaich, M. Michalska, R. Schneider, A. Potdevin, J. Deschamps, R. Deloncle, G. Chadeyron and R. Mahiou, ACS Appl. Mater. Interfaces, 2014, 6, 252–258 CAS.
  16. L. E. Shea-Rohwer, J. E. Martin, X. Cai and D. F. Kelley, ECS J. Solid State Sci. Technol., 2013, 2, R3112–R3118 CrossRef CAS.
  17. T. Erdem and H. V. Demir, Nanophotonics, 2016, 5, 74–95 CrossRef.
  18. M. G. Brik, S. J. Camardello and A. M. Srivastava, ECS J. Solid State Sci. Technol., 2015, 4, R39–R43 CrossRef CAS.
  19. K. Seki, K. Uematsu, K. Toda and M. Sato, Chem. Lett., 2014, 43, 1213–1215 CrossRef CAS.
  20. M. G. Brik and A. M. Srivastava, J. Lumin., 2013, 133, 69–72 CrossRef CAS.
  21. D. Q. Chen, Y. Zhou, W. Xu, J. S. Zhong, Z. G. Ji and W. D. Xiang, J. Mater. Chem. C, 2016, 4, 1704–1712 RSC.
  22. S. Adachi and T. Takahashi, Electrochem. Solid-State Lett., 2009, 12, J20–J23 CrossRef CAS.
  23. R. Kasa and S. Adachi, J. Electrochem. Soc., 2012, 159, J89–J95 CrossRef CAS.
  24. D. Sekiguchi and S. Adachi, ECS J. Solid State Sci. Technol., 2014, 3, R60–R64 CrossRef CAS.
  25. R. Kasa, Y. Arai, T. Takahashi and S. Adachi, J. Appl. Phys., 2010, 108, 113503 CrossRef.
  26. X. Q. Li, X. M. Su, P. Liu, J. Liu, Z. L. Yao, J. J Chen, H. Yao, X. B. Yu and M. Zhan, CrystEngComm, 2015, 17, 930–936 RSC.
  27. S. Adachi, H. Abe, R. Kasa and T. Arai, J. Electrochem. Soc., 2012, 159, J34–J37 CrossRef CAS.
  28. H. Nguyen, C. C. Lin, M. Fang and R. Liu, J. Mater. Chem. C, 2014, 2, 10268–10272 RSC.
  29. S. Adachi and T. Takahashi, J. Appl. Phys., 2009, 106, 013516 CrossRef.
  30. X. Y. Jiang, Y. X. Pan, S. M. Huang, X. A. Chen, J. G. Wang and G. K. Liu, J. Mater. Chem. C, 2014, 2, 2301–2306 RSC.
  31. Y. Arai, T. Takahashi and S. Adachi, Opt. Mater., 2010, 32, 1095–1101 CrossRef CAS.
  32. X. Y. Jiang, Z. Chen, S. M. Huang, J. G. Wang and Y. X. Pan, Dalton Trans., 2014, 43, 9414–9418 RSC.
  33. Y. Arai and S. Adachi, J. Lumin., 2011, 131, 2652–2660 CrossRef CAS.
  34. W. Lu, W. Z. Lv, Q. Zhao, M. G. Jiao, B. Q. Shao and H. P. You, Inorg. Chem., 2014, 53, 11985–11990 CrossRef CAS PubMed.
  35. L. Chen, S. C. Xue, X. L. Chen, A. Bahader, X. R. Deng, E. L. Zhao, Y. Jiang, S. F. Chen, T.-S. Chan, Z. Zhao and W. H. Zhang, Mater. Res. Bull., 2014, 60, 604–611 CrossRef CAS.
  36. B. Wang, H. Lin, F. Huang, J. Xu, H. Chen, Z. B. Lin and Y. S. Wang, Chem. Mater., 2016, 28, 3515–3524 CrossRef CAS.
  37. M. J. Lee, Y. H. Song, Y. L. Song, G. S. Han, H. S. Jung and D. H. Yoon, Mater. Lett., 2015, 141, 27–30 CrossRef CAS.
  38. J. H. Oh, H. Kang, Y. J. Eo, H. K. Park and Y. R. Do, J. Mater. Chem. C, 2015, 3, 607–615 RSC.
  39. C. X. Liao, R. P. Cao, Z. J. Ma, Y. Li, G. P. Dong, K. N. Sharafudeen and J. R. Qiu, J. Am. Ceram. Soc., 2013, 96, 3552–3556 CrossRef CAS.
  40. T. Arai, Y. Arai, T. Takahashi and S. Adachi, J. Appl. Phys., 2010, 108, 063506 CrossRef.
  41. S. Adachi and T. Takahashi, J. Appl. Phys., 2008, 104, 023512 CrossRef.
  42. L. F. Lv, X. Y. Jiang, S. M. Huang, X. A. Chen and Y. X. Pan, J. Mater. Chem. C, 2014, 2, 3879–3884 RSC.
  43. L. Huang, Y. W. Zhu, X. J. Zhang, R. Zou, F. J. Pan, J. Wang and M. M. Wu, Chem. Mater., 2016, 28, 1495–1502 CrossRef CAS.
  44. T. N. Ye, S. Li, X. Y. Wu, M. Y. Xu, X. Wei, K. X. Wang, H. L. Bao, J. Q. Wang and J. S. Chen, J. Mater. Chem. C, 2013, 1, 4327–4333 RSC.
  45. X. F. Qu, L. X. Cao, W. Liu and G. Su, J. Alloys Compd., 2012, 533, 83–87 CrossRef CAS.
  46. Z. H. Jua, S. H. Zhang, X. P. Gao, X. L. Tang and W. S. Liu, J. Alloys Compd., 2011, 509, 8082–8087 CrossRef.
  47. N. O. Kalaycioglu and E. Çırçır, J. Therm. Anal. Calorim., 2012, 111, 273–277 CrossRef.
  48. L. Wang, L. Yuan, Y. D. Xu, R. L. Zhou, B. Y. Qu, N. Ding, M. Shi, B. Zhang, Y. Q. Chen, Y. Jiang, D. Wang and J. Y. Shi, Appl. Phys. A, 2014, 117, 1777–1783 CrossRef CAS.
  49. H. Chen, H. Lin, Q. M. Huang, F. Huang, J. Xu, B. Wang, Z. B. Lin, J. C. Zhou and Y. S. Wang, J. Mater. Chem. C, 2016, 4, 2374–2381 RSC.
  50. M. Aoyama, Y. Amano, K. Inoue, S. Honda, S. Hashimoto and Y. Iwamoto, J. Lumin., 2013, 136, 411–414 CrossRef CAS.
  51. L. L. Meng, L. F. Liang and Y. X. Wen, J. Mater. Sci.: Mater. Electron., 2014, 25, 2676–2681 CrossRef CAS.
  52. T. Sasaki, J. Fukushima, Y. Hayashi and H. Takizawa, Chem. Lett., 2014, 43, 1061–1063 CrossRef CAS.
  53. S. Okamoto and H. Yamamoto, J. Electrochem. Soc., 2010, 157, J59–J63 CrossRef CAS.
  54. Q. Y. Shao, H. Y. Lin, J. L. Hu, Y. Dong and J. Q. Jiang, J. Alloys Compd., 2013, 552, 370–375 CrossRef CAS.
  55. R. P. Cao, M. Y. Peng, E. H. Song and J. R. Qiu, ECS J. Solid State Sci. Technol., 2012, 1, R123–R126 CrossRef CAS.
  56. Z. X. Qiu, T. T. Luo, J. L. Zhang, W. L. Zhou, L. P. Yu and S. Lian, J. Lumin., 2015, 158, 130–135 CrossRef CAS.
  57. M. M. Medić, M. G. Brik, G. Dražić, Ž. M. Antić, V. M. Lojpur and M. D. Dramićanin, J. Phys. Chem. C, 2015, 119, 724–730 Search PubMed.
  58. W. Shu, L. L. Jiang, S. G. Xiao, X. L. Yang and J. W. Ding, Mater. Sci. Eng., B, 2012, 177, 274–277 CrossRef CAS.
  59. J. Park, G. Kim and Y. J. Kim, Ceram. Int., 2013, 39, S623–S626 CrossRef CAS.
  60. B. Wang, H. Lin, J. Xu, H. Chen and Y. S. Wang, ACS Appl. Mater. Interfaces, 2014, 6, 22905–22913 CAS.
  61. L. Wang, Y. D. Xu, D. Wang, R. L. Zhou, N. Ding, M. Shi, Y. Q. Chen, Y. Jiang and Y. H. Wang, Phys. Status Solidi A, 2013, 210, 1433–1437 CrossRef CAS.
  62. M. Y. Peng, X. W. Yin, P. A. Tanner, C. Q. Liang, P. F. Li, Q. Y. Zhang and J. R. Qiu, J. Am. Ceram. Soc., 2013, 96, 2870–2876 CrossRef CAS.
  63. L. L. Meng, L. F. Liang and Y. X. Wen, Mater. Chem. Phys., 2015, 153, 1–4 CrossRef CAS.
  64. L. Chen, X. R. Deng, E. L. Zhao, X. L. Chen, S. C. Xue, W. Q. Zhang, S. F. Chen, Z. Zhao, W. H. Zhang and T. S. Chan, J. Alloys Compd., 2014, 613, 312–316 CrossRef CAS.
  65. Y. D. Xu, D. Wang, L. Wang, N. Ding, M. Shi, J. G. Zhong and S. Qi, J. Alloys Compd., 2013, 550, 226–230 CrossRef CAS.
  66. L. Chen, S. C. Xue, X. L. Chen, A. Bahader, X. R. Deng, E. L. Zhao, Y. Jiang, S. F. Chen, T. S. Chan, Z. Zhao and W. H. Zhang, Mater. Res. Bull., 2014, 60, 604–611 CrossRef CAS.
  67. L. F. Lv, Z. Chen, G. K. Liu, S. M. Huang and Y. X. Pan, J. Mater. Chem. C, 2015, 3, 1935–1941 RSC.
  68. Q. Zhou, Y. Y. Zhou, Y. Liu, L. J. Luo, Z. L. Wang, J. H. Peng, J. Yan and M. M. Wu, J. Mater. Chem. C, 2015, 3, 3055–3059 RSC.
  69. T. Nakamura, Z. Yuan and S. Adachi, Appl. Surf. Sci., 2014, 320, 514–518 CrossRef CAS.
  70. J. S. Zhong, D. Q. Chen, X. Wang, L. F. Chen, H. Yu, Z. G. Ji and W. D. Xiang, J. Alloys Compd., 2016, 662, 232–239 CrossRef CAS.
  71. L. F. Lv, X. Y. Jiang, Y. X. Pan, G. K. Liu and S. M. Huang, J. Lumin., 2014, 152, 214–217 CrossRef CAS.
  72. Y. K. Xu and S. Adachi, J. Appl. Phys., 2009, 105, 013525 CrossRef.
  73. T. Arai and S. Adachi, J. Appl. Phys., 2011, 110, 063514 CrossRef.
  74. Y. X. Pan and G. K. Liu, J. Lumin., 2011, 131, 465–468 CrossRef CAS.
  75. M. G. Brik, Y. X. Pan and G. K. Liu, J. Alloys Compd., 2011, 509, 1452–1456 CrossRef CAS.
  76. J. Lu, Y. X. Pan, J. G. Wang, X. A. Chen, S. M. Huang and G. K. Liu, RSC Adv., 2013, 3, 4510 RSC.
  77. L. L. Wei, C. C. Lin, M. H. Fang, M. G. Brik, S. F. Hu, H. Jiao and R. S. Liu, J. Mater. Chem. C, 2015, 3, 1655–1660 RSC.
  78. D. Q. Chen and Y. Chen, Ceram. Int., 2014, 40, 15325–15329 CrossRef CAS.
  79. Y. Zhou, D. Q. Chen, W. D. Tian and Z. G. Ji, J. Am. Ceram. Soc., 2015, 98, 2445–2450 CrossRef CAS.
  80. C. C. Lin, A. Meijerink and R. S. Liu, J. Phys. Chem. Lett., 2016, 7, 495–503 CrossRef CAS PubMed.

This journal is © The Royal Society of Chemistry 2016