
Zn-MOF derived micro/meso porous carbon nanorod for high performance lithium–sulfur battery
Xinye Qianac,
Lina Jin*a,
Shanwen Wanga,
Shanshan Yaoa,
Dewei Rao a,
Xiangqian Shen*a,
Xiaoming Xib and
Jun Xiangd
a,
Xiangqian Shen*a,
Xiaoming Xib and
Jun Xiangd
aInstitute for Advanced Materials, College of Materials Science and Engineering, Jiangsu University, Zhenjiang 212013, P. R. China. E-mail: jinln@ujs.edu.cn; shenxq@ujs.edu.cn
bHunan Engineering Laboratory of Power Battery Cathode Materials, Changsha Research Institute of Mining and Metallurgy, Changsha 410012, P. R. China
cLaboratory of Solid State Microstructures, Nanjing University, Nanjing 210093, P. R. China
dSchool of Mathematics and Physics, Jiangsu University of Science and Technology, Zhenjiang 212003, P. R. China
First published on 22nd September 2016
Abstract
In order to solve the problems of poor cycling stability and low coulombic efficiency in lithium–sulfur battery, induced by the low conductivity of sulfur and the shuttle effect of soluble polysulfides, a unique micro/meso porous carbon nanorod (MPCN) was fabricated by carbonizing a zinc metal–organic framework (Zn-MOF) precursor, which was prepared by a facile aqueous solution method at room temperature. The mesopores in the MPCN are beneficial for the infiltration of electrolyte and the transportation of Li ions, and the micropores are sufficient to encapsulate sulfur and adsorb the soluble polysulfides. The MPCN–S cathode displays a discharge capacity of about 1000 mA h g−1 at the current rate of 0.5C and retains 740 mA h g−1 after 200 cycles with the coulombic efficiency up to 95%. Moreover, it still has a discharge capacity as high as 850 mA h g−1 when the current rate increased to 2C, which demonstrates a nice rate capability.
Introduction
Traditional lithium ion batteries have met their bottlenecks due to their low theoretical capacities for increasing energy requirements in portable electronic devices, electrical vehicles and other energy-demanding equipment. Lithium–sulfur battery, which is composed of a Li anode and a sulfur-based cathode, is the next generation energy storage device due to the high theoretical capacity (1675 mA h g−1) of elemental sulfur based on the chemical reaction of S8 and Li. Moreover, sulfur is naturally abundant and non-toxic, which made it possible for practical use.1–3 However, before lithium–sulfur battery can be put into commercial utilization, several challenges still remain to be solved: (1) low conductance of pure sulfur, which leads to the low utilization of active material. (2) Large volume expansion of sulfur (about 80%) during the charge/discharge process, which can give rise to the fall off of electrode materials. (3) Shuttle effects induced by the highly soluble long-chain polysulfides, which caused a rapid capacity fade and low coulombic efficiency.4–6Porous carbon materials are the most attractive sulfur hosts because they can increase the conductivities of sulfur-based cathode, alleviate the volume expansion of sulfur and adsorb the soluble long-chain polysulfides. In some previous studies, different carbon materials, such as CMK-3,6 graphene,7 carbon nanotubes,8 and carbon nanofibers,9 are used as sulfur hosts. These carbon materials with superior porous structures are sufficient to encapsulate elemental sulfur and prevent the shuttle effect of lithium polysulfides; therefore, the specific capacity and cycling performance of lithium–sulfur battery can be effectively improved. However, carbon materials, such as graphene, carbon nanotubes and CMK-3, are expensive and difficult to fabricate. Therefore, simple methods to synthesize porous carbon materials still need further investigation. There are also other approaches for the confinement of lithium polysulfides and the accommodation of sulfur expansion upon lithiation, for example, Ding et al. reported a S@C yolk–shell structure, which exhibits high initial capacities and good cycling stability.10 Recently, metal–organic frameworks (MOFs) derived porous carbon hosts for sulfur encapsulation have drawn considerable attention because of their large specific surface area, large pore volume and simple preparation.11 Furthermore, these MOFs derived porous carbon materials own novel morphologies and hierarchical porous structures, which are beneficial for Li ion transportation and lithium polysulfide adsorption.12,13 For example, Xu et al. reported a type of MOF-5 derived hierarchically porous carbon nanoplates (HPCN), which have abundant mesopores for electrolyte diffusion and micropores for sulfur confining and lithium polysulfide adsorption.14 Electrochemical tests showed that the HPCN–S composite delivered a discharge capacity of about 730 mA h g−1 at a current rate of 0.5C after 50 cycles with the coulombic efficiency as high as 97%. Yang et al. reported a French fries-like hierarchical porous carbon (FLHPC) carbonized from an aluminum metal–organic framework (Al-MOF).13 The as-prepared FLHPC possess large specific surface area and macro/meso/micro hierarchical pore structure; consequently, the FLHPC–S cathode delivered a high initial discharge capacity and showed good cycling stability within 200 cycles.
Inspired by these works, a novel micro/meso porous carbon nanorod (MPCN) with large specific surface area was designed and used as the sulfur host. Different from the works introduced above, this MPCN was derived from a Zn-MOF precursor, which was prepared by a facile reaction at room temperature. The as-prepared carbon nanorods possess unique micropores around 1.2 nm and mesopores around 3–5 nm. Under the analysis of microstructure characterization and electrochemical performances, it is demonstrated that the hierarchically mesoporous and microporous structure of the Zn-MOF derived carbon nanorods is sufficient in sulfur encapsulation and polysulfide adsorption, which are beneficial for the improvement of lithium–sulfur battery.
Experimental details
Sample preparation
The synthesis of Zn-MOF follows the approach reported by Long and his co-workers.15 However, we used a facile aqueous solution method at room temperature instead of the hydrothermal reaction at 180 °C used in the previous report. The fabrication procedures are as follows: 4,4′-biphenyldicarboxylic acid sodium salt (0.572 g, 0.002 mol) was dissolved in 20 mL deionized water marked as solvent A and zinc nitrate hexahydrate (0.595 g, 0.002 mol) was also dissolved in 20 mL deionized water marked as solvent B. Then, solvent A and B were mixed together and magnetic stirred for 30 min. Furthermore, the mixed solvent was centrifuged, washed and dried. The obtained dried product was then heated in a tube furnace at 910 °C for 3 h under nitrogen atmosphere with the heating rate of 5 °C min−1 and the micro/meso porous carbon nanorod (MPCN) was obtained when the product was cooled down to room temperature. To prepare the MPCN–S composite cathode material, MPCN and sublimed sulfur were mechanically mixed and grounded by a planetary ball mill in ethanol with a rotate speed of 800 rpm for 4 h before the heat treatment. The type of the planetary ball mill is TM-400B fabricated by Dalian Aike company in China. The volume of the agate mill is 50 mL and the mass of the MPCN and sulfur are 0.3 g and 0.7 g, respectively. In addition, the used agate milling balls are 5 mm in diameter with a total mass of 50 g and ethanol is approximately 30 mL. After ball milling, the homogeneously mixed MPCN and sulfur were dried at 60 °C overnight followed by a thermal treatment at 155 °C for 12 h in a sealed reactor, which was similar to the fabrication process of C/S composite in our previous report.16 For comparison, a Ketjen black–S (KB–S) cathode material was prepared using the same sulfur infiltration process. Ketjen black is a commercial conductive carbon material, which has higher specific surface area and higher conductivity than that of Super-P;17,18 therefore, it is more reasonable to serve as a reference sample.Microstructure characterization
The microstructures of MPCN–S and KB–S composite were analyzed by field emission scanning electron microscopy (JSM-7001F, JEOL) and transmission electron microscopy (JEM-2100 (HR), JEOL). X-ray diffraction patterns of MPCN, KB MPCN–S and KB–S composite were measured on a D/Mmax 2500PC with Cu Kα radiation (λ = 0.154178 nm). Sulfur content of the MPCN–S and KB–S composite were confirmed via thermogravimetric analysis (Netzsch, STA449F3). The Brunauer–Emmet–Teller (BET) surface area and pore size distribution of MPCN, KB MPCN–S and KB–S composite were determined by a pore size and surface area analyzer (Nova 2000).Electrochemical characterization
The electrochemical performances of the MPCN–S cathode material were measured using a CR2025-type coin cell. The slurry of the MPCN–S cathode electrode was made up of 80 wt% MPCN–S composite, 10 wt% Super-P and 10 wt% polyvinylidene fluoride (PVDF) in N-methyl-e-pyrrolidinone (NMP) dispersant. After dispersed uniformly, the slurry was spread on an aluminum foil and dried in a vacuum oven for overnight at 60 °C. Then, the coated foil was cut into 1.1 cm diameter disks and used as the cathode electrodes; the sulfur loading on the electrodes were in the range of 1.0–1.5 mg cm−2. For comparison, KB–S cathode electrode was also prepared with the same procedure. Lithium–sulfur coin cells for electrochemical measurements were assembled in an Ar-filled glove box. A lithium foil was used as the anode electrode and Celgard 2400 membrane was used as the separator. A solution of 1 M LiTFSI and 0.1 M LiNO3 dissolved in the mixture of 1,3-dioxolane (DOL) and dimethoxymethane (DME) (v/v = 1![[thin space (1/6-em)]](https://www.rsc.org/images/entities/char_2009.gif) :1) was served as the electrolyte. Cycling stability and rate capability of the cells were conducted at different current densities between 1.7 and 2.8 V (vs. Li/Li+) using the CT2001A instrument (Wuhan Jinnuo, China). Cyclic voltammetry (CV) were collected with a VMP2 electrochemical workstation (DHS Instruments Co., Ltd.) in the voltage range of 1.7–2.8 V (vs. Li/Li+) under a scanning rate of 0.2 mV s−1. Electrochemical impedance spectrometry (EIS) was performed in a frequency range from 100 kHz to 100 mHz. The current density and the specific capacities were all calculated based on the mass of sulfur in this study.
:1) was served as the electrolyte. Cycling stability and rate capability of the cells were conducted at different current densities between 1.7 and 2.8 V (vs. Li/Li+) using the CT2001A instrument (Wuhan Jinnuo, China). Cyclic voltammetry (CV) were collected with a VMP2 electrochemical workstation (DHS Instruments Co., Ltd.) in the voltage range of 1.7–2.8 V (vs. Li/Li+) under a scanning rate of 0.2 mV s−1. Electrochemical impedance spectrometry (EIS) was performed in a frequency range from 100 kHz to 100 mHz. The current density and the specific capacities were all calculated based on the mass of sulfur in this study.
Results and discussion
The SEM images of Zn-MOF, MPCN, MPCN–S, KB and KB–S are shown in Fig. 1(a)–(e). The morphology of the as-prepared Zn-MOF shown in Fig. 1(a) exhibits a regular and interconnected nanorod structure of about 0.5–1 μm in length and 50–100 nm in diameter. After high temperature carbonization, the Zn-MOF derived carbon material maintains the nanorod structure, as depicted in Fig. 1(b). Interestingly, the SEM image of MPCN–S composite shown in Fig. 1(c) also retains the nanorod structure and no agglomerated large sulfur particles could be found on the surface of MPCN, which suggests that sublimed sulfur was sufficiently infiltrated into the pores of the carbon nanorod matrix. By comparison, KB nanoparticles show a well dispersed morphology before sulfur infiltration, as can be seen in Fig. 1(d). However, it shows an agglomerated morphology in Fig. 1(e) after sulfur infiltration, which demonstrates that part of the sulfur was covered on the surface of the KB nanoparticles instead of fully absorbed by the pores of KB. | ||
| Fig. 1 SEM images of (a) Zn-MOF, (b) Zn-MOF derived carbon nanorods, (c) MPCN–S composite, (d) KB and (e) KB–S composite. | ||
To further investigate the microstructure of MPCN, TEM analysis was also carried out. Fig. 2(a) is the TEM image, which demonstrates that MPCN are carbon nanorods with highly developed micro/meso porous structure. Fig. 2(b) is the HRTEM image, which can distinguish the micropores more clearly. The uniformly distributed micro/meso pores were derived from the decomposition of the MOF structure. During the heating treatment, zinc related component was firstly reduced into metallic Zn by the carbon material followed by the evaporation of metallic Zn at about 900 °C. As Zn distributed uniformly in the MOF structure, the micro/meso pores are also uniformly distributed within the MOF derived MPCN consequently.14 Fig. 2(c) shows the TEM image of MPCN–S composite wherein no big sized sulfur particles could be discovered, which demonstrates that sulfur was uniformly infiltrated into the micro/meso pores of MPCN. Fig. 2(d) shows the elemental distribution of the MPCN–S composite. The figure on the top left corner is the STEM image of MPCN–S and the amplified STEM image in the red box is shown on the top right corner. The elemental distributions of the STEM image shown on the top right corner are displayed at the bottom of Fig. 2(d). Elemental carbon and sulfur are marked in green and yellow colours, respectively. Obviously, the homogeneously distributed sulfur matches well with each of the elemental map of carbon, which can ensure the uniform distribution of sulfur in the pores of MPCN.
 | ||
| Fig. 2 (a) TEM image of MPCN, (b) HRTEM image of MPCN, (c) TEM image of MPCN–S composite, (d) elemental mapping of the MPCN–S composite. | ||
XRD patterns of pure sulfur, MPCN, MPCN–S, KB and KB–S were obtained for further investigation of the existence of sulfur. As shown in Fig. 3(a), the diffraction peaks of MPCN and MPCN–S are approximately the same, demonstrating that sulfur was homogeneously infiltrated into the micro/meso pores of MPCN instead of covering on its surface.19,20 The two broad peaks of MPCN around 26° and 44° correspond to the (002) and (100) planes of carbonaceous materials. The broad diffraction peaks indicate the relatively low graphitization. As KB and KB–S composite are concerned, the two diffraction peaks around 26° and 44° are also discovered. However, unlike the XRD pattern of MPCN–S, the diffraction peaks of sulfur can be obviously observed in that of KB–S, demonstrating that sulfur are not fully absorbed by the pores of KB during the heat melting procedure. Fig. 3(b) shows the Raman spectra of pure sulfur, MPCN, MPCN–S, KB and KB–S. Multipeaks were observed in the S spectrum below 500 cm−1, which is consistent with the crystal nature of S. The two peaks observed at around 1355 cm−1 and 1590 cm−1 in MPCN, MPCN–S, KB and KB–S are characteristic of the D and G bands of carbonaceous materials, which indicate they were beneficial to electron transportation. Interestingly, the signals of sulfur appear in the Raman spectra of KB–S composite but were not observed in that of MPCN–S composite, which is in accordance to the XRD results. Both the XRD and Raman spectra demonstrate that sulfur was more sufficiently infiltrated into the pores of MPCN.
 | ||
| Fig. 3 XRD patterns of pure S, KB, KB–S composite, MPCN and MPCN–S composite. | ||
Fig. 4 shows the nitrogen adsorption–desorption isotherms and pore size distribution of the MPCN, MPCN–S, KB and KB–S composite. As depicted in Fig. 4(a), the hysteresis loop in the nitrogen adsorption–desorption curve of MPCN at the high relative pressure region (0.4–0.8) demonstrates that it has plenty of mesopores. Moreover, the nearly vertical increase at the low relative pressure region suggests that there are also a lot of micropores in the Zn-MOF derived carbon nanorod.21–23 The specific surface area analyzed using Brunauer–Emmett–Teller (BET) method is estimated of about 1450 m2 g−1. Pore size distribution shown in Fig. 4(b) using a BET method demonstrates that most of the pores of MPCN have a narrow distribution of micropores at around 1.2 nm and a broad distribution of mesopores at 3–5 nm. The total pore volume is approximately 1.90 cm3 g−1. After the infiltration of sublimed sulfur, the BET surface area and total pore volume of MPCN significantly decrease to 180 m2 g−1 and 0.30 cm3 g−1, respectively. The apparent reduction of BET surface area and pore volume demonstrate the sufficient infiltration of sulfur in the pores of MPCN. As shown in the inset of Fig. 4(b), the micropores of MPCN nearly disappeared but the mesopores still exist, which can still maintain the ability of Li+ ion transportation. For comparison, KB delivers a BET specific surface area of 1200 m2 g−1 and a pore volume of about 1.60 cm3 g−1, which is a slightly lower than that of MPCN. After sulfur infiltration, the specific surface area and pore volume decreased to 120 m2 g−1 and 0.23 cm3 g−1, respectively. Moreover, the BET pore size distribution of KB shows that most of the pores in KB are mesopores at around 4 nm; therefore, lithium polysulfide adsorption ability is supposed to be limited compared with the MPCN with abundant micropores.
 | ||
| Fig. 4 (a) N2 adsorption–desorption isotherms and (b) pore size distribution curves of MPCN and MPCN–S composite. (c) N2 adsorption–desorption isotherms and (d) pore size distribution curves of KB and KB–S composite. | ||
In order to determine the sulfur content, MPCN–S and KB–S composites were analyzed by the TG curve. Thermogravimetric analysis was carried out from room temperature to 600 °C with a heating rate of 5 °C min−1 in an Ar atmosphere. As shown in Fig. 5, the TG curve shows a rapid mass loss from 150 °C to 300 °C, indicating the evaporation of sublimed sulfur. When the temperature increased to 600 °C, the mass loss of MPCN–S and KB–S composite is approximately 70% and 68%, respectively, which agrees well with the C/S mass ratio used in the fabrication process. It can be noted that sulfur in the KB–S composite quickly evaporated before 250 °C, whereas sulfur in the MPCN–S composite shows a relatively lower evaporation speed because part of sulfur remains on the surface of KB nanoparticles. This phenomenon suggests that sulfur is much stable in the MPCN host, which is in accordance with the XRD and SEM results.
 | ||
| Fig. 5 TGA curves of the MPCN–S and KB–S composites. | ||
Fig. 6(a) and (b) display the CV curves of the MPCN–S and KB–S composite cathode in the voltage range of 1.7–2.8 V (vs. Li/Li+) at the scanning rate of 0.2 mV s−1. In the reverse scan form 2.8 to 1.7 V, two apparent cathodic peaks at around 2.3 V and 2.0 V are observed. The peak at 2.3 V corresponds to the chemical reaction of sublimed sulfur to long chain polysulfides, and the peak at 2.0 V contributes to the conversion of long chain polysulfides to insoluble Li2S2/Li2S sediment. In the positive scan form 1.7 to 2.8 V, one oxidation peak could be discovered around 2.4 V, which is considered as the conversion of Li2S2/Li2S to long chain polysulfides.24–26 The CV curves of MPCN–S cathode exhibit relatively sharper and higher redox peaks, which almost coincide with each other after several cycles. On the contrary, the CV curves of the KB–S cathode display a broad peak at 2 V and appear to divide into two, which is probably induced by the low reaction speed during the discharging process. Therefore, the cathode reactions in the MPCN–S cathode are supposed to be more stable than that of KB–S cathode. These results implicate a better reaction kinetics caused by the lower charge transfer resistance of the MPCN–S cathode.16,27 In order to further understand this conclusion, EIS were conducted in the frequency region from 100 kHz to 100 mHz. Fig. 6(c) shows the Nyquist plots of MPCN–S cathode and KB–S cathode before cycling. Obviously, the MPCN–S composite cathode shows a significantly smaller semicircle than the KB–S cathode does, which suggests that the MPCN–S composite cathode has a lower charge transfer resistance (Rct).28,29 Thus, MPCN–S composite cathode is more beneficial for the electrolyte infiltration and charge transportations; therefore, the electrochemical performances are greatly promoted. Fig. 6(d) exhibits the charge/discharge curves of the MPCN–S and KB–S composite cathode at 0.5C. During the discharge process, two apparent plateaus at about 2.3 V and 2.0 V are consistent with the cathodic peaks shown in CV curves. During the charge process, the charge plateau at about 2.4 V also agrees well with the anodic peak shown in CV curves. At the current rate of 0.5C, the initial discharge capacity of MPCN–S cathode is about 1000 mA h g−1, larger than that of the KB–S cathode, which is approximately 834 mA h g−1. Analyzed form the testing results above, the MPCN is supposed to play dual roles in the enhancement of electrochemical performances: the large pore volume can encapsulate more sulfur and the hierarchical porous structure can suppress the shuttle effect of lithium polysulfide effectively.26 Furthermore, the conductive carbon nanorod framework greatly benefits the transport of electrons and Li ions, which consequently promotes the chemical reaction.
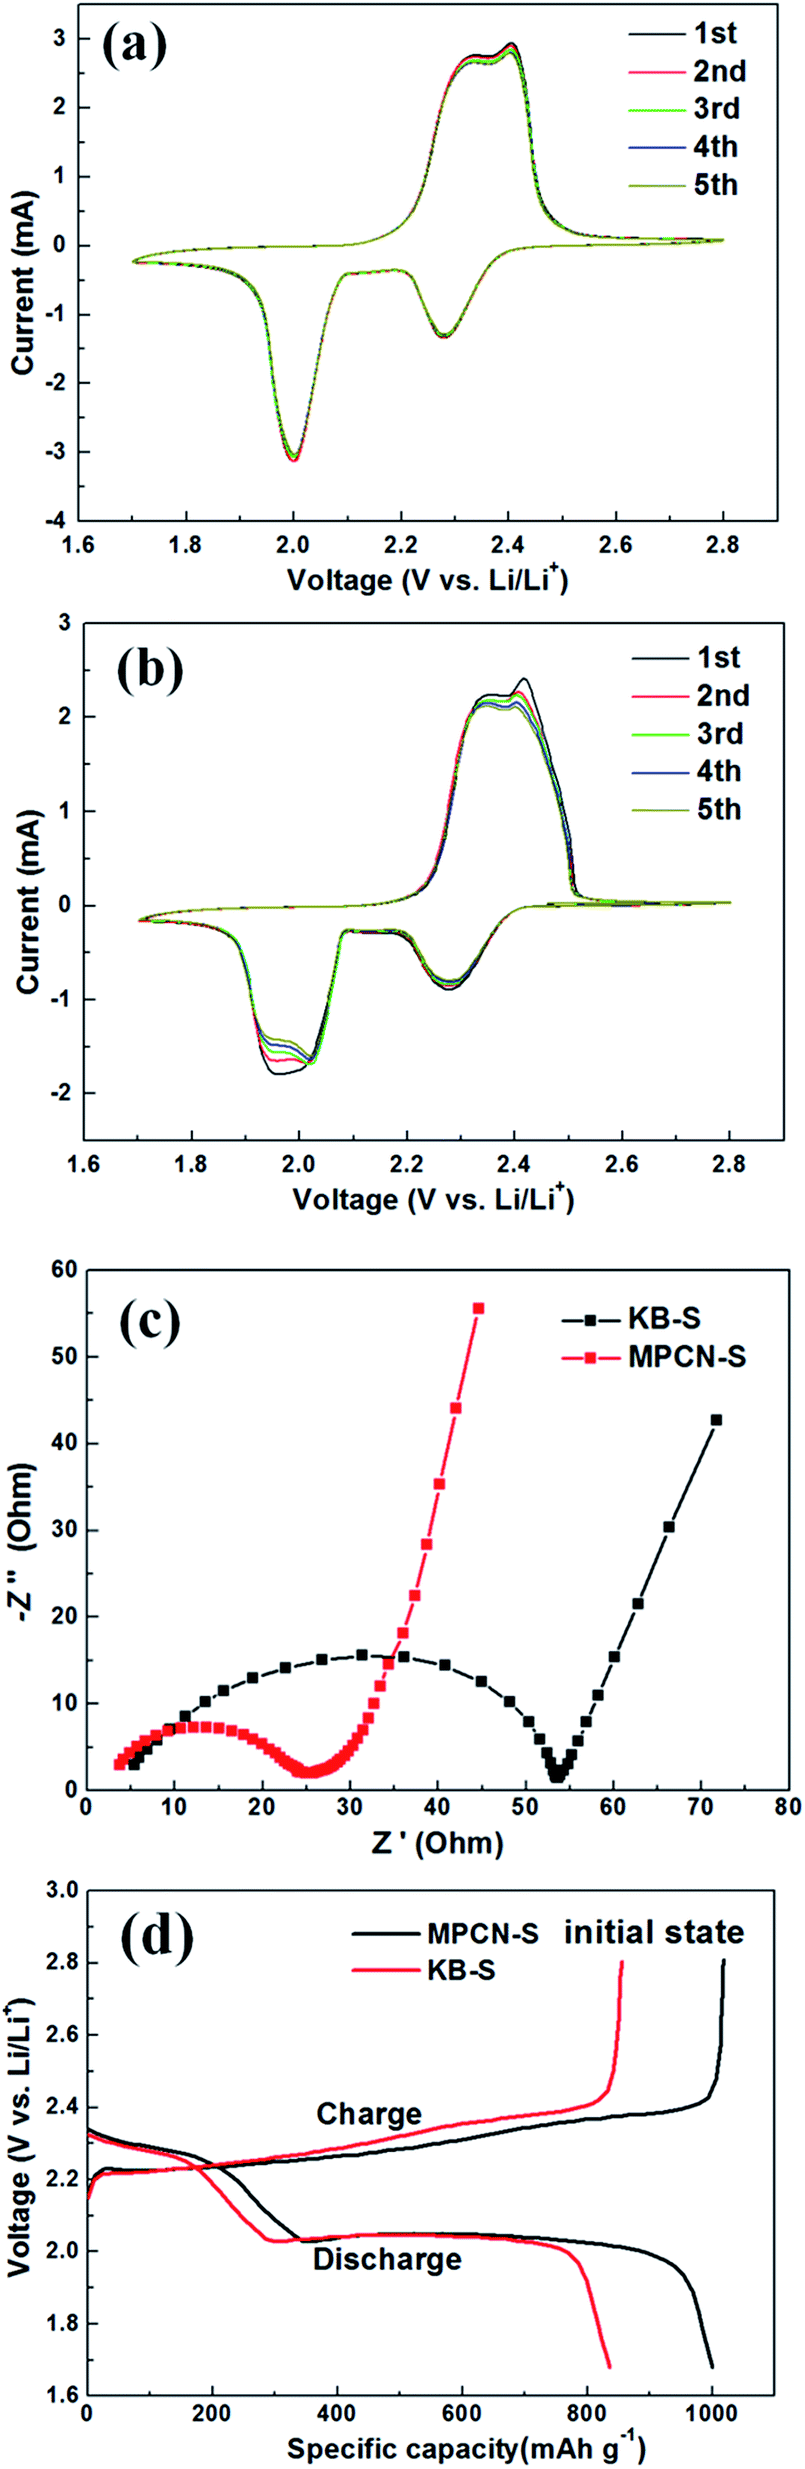 | ||
| Fig. 6 (a) CV curves of MPCN–S cathode, (b) CV curves of KB–S cathode, (c) EIS of MPCN–S and KB–S cathodes at the initial state, (d) charge/discharge curves of MPCN–S and KB–S cathodes at the initial state. | ||
Fig. 7(a) shows the cycling data of MPCN–S cathode and KB–S cathode at a current rate of 0.5C. The first discharge capacity of KB–S cathode and MPCN–S cathode is approximately 830 mA h g−1 and 1000 mA h g−1, respectively. After 200 charging/discharging cycles, the discharge capacity of these two samples decrease to 494 mA h g−1 and 740 mA h g−1, respectively. By a simple calculation, the capacity fade speed of the MPCN–S cathode is about 0.13% per cycle, whereas the relevant value of KB–S cathode is about 0.2%. Thus, the MPCN–S cathode obviously shows a much better cycling performance than that of the KB–S cathode. It demonstrates that the well dispersed sulfur in the pores of MPCN can not only enhance the utilization of active material but also improve the cycling stability of lithium sulfur battery. In addition, the MPCN–S cathode maintains a high coulombic efficiency of more than 95% during the charge/discharge process. In contrast, the coulombic efficiency of the KB–S cathode remains less than 90% after 200 cycles. The higher coulombic efficiency of MPCN–S cathode is believed to be induced by the good adsorption ability of micro/meso pores in MPCN, which greatly suppress the shuttle effect in a lithium–sulfur battery.
 | ||
| Fig. 7 (a) Cycling performances of MPCN–S and KB–S cathodes and (b) rate capabilities of MPCN–S and KB–S cathodes. | ||
Fig. 7(b) shows the rate performances of a MPCN–S cathode and a KB–S cathode at different current rates. MPCN–S cathode reaches the discharge capacities of 1210, 1100, 1000, 900, and 850 mA h g−1 when the current density are 0.1C, 0.2C, 0.5C, 1C, and 2C, respectively. Even when the current density returns to 0.1C after 40 cycles, the reversible discharge capacity still remains over 1000 mA h g−1. The highly reversible discharge capacity over the wide range from 0.1C to 2C rates proves the stable recyclability and superior rate capability of MPCN–S cathode to a certain extent. In comparison, a Li–S battery with a KB–S cathode shows relatively low discharge capacities at each current rate. The better rate performance of MPCN–S cathode is supposed to be induced by the lower charge transfer resistance and the hierarchical porous structure of MPCN, which is beneficial for electrolyte infiltration and ion transportation.23
Conclusions
In summary, we fabricated a hierarchical porous MPCN with abundant mesopores and micropores derived from a Zn-MOF, which was prepared by a facile reaction at room temperature. The as-prepared MPCN possesses unique micropores around 1.2 nm and mesopores around 3–5 nm as well as a high BET specific surface area of about 1450 m2 g−1. After sulfur infiltration, the MPCN–S composite displays good electrochemical performances as the cathode for a lithium–sulfur battery. It shows a specific capacity of about 1000 mA h g−1 and remains 740 mA h g−1 after 200 cycles at the current rate of 0.5C with the coulombic efficiency up to 95%. Moreover, it shows an impressive rate capability; the discharge capacity still remains as high as 850 mA h g−1, when the current rate increased to 2C. The promising cycling stability, impressive coulombic efficiency and superior rate capability are supposed to be induced by the highly conductive Zn-MOF derived MPCN. The conductive carbon nanorod framework can greatly enhance electron transport. The mesopores are beneficial for the infiltration of electrolyte and the fast diffusion of Li ions. Moreover, the abundant micropores are sufficient to encapsulate sulfur and adsorb the soluble lithium polysulfide. Thus, MPCN with a unique hierarchical porous structure can be a promising carbon host to encapsulate sulfur as the cathode material for a lithium–sulfur battery.Acknowledgements
This study was financially supported by the Start-up Fund of Jiangsu University (Grant No. 14JDG060, 14JDG058), the open fund of the Laboratory of Solid State Microstructures, the Nanjing University (M28035), the Natural Science Foundation of Jiangsu Provincial Higher Education of China (Grant No. 16KJB430007), the National Natural Science Foundation of China (Grant No. 21401081, 51274106, 51474113, 51474037), the China Postdoctoral Science Foundation (No. 2014M560397), and the Jiangsu Postdoctoral Science Foundation (No. 1401051C and 1402196C).Notes and references
- P. G. Bruce, S. A. Freunberger, L. J. Hardwick and J. M. Tarascon, Nat. Mater., 2012, 11, 19 CrossRef CAS PubMed.
- Y. Bing, H. Liu, L. Zhang, D. Ghosh and J. Zhang, Chem. Soc. Rev., 2010, 39, 2184 RSC.
- D. Li, F. Han, S. Wang, F. Cheng, Q. Sun and W. C. Li, ACS Appl. Mater. Interfaces, 2013, 5, 2208 CAS.
- A. Manthiram, Y. Z. Fu and Y. S. Su, Acc. Chem. Res., 2012, 46, 1125 CrossRef PubMed.
- J. R. Akridge, Y. V. Mikhaylik and N. White, Solid State Ionics, 2004, 175, 243 CrossRef CAS.
- X. L. Ji, K. T. Lee and L. F. Nazar, Nat. Mater., 2009, 8, 500 CrossRef CAS PubMed.
- H. L. Wang, Y. Yang, Y. Y. Liang, J. T. Robinson, Y. G. Li, A. Jackson, Y. Cui and H. J. Dai, Nano Lett., 2011, 11, 2644 CrossRef CAS PubMed.
- J. Guo, Y. Xu and C. Wang, Nano Lett., 2011, 11, 4288 CrossRef CAS PubMed.
- L. W. Ji, M. M. Rao, S. Aloni, L. Wang, E. J. Cairns and Y. G. Zhang, Energy Environ. Sci., 2011, 4, 5053 CAS.
- N. Ding, Y. W. Lum, S. F. Chen, S. W. Chien, T. S. Andy Hor, Z. L. Liu and Y. Zong, J. Mater. Chem. A, 2015, 3, 1853 CAS.
- K. Xi, S. Cao, X. Peng, C. Ducati, R. V. Kumar and A. K. Cheetham, Chem. Commun., 2013, 49, 2192 RSC.
- C. Liang, N. J. Dudney and J. Y. Howe, Chem. Mater., 2009, 21, 4724 CrossRef CAS.
- X. F. Yang, N. Yan, W. Zhou, H. Z. Zhang, X. F. Li and H. M. Zhang, J. Mater. Chem. A, 2015, 3, 15314 CAS.
- G. Y. Xu, B. Ding, L. F. Shen, P. Nie, J. P. Han and X. G. Zhang, J. Mater. Chem. A, 2013, 1, 4490 CAS.
- L. S. Long, Y. P. Ren, L. H. Ma, Y. B. Jiang, R. B. Huang and L. S. Zheng, Inorg. Chem. Commun., 2003, 6, 690 CrossRef CAS.
- D. Zhao, X. Y. Qian, L. N. Jin, X. L. Yang, S. W. Wang, X. Q. Shen, S. S. Yao, D. W. Rao, Y. Y. Zhou and X. M. Xi, RSC Adv., 2016, 6, 13680 RSC.
- D. P. Lv, J. M. Zheng, Q. Y. Li, X. Xie, S. Ferrara, Z. M. Nie, L. B. Mehdi, N. D. Browning, J. G. Zhang, G. L. Graff, J. Liu and J. Xiao, Adv. Energy Mater., 2015, 5, 1402290 CrossRef.
- L. L. Peng, G. B. Liu, Y. Wang, Z. L. Xu and H. Liu, J. Solid State Electrochem., 2014, 18, 935 CrossRef CAS.
- W. H. Zhang, D. Qiao, J. X. Pan, Y. L. Cao, H. X. Yang and X. P. Ai, Electrochim. Acta, 2013, 87, 497 CrossRef CAS.
- S. Xin, S. L. Gu, N. H. Zhao, Y. X. Yin, L. J. Zhou, Y. G. Guo and L. J. Wan, J. Am. Chem. Soc., 2012, 134, 18510 CrossRef CAS PubMed.
- Z. Li, B. Li, L. Yin and Y. Qi, ACS Appl. Mater. Interfaces, 2014, 6, 8098 CAS.
- J. Gao, M. A. Lowe, Y. Kiya and H. D. Abruña, J. Phys. Chem. C, 2011, 115, 25132 CAS.
- Z. Q. Li and L. W. Yin, ACS Appl. Mater. Interfaces, 2015, 7, 4029 CAS.
- Y. H. Wu, M. X. Gao, X. Li, Y. F. Liu and H. G. Pan, J. Alloys Compd., 2014, 608, 220 CrossRef CAS.
- L. Miao, W. Wang, A. Wang, K. Yuan and Y. Yang, J. Mater. Chem. A, 2013, 1, 11659 CAS.
- L. Yu, N. Brun, K. Sakaushi, J. Eckert and M. M. Titirici, Carbon, 2013, 61, 245 CrossRef CAS.
- Z. Y. Zhang, Y. Q. Lai, Z. A. Zhang and J. Li, Solid State Ionics, 2015, 278, 166 CrossRef CAS.
- J. Balach, T. Jaumann, M. Klose, S. Oswald, J. Eckert and L. Giebeler, J. Phys. Chem. C, 2015, 119, 4580 CAS.
- U. Stoeck, J. Balach, M. Klose, D. Wadewitz, E. Ahrens, J. Eckert and L. Giebeler, J. Power Sources, 2016, 309, 76 CrossRef CAS.
| This journal is © The Royal Society of Chemistry 2016 |