Greatly enhanced photocatalytic activity of semiconductor CeO2 by integrating with upconversion nanocrystals and graphene

Dongguang Yin*, Feifei Zhao, Lu Zhang, Xinyu Zhang*, Yumin Liu, Tingting Zhang, Chenglong Wu, Dongwei Chen and Zhiwen Chen*
School of Environmental and Chemical Engineering, Shanghai University, Room 608, Shanghai 200444, China. E-mail: xyzhang999@shu.edu.cn; zwchen@shu.edu.cn; ydg@shu.edu.cn; Fax: +86-21-66137787; Tel: +86-21-66137502

Received 29th July 2016 , Accepted 16th October 2016

First published on 26th October 2016


Abstract

CeO2 is an important semiconductor photocatalyst that has been extensively utilized in photocatalysis. However, its photocatalytic efficiency is still not desirable for practical applications with solar light due to the low light absorption efficiency and high recombination rate of photogenerated electron–hole pairs. Up to now, many approaches have been developed to improve the photocatalytic activity of CeO2 and much progress has been made. However, the NIR light that accounts for 46% of the total solar light is unutilized for photocatalysis. In the present study, greatly enhanced photocatalytic activity of CeO2 by integrating upconversion nanocrystals and graphene into CeO2 was achieved for the first time. A novel nanocomposite photocatalyst of NaLuF4:Gd,Yb,Tm@SiO2@CeO2:Tm/graphene was developed, which took advantage of a synergetic effect to enhance the photocatalytic activity of CeO2. The upconversion nanocrystals (UCNCs) absorb the NIR light and transfer energy to CeO2, thus extending the light-responsive range of CeO2 to the NIR region and making CeO2 produce highly energetic electron–hole pairs. Tm-doping narrows the band-gap of CeO2, resulting in a red-shift of the absorption edge for CeO2. Graphene enhances adsorption of pollutants and serves as an effective electron acceptor and transporter. This work provides new insights into the greatest improvement of catalytic activity of CeO2 through effective integration of upconversion material, CeO2, and graphene into a hetero-nanocomposite structure. This strategy can be widely used to fabricate semiconductor-based nanocomposite photocatalysts with high photocatalytic activities and facilitate their applications in environmental protection issues using solar light.

1. Introduction

CeO2 is an n-type semiconductor, which has a band gap (3.2 eV) similar to TiO2. It has some properties like titania such as chemical inertness, low cost, non-toxicity, and stability against photoirradiation.1–6 Moreover, CeO2 can absorb a larger fraction of the solar spectrum than TiO2 (ref. 7 and 8) and has an easy redox nature of Ce4+/Ce3+ couple transformation that may support the charge carrier transfer to the catalyst surface and give rise to oxygen vacancies.9,10 Owing to its unique properties, CeO2 is a superior semiconductor photocatalyst.11 To date, CeO2 has attracted much attention and has been extensively utilized in photocatalysis.12–19 However, the photocatalytic efficiency of CeO2 is still not desirable for practical applications due to its low light absorption efficiency and high recombination rate of photogenerated electron–hole pairs.20 So far, many approaches have been developed to improve the photocatalytic activity of CeO2, such as doping with transition metal ions, coupling with narrow bandgap semiconductors, combining with carbon supporting materials, etc.21–27 Although much progress has been made to improve the catalytic activity of CeO2, efficient NIR absorption for photocatalysis is still unreached with previously reported methods and organic pollutants are hard to degrade completely with the catalyst under irradiation of visible light. Therefore, a substantial improvement of photocatalytic activity of CeO2 and large-scale applications of CeO2-based photocatalysts to solve environmental and energy problems need further innovational works.

In the present study, we designed a novel CeO2-based nanocomposite photocatalyst. The composite includes core/shell structure upconversion nanocrystals (UCNCs) of NaLuF4:Gd,Yb,Tm@SiO2 and nanoparticles of Tm3+-doped CeO2 dispersing around the UCNCs, which are loaded on the supporter of graphene (GN). Based on the designed structure, the upconversion nanocrystals, Tm-doping, and graphene have a synergistic effect that can improve catalytic activity of CeO2 tremendously. The NaLuF4:Gd,Yb,Tm absorbs the NIR light and transfers energy to CeO2, which extends the light-responsive range of CeO2 to the NIR region and makes CeO2 produce highly energetic electron–hole pairs.28,29 Tm-doping can narrow the band-gap of CeO2, resulting in a red-shift of the absorption edge for CeO2. Graphene can enhance adsorption of pollutants and serve as an effective electron acceptor and transporter owing to its two-dimensional π-conjugation structure.30–33

2. Experimental section

2.1 Materials

Rare earth oxides Lu2O3 (99.999%), Gd2O3 (99.999%), Yb2O3 (99.999%), and Tm2O3 (99.999%) were purchased from Shanghai Yuelong New Materials Co. Ltd. Oleic acid (OA) (>90%), 1-octadecene (>90%), (3-aminopropyl)triethoxysilane (APTES) (>98%), titanium(IV) ethoxide (>98%), sodium carbonate, ethanol, octanol, Triton X-100, tetraethoxysilane (TEOS), NH3·H2O (28 wt%), Ce(NO)3, trifluoroacetic acid, sodium citrate, and cyclohexane were supplied by Sinopharm Chemical Reagent Co., Ltd. (Shanghai). Rhodamine B (RhB) and cerium nitrate hexahydrate (Ce(NO3)3·6H2O) were purchased from Sigma-Aldrich. Ln(CF3COO)3 (Ln: Lu, Gd, Yb, Tm) precursors were prepared by dissolving the corresponding metal oxides in trifluoroacetic acid at elevated temperatures.

2.2 Synthesis of NaLuF4:Gd,Yb,Tm@SiO2

The core–shell upconversion nanocrystal of NaLuF4:Gd,Yb,Tm@SiO2 was prepared by using our previous method.28 To synthesize NaLuF4:Gd,Yb,Tm, 10 mL of the coordinating oleic acid (90%) ligand and 10 mL of the non-coordinating solvent 1-octadecene (90%) were added to the reaction vessel (solution A). Sodium trifluoroacetate (98%, 2 mmol) and lanthanide trifluoroacetate precursors (1 mmol) were added to the solution containing 5 mL of oleic acid and 5 mL of 1-octadecene (solution B). Both solutions A and B were heated to 120 °C under vacuum with magnetic stirring and kept for 30 min. Then solution A was heated to 310 °C under nitrogen and solution B was added to the reaction vessel dropwise at a rate of 1.5 mL min−1. The mixture was maintained at this temperature and stirred vigorously for 60 min, then cooled down to 80 °C. The formed nanocrystals were precipitated from the solution by addition of excess of ethanol and collected by centrifugation after washing with hexane/ethanol (1[thin space (1/6-em)]:[thin space (1/6-em)]1, v/v) three times.

To synthesize NaLuF4:Gd,Yb,Tm@SiO2, 6.7 mL of octanol and 12 mL of Triton X-100 were dispersed in 50 mL of cyclohexane with sonication and stirring. Then, 5 mL of cyclohexane suspension containing UCNCs (0.1 mmol mL−1) was added. The mixture was magnetically stirred for 30 min, and then 0.4 mL of (28 wt%) ammonium hydroxide solution was added to obtain a reverse microemulsion solution. After stirring for 1 h, 0.3 mL of TEOS was added and the resulted reaction mixture was aged for 14 h with stirring. The final product of NaLuF4:Gd,Yb,Tm@SiO2 was collected by centrifugation and washed several times with water and ethanol.

2.3 Preparation of CeO2

CeO2 was prepared by homogeneous precipitation and subsequent calcination process. First, cerium nitrate hexahydrate (Ce(NO3)3·6H2O) was dissolved in 80% ethylene glycol (C2H6O2) and kept under stirring at 50 °C until a homogeneous solution was obtained. Then, 3.0 mol L−1 ammonia solution (NH4OH) was added. The color of solution changed from purple to yellow. Afterwards, the mixture was aged at 50 °C for 12 h. The purple suspension became turbid and yellow. The suspension was washed with deionized water/ethanol, and then dried in a vacuum oven at 70 °C for 24 h. Finally, the single-phase CeO2 product was calcined at 500 °C for 1 h.

2.4 Preparation of UCNCs@SiO2@CeO2

The NaLuF4:Gd,Yb,Tm@SiO2@CeO2 core–shell nanoparticles were synthesized by using a method similar to single-phase CeO2 preparation but with a minor modification, which was that the as-prepared NaLuF4:Gd,Yb,Tm@SiO2 core–shell particle was added to the mixed solution of cerium nitrate hexahydrate and 80% ethylene glycol solution before ammonia solution (3.0 mol L−1) was introduced into the mixture.

2.5 Preparation of UCNCs@SiO2@CeO2:Tm

The as-obtained NaLuF4:Gd,Yb,Tm@SiO2@CeO2 nanoparticle were mixed with 17 mL of deionized water containing 0.17 g of Tm(NO3)3 with sonication and magnetic stirring for 30 min. The resulted suspension was transferred to a dry Teflon-lined stainless steel autoclave and heated at 180 °C for 24 h in an electric oven. The final product was collected by centrifugation, washed with deionized water and ethanol three times, and then dried at 60 °C in a vacuum oven overnight.

2.6 Preparation of UCNCs@SiO2@CeO2:Tm/GN

The graphene oxide (GO) nanosheets were produced as described previously.24 To synthesize UCNCs@SiO2@CeO2:Tm/GN composites, 2.5 mg of GO was dispersed in 10 mL of deionized water with sonication for 2 h to form a stable GO colloidal, and then a specific amount of UCNCs@SiO2@CeO2:Tm was added and the mixture was stirred for 10 min. Subsequently, 20 mL of ethylene glycol was added and the mixture was stirred for 30 min. The resulted suspension was transferred to a round bottom flask and heated at 100 °C for 6 h in an oil bath. The final product UCNCs@SiO2@CeO2:Tm/GN was collected by centrifugation, washed with deionized water three times, and then dried at 60 °C in a vacuum oven overnight.

2.7 Characterization

The sizes and morphologies of the prepared products were characterized using a JEOL JEM-2010F transmission electron microscope (TEM) operating at 200 kV. The crystal phase structures of the as-prepared samples were examined by powder X-ray diffraction (XRD) measurements performed on a Rigaku D/max-2500 X-ray diffractometer using Cu-Kα radiation. The scan was performed in the 2θ range from 10° to 80° with a scanning rate of 8° min−1. The upconversion luminescence spectra were recorded with an Edinburgh LS-920 fluorescence spectrophotometer using an external 0–2 W adjustable laser (980 nm, Beijing Hi-Tech Optoelectronic Co, China) as the excitation source instead of the xenon lamp source in the spectrophotometer. The UV-Vis absorption spectra were obtained on a Hitachi 3010 UV-Vis spectrophotometer (Hitachi, Japan).

2.8 Photocatalytic experiments

Photocatalysis was performed via monitoring RhB degradation by measuring the variation of optical absorption of RhB with a Hitachi U-3010 spectrophotometer, using SGY-IB multifunction of a photochemical reactor (Nanjing Sidongke Electric Co. Ltd) as a photocatalytic reaction device. In a typical experiment, 20 mg of sample (catalyst) was dispersed into a quartz cuvette containing 50 mL of RhB aqueous solution (20 mg L−1). The suspension was magnetically stirred in the dark for 30 min to attain an adsorption–desorption equilibrium between the dye and catalyst. Then the photoreaction vessels were exposed to simulated solar light irradiation produced by a 500 W Xe lamp (PL-X500D) (wavelength range: 300–2500 nm). At given time intervals, the photoreacted solutions were analyzed by recording variations of the absorption band maximum (554 nm) in the UV-visible spectra of RhB. The degradation ratio η (%) of the dye was calculated by using the following equation:
η (%) = 100 × [(C0C)]/C0

= 100 × [(A0A)]/A0
where C0 and C are the initial and residual concentrations of RhB in the solution, respectively, and A0 and A are the absorbance of RhB at 554 nm before and after exposure under simulated solar light, respectively.

3. Results and discussion

3.1 Phase and morphology

Fig. 1 shows the X-ray diffraction (XRD) patterns of the prepared products. As shown in Fig. 1, both prepared CeO2 and UCNCs@SiO2@CeO2:Tm/GN showed characteristic diffraction peaks of cubic fluorite structure CeO2, which were in good agreement with the standard data (JCPDS no. 34-0394).18 The peaks originate from (111), (200), (220), (311), (400), and (331) crystal planes, respectively.18,32 UCNCs@SiO2@CeO2:Tm/GN showed a typical hexagonal phase of NaLuF4 (JCPDS no. 27-0276) and a typical cubic fluorite phase of CeO2,34 confirming the formation of the composite catalysts. In addition, UCNCs@SiO2@CeO2:Tm/GN showed a broad and weak diffraction peak at of about 24° that was ascribed to graphene.35
image file: c6ra19219j-f1.tif
Fig. 1 XRD patterns of CeO2 (a), UCNCs (b), and UCNCs@SiO2@CeO2:Tm/GN (c).

TEM images of the prepared products are shown in Fig. 2. As shown in Fig. 2a, NaLuF4:Gd,Yb,Tm nanocrystals have a hexagonal and plate-like structure with a diameter of about 45 nm, which were well-dispersed and uniformed in morphology and size. The TEM image of UCNCs@SiO2 (Fig. 2b and c) showed that a light and smooth layer of SiO2 with a thickness of about 24 nm was coated on the surface of the UCNCs. Fig. 2c showed that a large amount of tiny nanoparticles (<10 nm) of CeO2 were formed and dispersed around the UCNCs, where the size and morphology of the UCNCs remained unchanged. These small-sized CeO2 nanoparticles dispersed around the surface of the UCNCs can result in a high specific surface area that enhances the contact with contaminants for efficient photocatalytic degradation. Fig. 2d showed that the nanoparticles of UCNCs@SiO2@CeO2:Tm were homogenously loaded on the GN sheets surface. The HRTEM images of NaLuF4:Gd,Yb,Tm (Fig. 2a, inset) and CeO2 (Fig. 2c, inset) revealed highly crystalline nature of the as-prepared products.18,32,34 The interplanar distances between adjacent lattice fringes corresponded to the crystal planes of the nanocrystals, well consistent with the results obtained with XRD. The composition of NaLuF4:Gd,Yb,Tm@SiO2@CeO2:Tm was characterized by EDX analysis. As shown in Fig. 2e, all of the elements, including Na, Lu, F, Gd, Yb, Tm, Ce, Si, and O, were detected, further confirming the formation of the nanocomposite photocatalyst.


image file: c6ra19219j-f2.tif
Fig. 2 The TEM images of UCNCs (a), UCNCs@SiO2 (b), UCNCs@SiO2@CeO2:Tm (c), and UCNCs@SiO2@CeO2:Tm/GN (d). The HRTEM images of UCNCs (a, inset) and CeO2 (c, inset). The EDX spectra of UCNCs@SiO2@CeO2:Tm (e).

3.2 UV-Vis absorption spectroscopy

UV-Vis-NIR absorption spectra of the prepared products are shown in Fig. 3. The light absorption edges before 400 nm for CeO2 and composites corresponded to the band gap absorptions of CeO2.20 Based on the spectra, it could be speculated that the UV-visible photos generated by the upconversion process of UCNCs could be absorbed by CeO2 via energy transfer. In comparison to CeO2, there was an obvious red shift of the absorption edge and stronger absorption in the visible region for the composites. This could be mainly assigned to the narrowing of the band-gap of CeO2 caused by the Tm-doping. Tm-doping led to a charge-transfer transition between Tm3+ and the CeO2 conduction or valence band, resulting in a red shift of the absorption edge of CeO2. It has been reported that metal doping can form a dopant energy level within the band gap of CeO2, and the electronic transitions from the valence band to the dopant level or from the dopant level to the conduction band can effectively cause a red shift of the band edge absorption threshold.23,36–38 It was worth noting that UCNCs@SiO2@CeO2:Tm/GN presented stronger absorption in the visible region in comparison to UCNCs@SiO2@CeO2:Tm. This could be attributed to the presence of GN nanosheets in the composite photocatalyst.39–41
image file: c6ra19219j-f3.tif
Fig. 3 The UV-Vis absorption spectra of the prepared samples.

3.3 Upconversion luminescence

The upconversion luminescence properties of the as-prepared products were investigated. The UCL intensities of the samples were measured at the same concentrations of 1.0 mg mL−1 in cyclohexane. As shown in Fig. 4, each of them showed typical characteristic UCL of Tm3+ under CW excitation at 980 nm. The UV emission peaks centered at 361 nm was attributed to the transition of Tm3+ ion: 1D23H6.29,42 The visible emission peaks at 450, 476, 645, and 697 nm were assigned to 1D23H4, 1G43H6, 1G43F4, and 3F33H6 transitions of Tm3+ ion, respectively.42,43 The luminescence intensity of NaLuF4:Gd,Yb,Tm@SiO2 decreased to some extent in comparison to that of pure NaLuF4:Gd,Yb,Tm due to the light scattering effects by the silica layer.44 However, this SiO2 layer could prevent the electron trapping caused by surface defects and ligands of bare NaLuF4:Gd,Yb,Tm,45 and prevent the upconversion nanoparticles from photocatalysis-induced corrosion, thus prolonging its lifetime.46 After further CeO2 coating, the luminescence intensity decreased significantly in comparison to NaLuF4:Gd,Yb,Tm@SiO2. The light emitted by UCNCs in the UV and visible regions nearly disappeared, which was attributed to absorbance of the CeO2 shell caused by an energy transfer process between UCNCs and CeO2 according to the Förster resonance energy transfer (FRET) mechanism. These results were similar to those obtained in our previous studies on composite photocatalysts of NaLuF4:Gd,Yb,Tm@SiO2@TiO2:Mo and NaLuF4:Gd,Yb,Tm@SiO2@Ag@TiO2.34,47 The light emitted by UCNCs@SiO2@CeO2:Tm/GN in the visible regions was weaker than that in the absence of GN. This may be caused by absorbance of GN.39–41
image file: c6ra19219j-f4.tif
Fig. 4 The upconversion luminescence spectra of the prepared products under 980 nm excitation.

3.4 Photocatalysis

Graphene, which consists of a well-defined two-dimensional honeycomb-like network of carbon atoms, has been emerging as a fascinating material due to its superior electronic conductivity, remarkable structural flexibility, prominent thermal stability, and high specific surface area.31,34,48–51 The combination of these intriguing properties of graphene with distinctive characteristics of other functional nanomaterials has become a popular pathway for achieving specific applications in various fields.39,40 Works of ours and others have demonstrated that combination of semiconductor catalyst with graphene could improve the photocatalytic activity of catalyst remarkably.39–41 In the present study, we coupled the nanocomposite catalyst UCNCs@SiO2@CeO2:Tm with graphene to further enhance the catalytic activity of the product.

RhB was used as a model pollutant to investigate the photocatalytic property of composite UCNCs@SiO2@CeO2:Tm/GN. A 500 W xenon lamp (wavelength range at 300–2500 nm) was used to simulate the solar light. Upon irradiation for designated periods, 1 mL of RhB aqueous solution was withdrawn and diluted to 4 mL for absorbance measurement. Fig. 5 showed the absorbance spectra of RhB under simulated solar light irradiation as a function of irradiation time with the composite as the photocatalyst. It was clear that the absorption intensity of RhB at 554 nm decreased gradually with the increase in irradiation time, indicating degradation of RhB upon the simulated solar light irradiation.


image file: c6ra19219j-f5.tif
Fig. 5 The absorbance spectra of RhB catalyzed by the UCNCs@SiO2@CeO2:Tm/GN nanocomposite at different irradiation time points under simulated solar light irradiation.

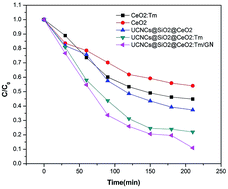
The photocatalytic efficiency of the composite could be evaluated through calculating the time-depended degradation ratio of RhB by using CeO2, CeO2:Tm, and UCNCs@SiO2@CeO2:Tm as controls. Fig. 6 showed the time profile of C/C0 under simulated solar light irradiation, where C and C0 are the concentrations of RhB at the indicated time point and before irradiation (after the adsorption equilibrium with the photocatalysts were reached), respectively. It could be seen from Fig. 6, the photocatalytic efficiency of UCNCs@SiO2@CeO2:Tm/GN composite was obviously higher than those of controls. RhB almost completely degraded (95%) in the presence of the catalyst after being exposed under Xe lamp for 210 min, whereas the degradation ratios obtained with CeO2, CeO2:Tm, and UCNCs@SiO2@CeO2:Tm were only 46%, 55%, and 82%, respectively. The reaction kinetics for RhB photodegradation was fitted with a Langmuir–Hinshelwood kinetic model.38 As shown in Fig. 7, the first-order rate equation, −ln(C/C0) = kt, showed a good fit to the data, where C/C0 is the value given by Fig. 6 and k is the apparent rate constant. According to the plots, the calculated apparent rate constants were 1.12 × 10⁻², 8.17 × 10⁻³, 3.80 × 10⁻³, and 2.93 × 10⁻³ min−1 for UCNCs@SiO2@CeO2:Tm/GN, UCNCs@SiO2@CeO2:Tm, CeO2:Tm, and CeO2, respectively. Usually, a high apparent rate constant indicates a high catalytic reaction rate and high catalytic activity of the catalyst.


image file: c6ra19219j-f6.tif
Fig. 6 Photocatalytic degradation of RhB under simulated solar light irradiation.

image file: c6ra19219j-f7.tif
Fig. 7 Kinetics of RhB degradation under simulated solar light irradiation.

The photocatalytic activity of UCNCs@SiO2@CeO2:Tm was higher than that of CeO2:Tm, which could be attributed to the function of UCNCs. The UCNCs could absorb the NIR light and convert it into UV and visible light, which could be absorbed by CeO2. By utilizing the UCNCs, NIR irradiation could be absorbed and harvested indirectly by CeO2 to broaden the absorption region and consequently enhance the photocatalytic activity of CeO2.52 Furthermore, when the highly energetic UV photons created by UCNCs are absorbed by CeO2, they can drive CeO2 to generate highly energetic electron and hole pairs.34 These highly energetic electron and hole pairs have strong oxidation–reduction abilities, leading to highly catalytic activity.38 The photocatalytic activities of UCNCs@SiO2@CeO2:Tm and CeO2:Tm were higher than those of UCNCs@SiO2@CeO2 and CeO2, respectively, suggesting that Tm-doping could increase the photocatalytic activity. The introduction of Tm3+ into CeO2 can effectively extend the spectral response from UV to visible area due to the newly-appeared dopant energy band that narrows the band gap of CeO2.53 Moreover, doping trivalent rare-earth ions in CeO2 can create oxygen vacancies,34 which increase the density of oxygen vacancies at the surface of the photocatalyst. These oxygen vacancies act as electron traps, preventing the electron–hole recombination.34 Additionally, the photocatalytic activity of UCNCs@SiO2@CeO2:Tm/GN was higher than that of UCNCs@SiO2@CeO2:Tm, which could be attributed to the function of GN. GN plays two important roles for the photocatalysis. One is to serve as an effective electron acceptor and transporter owing to its two-dimensional π-conjugation structure,51 which promote the separation of charge carriers and transportation of photogenerated electrons. This is responsible for the enhancement of photocatalytic performance of the catalyst. The other is to increase the specific surface area owing to its giant π-conjugation system and two-dimensional planar structure,41 which enhances the adsorption for pollutants. Furthermore, the interfacial interaction between semiconductor SeO2 and graphene causes a small band gap of SeO2/RN and formation of a heterojunction.33 The small band gap leads to the absorption in the entire visible spectrum, and even in the infrared region, and thus enhances photocatalytic activity. The heterojunction, charge redistribution takes place for in the whole graphene and several atomic layers in CeO2, besides the interface due to a strong donor–acceptor interaction, leading to a large amount of charge transferred.33 In addition, GN has another function that is to prevent the nanoparticles agglomeration.41

To investigate the durability of the photocatalytic activity of the product UCNCs@SiO2@CeO2:Tm/GN under simulated solar irradiation, we repeated the same photocatalytic degradation test for four cycles. As shown in Fig. 8, both the simulated solar and NIR-driven photocatalytic activities of the product changed little, suggesting that the product was very stable.


image file: c6ra19219j-f8.tif
Fig. 8 Repeated photocatalytic activity measurements with the presence of catalysts under the irradiations of simulated solar light.

3.5 Mechanism

Fig. 9 showed the overall processes for photocatalysis of the composite catalyst under solar light irradiation, including the formation of the excited state of Tm3+, activation of CeO2 via energy transfer, the charge migration between the semiconductor and the generation of free radicals. As its intrinsic property, the outer CeO2 layer can quickly absorb UV from solar light. The high penetrability of NIR light from solar light allows it to enter into the inner to excite the upconversion nanocrystals NaLuF4:Gd,Yb,Tm, emitting UV and visible light. Then, the upconverted UV light will pass through the transparent SiO2 layer to excite the outer CeO2 nanocrystals via an energy transfer process (FRET). After absorbing solar and upconverted light, the excited CeO2 generates electron–hole pairs. These electron–hole pairs then migrate from the inner region to the surfaces and act as catalytic centres. Meanwhile, as the nanoparticles of UCUCs@SiO2@CeO2:Tm are deposited on the graphene sheet surface, the photogenerated electrons easily move to the graphene sheet. This makes the charge separation more efficient and reduces the probability of recombination. These electrons and holes can not only directly decompose pollutants, but also degrade pollutants indirectly through ˙OH and ˙O2 radicals that are produced from hole-oxidizing H2O and electron-reducing O2 molecules, respectively.38 As shown in Fig. 9, the excited electrons arriving on the surface react with the oxygen adsorbed on the surface of CeO2 to form O2− or O22−, which combines with H+ to form hydrogen peroxide (H2O2). H2O2 reacts with superoxide radical anion (˙O2) to generate hydroxyl radical (˙OH). These reactive oxygen species (˙OH, ˙O2 and H2O2), especially ˙OH and ˙O2, could directly take part in the photocatalytic degradation reaction to degrade RhB. The processes are presented as following equations.
TiO2 + ħν → e + h+

h+ + H2O2 → H+ + ˙OH

e + H+ + O2 → H2O2

e + O2 → ˙O2

˙O2 + H2O2 → ˙OH + OH + O2

image file: c6ra19219j-f9.tif
Fig. 9 Diagrams of the energy levels of Yb3+–Tm3+ and the upconversion luminescence process. The energy transfer from the excited Tm3+ to CeO2 through FRET. The main photocatalytic processes.

4. Conclusion

In summary, a novel composite photocatalyst NaLuF4:Gd,Yb,Tm@SiO2@CeO2:Tm/GN was fabricated for the first time. Its morphology, crystalline phase, composition, and spectra were characterized and its photocatalytic properties were investigated. The significantly enhanced photocatalytic activity of the as-prepared nanocomposite in comparison with bare CeO2 was demonstrated by degradation of RhB under simulated sunlight irradiation, which could be attributed to the extended-light responsive range to the NIR region, the red-shifted absorption edge, improved separation of electron–hole pairs for CeO2, and enhanced adsorption of pollutants due to the presence of UCNCs, graphene, and Tm-doping. This study presented a new strategy to effectively enhance the photocatalytic activity of CeO2 under solar light irradiation by artificially integrating CeO2, UCNCs, and graphene into a hetero-composite nanostructure. It was expected that this convenient assembly approach could be widely utilized to prepare semiconductor-based nanocomposite photocatalysts with highly photocatalytic activity for practical applications in environmental cleaning.

Conflict of interest

The authors declare no competing financial interest.

Acknowledgements

The authors gratefully acknowledge the National Natural Science Foundation of China (No. 21271126, 11375111, 11428410), Program for Innovative Research Team in University (No. IRT 13078), and National 973 Program (No. 2010CB933901).

References

  1. N. S. Arul, D. Mangalaraj, P. C. Chen, N. Ponpandian and C. Viswanathan, Mater. Lett., 2011, 65, 3320–3322 CrossRef.
  2. M. Xu, S. Xie, X. H. Lu, Z. Q. Liu, Y. Huang, Y. Zhao, J. Ye and Y. X. Tonga, J. Electrochem. Soc., 2011, 158, 41–44 CrossRef.
  3. Z. R. Tang, Y. Zhang and Y. Xu, RSC Adv., 2011, 1, 1772–1777 RSC.
  4. M. D. Hernandez-Alonso, A. B. Hungria, A. Martinez-Arias, M. Fernandez-Garcia, J. M. Coronado and J. C. Conesa Soria, Appl. Catal., B, 2004, 50, 167–175 CrossRef CAS.
  5. Y. Zhai, S. Zhang and H. Pang, Mater. Lett., 2007, 61, 1863–1866 CrossRef CAS.
  6. F. Chen, Y. Cao and D. Jia, Appl. Surf. Sci., 2011, 257, 9226–9231 CrossRef CAS.
  7. J. E. Fallah, L. Hilaire, M. Romeo and F. L. Normand, J. Electron Spectrosc. Relat. Phenom., 1995, 73, 89–103 CrossRef.
  8. P. F. Ji, J. L. Zhang, F. Chen and M. Anpo, J. Phys. Chem. C, 2008, 112, 17809–17813 CAS.
  9. R. G. Ranga and B. G. Mishra, J. Indian Chem. Soc., 2003, 2, 122–134 Search PubMed.
  10. B. Choudhury, P. Chetri and A. Choudhury, RSC Adv., 2014, 4, 4663–4671 RSC.
  11. L. Jiang, M. Yao, B. Liu, Q. Li, R. Liu and H. Lv, J. Phys. Chem. C, 2012, 116, 11741–11745 CAS.
  12. F. B. Noronha, E. C. Fendley, R. R. Soares, W. E. Alvarez and D. E. Resasco, Chem. Eng. J., 2001, 82, 21–31 CrossRef CAS.
  13. X. Liu, K. Zhou, L. Wang, B. Wang and Y. J. Li, J. Am. Chem. Soc., 2009, 131, 3140–3141 CrossRef CAS PubMed.
  14. F. Hayashi and M. Iwamoto, ACS Catal., 2013, 3, 14–17 CrossRef CAS.
  15. Z. M. Yang, G. F. Huang, W. Q. Huang, J. M. Wei, X. G. Yan, Y. Y. Liu, C. Jiao, Z. Wan and A. Pan, J. Mater. Chem. A, 2014, 2, 1750–1756 CAS.
  16. J. Luo, X. S. Zhou, L. Ma and X. Y. Xu, RSC Adv., 2015, 5, 68728–68735 RSC.
  17. L. Chen, D. W. Meng, X. L. Wu, A. Q. Wang, J. X. Wang, Y. Q. Wang and M. H. Yu, J. Phys. Chem. C, 2016, 120, 18548–18559 CAS.
  18. I. I. Soykal, H. Sohn and U. S. Ozkan, ACS Catal., 2012, 2, 2335–2348 CrossRef CAS.
  19. S. K. Meher and G. R. Rao, ACS Catal., 2012, 2, 2795–2809 CrossRef CAS.
  20. L. Rolf and S. Göran, Global Environ. Polit., 2015, 15, 1–20 Search PubMed.
  21. A. Fujishima, X. Zhang and D. A. Tryk, Surf. Sci. Rep., 2008, 63, 515–582 CrossRef CAS.
  22. S. G. Kumar and L. G. Devi, J. Phys. Chem. A, 2011, 115, 13211–13241 CrossRef CAS PubMed.
  23. J. C. Yu, G. S. Li, X. C. Wang, X. L. Hu, C. W. Leung and Z. D. Zhang, Chem. Commun., 2006, 25, 2717–2719 RSC.
  24. H. Matsui, Y. Saitou, S. Karuppuchamy, M. A. Hassan and M. Yoshihara, J. Alloys Compd., 2012, 538, 177–182 CrossRef CAS.
  25. D. G. Yin, X. Z. Cao, L. Zhang, J. X. Tang and M. H. Wu, Dalton Trans., 2015, 44, 11147–11154 RSC.
  26. D. Channei, B. Inceesungvorn, N. Wetchakun, S. Ukritnukun, A. Nattestad, J. Chen and S. Phanichphant, Sci. Rep., 2014, 4, 5757 CrossRef CAS PubMed.
  27. A. D. Liyanage, S. D. Perera, K. Tan, Y. Chabal and K. J. Balkus, ACS Catal., 2014, 4, 577–584 CrossRef CAS.
  28. Y. Tang, W. H. Di, X. S. Zhai, R. Y. Yang and W. P. Qin, ACS Catal., 2013, 3, 405–412 CrossRef CAS.
  29. C. C. Wang, K. L. Song, Y. Feng, D. G. Yin, J. Ouyang, B. Liu, X. Z. Cao, L. Zhang, Y. L. Han and M. H. Wu, RSC Adv., 2014, 4, 39118–39125 RSC.
  30. A. K. Geim and K. S. Novoselov, Nat. Mater., 2007, 6, 183–191 CrossRef CAS PubMed.
  31. K. S. Kim, Y. Zhao, H. Jang, S. Y. Lee, J. M. Kim, J. H. Ahn, P. Kim, J. Y. Choi and B. H. Hong, Nature, 2009, 457, 706–710 CrossRef CAS PubMed.
  32. D. Yang, L. Wang, Y. Sun and K. Zhou, J. Phys. Chem. C, 2010, 114, 8926–8932 CAS.
  33. L. Xu, W. Q. Huang, L. L. Wang and G. F. Huang, ACS Appl. Mater. Interfaces, 2014, 6, 20350–20357 CAS.
  34. N. Niu, P. P. Yang, F. He, X. Zhang, S. L. Gai, C. X. Li and J. Lin, J. Mater. Chem., 2012, 22, 10889–10899 RSC.
  35. Z. Ji, X. Shen, M. Li, H. Zhou, G. Zhu and K. Chen, Nanotechnology, 2013, 24, 115603–115612 CrossRef PubMed.
  36. Y. G. Wang, F. Wang, Y. T. Chen, D. F. Zhang, B. Li, S. F. Kang, X. Li and L. F. Cui, Appl. Catal., B, 2014, 4, 602–609 CrossRef.
  37. M. A. Barakat, H. Schaeffer, G. Hayes and S. Ismat-Shah, Appl. Catal., B, 2005, 57, 23–30 CrossRef CAS.
  38. D. Anjalee, Y. G. Li, S. D. Perera, K. Tan, Y. Chabal and K. J. Balkus, ACS Catal., 2014, 4, 577–584 CrossRef.
  39. S. Stankovich, D. A. Dikin, G. H. B. Dommett, K. M. Kohlhaas, E. J. Zimney, E. A. Stach, R. D. Piner, S. T. Nguyen and R. S. Ruoff, Nature, 2006, 442, 282–286 CrossRef CAS PubMed.
  40. J. W. Qin, M. H. Cao, N. Li and C. W. Hu, J. Mater. Chem., 2011, 21, 17167–17171 RSC.
  41. D. G. Yin, L. Zhang, B. H. Liu and M. H. Wu, J. Nanosci. Nanotechnol., 2012, 12, 937–942 CrossRef CAS PubMed.
  42. Y. W. Zhang, X. Sun and R. Si, J. Am. Chem. Soc., 2005, 127(10), 3260–3261 CrossRef CAS PubMed.
  43. S. H. Tang, J. N. Wang, C. X. Yang, L. X. Dong, D. L. Kong and X. P. Yan, Nanoscale, 2014, 6, 8037–8044 RSC.
  44. P. Zhao, Y. H. Zhu, X. L. Yang, X. Jiang, J. H. Shen and C. Z. Li, J. Mater. Chem. A, 2014, 2, 16523–16530 CAS.
  45. L. L. Liang, Y. M. Liu, C. H. Bu, K. M. Guo, W. W. Sun, N. Huang, T. Peng, B. Sebo, M. M. Pan, W. Liu, S. S. Guo and X. Z. Zhao, Adv. Mater., 2013, 25, 2174–2180 CrossRef CAS PubMed.
  46. J. Kummerlen, A. Leitner, H. Brunner, F. R. Aussenegg and A. Wokaun, Mol. Phys., 1993, 80, 1031–1046 CrossRef.
  47. D. G. Yin, L. Zhang, X. Z. Cao, J. X. Tang, Z. W. Chen, Y. M. Liu, T. T. Zhang and M. H. Wu, Dalton Trans., 2016, 45, 1467–1475 RSC.
  48. D. A. Dikin, S. Stankovich, E. J. Zimney, R. D. Piner, G. H. B. Dommett, G. Evmenenko, S. T. Nguyen and R. S. Ruoff, Nature, 2007, 448, 457–460 CrossRef CAS PubMed.
  49. C. Lee, X. D. Wei, J. W. Kysar and J. Hone, Science, 2008, 321, 385–388 CrossRef CAS PubMed.
  50. A. K. Geim, Science, 2009, 324, 1530–1534 CrossRef CAS PubMed.
  51. A. Peigney, C. Laurent, E. Flahaut, R. R. Bacsa and A. Rousset, Carbon, 2001, 39, 504–514 CrossRef.
  52. Z. W. Yang, H. J. Wu, J. Li, B. Shao, J. B. Qiu and Z. G. Song, J. Alloys Compd., 2015, 641, 127–131 CrossRef CAS.
  53. A. Patra, P. Ghosh, P. S. Chowdhury, A. R. C. M. Alencar, B. Whualkuer Lozano, N. Rakov and G. S. Maciel, J. Phys. Chem. B, 2005, 109, 10142–10146 CrossRef CAS PubMed.

This journal is © The Royal Society of Chemistry 2016
Click here to see how this site uses Cookies. View our privacy policy here.