Role of Fe in the oxidation of methanol electrocatalyzed by Ni based layered double hydroxides: X-ray spectroscopic and electrochemical studies

Ylea Vlamidisa, Sonia Fiorillib, Marco Giorgetti*a, Isacco Gualandia, Erika Scavettaa and Domenica Tonelli*a
aDipartimento di Chimica Industriale “Toso Montanari”, Alma Mater Studiorum – Università di Bologna, Viale Risorgimento 4, 40136 Bologna, Italy. E-mail: domenica.tonelli@unibo.it; marco.giorgetti@unibo.it; Fax: +39-0512093690; Tel: +39-2093667 Tel: +39-2093666
bDipartimento di Scienza Applicata e Tecnologia, Politecnico di Torino, Corso Duca degli Abruzzi 24, 10129 Torino, Italy

Received 28th July 2016 , Accepted 15th November 2016

First published on 16th November 2016


Abstract

Ni/Al and Ni/Fe layered double hydroxides (LDHs) were electrosynthesized on Pt electrodes to be used as catalysts for the development of methanol fuel cells. The electrochemical characterization and the electrocatalytic activity of the two LDHs towards methanol electro-oxidation in alkaline conditions were investigated. Furthermore, the role of Fe on the electronic and structural properties of the LDHs was investigated performing X-ray Absorption Spectroscopy (XAS) and X-ray photoelectron spectroscopy (XPS). By the means of these techniques the materials were studied just electrosynthesized and after potentiostatic oxidation. The percentage of Ni active sites in the Ni/Fe LDH was higher than that of Ni/Al LDH, leading to a more efficient catalytic effect towards methanol oxidation in terms of current recorded at any potential value. Furthermore, methanol oxidation occurred at a lower potential for the same current density in the case of Ni/Fe LDH. The electrocatalytic performance displayed by the Ni/Fe LDH suggested the occurrence of a synergic effect between Ni and Fe sites, even if Fe is not directly involved in the redox process, and this evidence was confirmed by XAS and XPS experiments.

1. Introduction

Direct methanol fuel cells (DMFCs) are attractive power sources for portable electronics due to several advantages such as high-energy efficiency, low operating temperature, easy transportation and fuel storage.1 Most DMFCs operate in acid media thus requiring the use of catalysts based on expensive noble metals, such as Pt or Rh, to increase the rate of the methanol electro-oxidation reaction.2 The most important advantage of alkaline DMFCs is the potential use of non-Pt based catalysts thus widening the range of usable materials, and paving the way for the employment of low cost compounds.

The literature describes the use of several catalysts alternative to Pt for methanol oxidation in alkaline solutions, which are particularly based on Ni derivatives,3–10 and have been successfully used to fabricate new anode systems.

Layered Double Hydroxides (LDHs), also known as anionic clay or hydrotalcite-like compounds have the general formula [M(II)1−xM(III)x(OH)2]q+(An)q/n·mH2O. They are inorganic solids with 2D structural arrangement consisting of positively charged brucite-like layers and exchangeable interlayer anions to obtain electroneutrality. Their properties are easily tunable as many cations and several anions can be introduced in the brucitic layers and interlayer, respectively.11

LDHs containing nickel as the bivalent metal have been widely employed for coating electrode surfaces in order to develop amperometric sensors for oxidizable compounds (alcohols, polyhydric compounds and amines), exploiting the capability of Ni centres to act as redox mediators12–14 according to the following scheme:

 
LDH–Ni(II) + OHsol ⇆ LDH(OH)–Ni(III) + e (1)
 
LDH(OH)–Ni(III) + analytered → LDH–Ni(II) + OHsol + analyteox (2)

Y. Wang et al. demonstrated that Ni/Al LDH can be also employed for the electro-oxidation of high concentrations of MeOH15 with a mechanism different from that occurring at low concentration. They proposed that methanol oxidation takes place both through a chemical oxidation via Fleischmann's mechanism16 and the direct electro-oxidation on the Ni3+ sites, as envisaged by electrocatalysis (see reaction scheme above).

Recently, it has been proposed the use of M/Fe (M = Ni, Co or Li) LDHs to electrocatalyze the oxidation of highly concentrated solutions of small molecules (water, methanol, hydrazine) for energy applications.17 The best performance could be achieved for Ni/Fe LDH and resulted even better than the one displayed by the classical catalysts based on noble metals.

But what is the role of Ni and of Fe in determining such excellent performance?

Several papers in the literature discuss Fe role in promoting the electrocatalytic activity of Ni-based catalysts, taking into account the water oxidation reaction. One of the most quoted hypotheses is that Fe could enhance the activity of Ni(III) centres through a Ni–Fe partial charge-transfer activation process occurring throughout the film.18

This hypothesis has been recently proven by Guo et al. for a Ni/Mn LDH grown on Ni foam.19 The authors pointed out a much faster electron transfer between the active material and the conducting substrate, by electrochemical impedance spectroscopy, in the presence of Mn ions which led to a significant improvement of the overall electrochemical activity of Ni2+/Ni3+ couple.19

Another parameter which seems to play a key role in enhancing the electrocatalytic activity is the structural order degree, as it was found out that the activity of LDHs possessing a disordered structure and many structural defects is higher than the same materials displaying a better crystallinity.20

In this work we study and compare the catalytic activity of LDHs containing Ni as divalent metal and Al or Fe as trivalent one, synthesized by direct electrochemical deposition on Pt and Indium Tin Oxide (ITO) substrates with the aim to investigate the effect of the substitution of Al with Fe on the electrocatalysis of MeOH at high concentration in basic solution, in view of DMFCs development.

The LDHs were prepared by one step electrodeposition through a method developed and optimized by us which is based on the production of hydroxide anions necessary to induce the LDH precipitation on the electrode surface by cathodic reduction of nitrate ions.21

To gain a better insight into the synergetic effect of Ni and Fe cations, their local structure arrangement has been monitored by X-ray absorption spectroscopy on both pristine (just synthesized) and oxidized Ni/Fe LDH, following the consolidated experience in the field. XAS is a powerful structural technique sensitive to short range order and can be applied to disordered, amorphous and crystalline materials. Due to the peculiar structure of the LDHs, a considerable number of studies appeared in the literature concerning the use of XAS as a suitable tool to investigate both structure and charge of the metal ions constituting the LDH material, and a review is available.22

XPS experiments were also performed in order to investigate the oxidation states of the metal cations in the LDHs before and after the oxidation treatment in alkaline solution with the aim of contributing to the debate on the role of Fe in the electrocatalytic capability of Ni sites.

2. Experimental

2.1 Chemicals

All solutions were prepared with doubly distilled (DD) water from a glass distillation apparatus.

The electrosynthesized LDHs were obtained from freshly prepared solutions of the metal nitrates. Nickel(II) nitrate hexahydrate (99.999%) and aluminum nitrate nonahydrate (>96%) were supplied by Sigma-Aldrich. Iron(III) nitrate nonahydrate (99% pure) was purchased by Riedel-de Haën. Methanol (99.8%) and sulfuric acid (95–98% w/w) were purchased from Fluka and J. T. Backer, respectively. The supporting electrolyte for all the electrochemical experiments was 1 M KOH.

2.2 LDHs electrosynthesis and characterizations

All the electrochemical experiments were carried out in a single compartment, three-electrode cell. Electrode potentials were measured with respect to a Hg/HgO/NaOH 1 M electrode, employed for measurements in alkaline solution, or to a Saturated Calomel Electrode (SCE). A Pt electrode wire was used as the counter electrode. All the electrochemical experiments were performed using an Autolab PGSTAT20 (Ecochemie, Utrecht, The Netherlands) potentiostat/galvanostat interfaced with a personal computer.

The working electrode was a Pt disk (geometric area = 0.0314 cm2) which was polished to a mirror-like surface, first with sand-paper, and then with aqueous alumina (0.05 μm) slurry on a wet polishing cloth. After rinsing with DD water the electrodes were submitted to an electrochemical pretreatment consisting in 250 CV cycles between −0.20 and +1.30 V, in 0.1 M H2SO4, at a scan rate of 1 V s−1, followed by the application of a cathodic potential (−0.90 V for 300 s) in 1 M H2SO4, under stirring to remove H2 bubbles. The Ni/Al and Ni/Fe LDH films were deposited on pre-treated Pt electrodes by electrochemical reduction, for 30 s at −0.9 V vs. SCE, of a solution containing the divalent metal salt Ni(NO3)2 at a concentration of 0.0225 M, and Fe(NO3)3 or Al(NO3)3 as the trivalent metal salt at a concentration of 0.0075 M.

Electrochemical Quartz Crystal Microbalance (EQCM) experiments were performed using a MAXTEK PM-710 device, connected to the Autolab potentiostat. The probe was equipped with a 5 MHz AT-cut quartz crystal coated with sputtered Pt (geometric area 1.37 cm2).

2.2.1 XPS data collection and analysis. A PHI 5000 Versaprobe II Scanning X-ray Photoelectron Spectrometer, equipped with a monochromatic Al K-alpha X-ray source (1486.6 eV energy, 15 kV voltage and 1.0 mA anode current), was used to investigate surface chemical composition. A spot size of 100 μm2 was used in order to collect the photoelectron signal for both the high resolution (HR) and the survey spectra. Different pass energy values were exploited: 187.85 eV for survey spectra and 23.5 eV for HR peaks. All the spectra were analyzed by using the Casa XPS software. Peaks shifts were normalized with the C 1s peak set at 284.5 eV and after calibration the background from each spectrum was subtracted using a Shirley-type background. The core level spectra were deconvoluted with a nonlinear iterative least squares Gaussian fitting procedure. All survey scans were analyzed to determine the composition of the analyzed samples by applying the proper sensitivity factors.

The samples were prepared on Pt electrode plates (geometric area = 1 cm2), performing 10 electrodeposition steps at the same electrode (total deposition time of 300 s).

Besides the films as such, also samples of the same LDHs were prepared and oxidized in potentiostatic conditions at the oxidation peak potential for 180 s.

2.2.2 XAS data collection and analysis. Two samples for the XAS measurements were prepared, namely, pristine and oxidized Ni/Fe LDHs. For these experiments the Ni/Fe LDH samples were electrosynthesized on ITO electrodes (Rs = 4–8 Ω cm−1, size 2.5 cm × 0.8 cm, thickness 1 mm), purchased from Delta Tech. Before the film deposition the electrodes were cleaned as follows; ITO-coated glasses were soaked in sequence in aqueous detergent solution, acetone and isopropyl alcohol for 15 min, under sonication, and then dried. A Bandelin Sonorex Super Sonicator (RK 510 H) was used for the cleaning of the ITO electrodes. The electrodeposition of the LDH was carried out performing two deposition steps of 30 seconds at the potential of −1.1 V vs. SCE. One sample was then oxidized in potentiostatic conditions, applying the anodic peak potential for 180 seconds.

XAS experiments were performed at ELETTRA Synchrotron Radiation Laboratory (Basovizza, Trieste), at the XAFS beam line 11.1,23 recording the data in fluorescence mode using a large area Si drift diode detector (KETEK). XAS spectra were recorded at the Ni and Fe K-edge (8333 eV and 7112 eV, respectively) using a Si(111) single crystal as monochromator. Extended X-ray Absorption Fine Structure (EXAFS) and X-ray Absorption Near Edge Structure (XANES) curves were recorded at room temperature.

X-ray absorption spectroscopy spectra were deglitched and calibrated using the Athena program.24 The pre-edge background was removed by subtraction of a linear function extrapolated from the pre-edge region, and the XANES spectra were normalized at the unity by extrapolation of the atomic background as it came out from the EXAFS analysis. The EXAFS analysis was performed by using the GNXAS package25 that takes into account Multiple Scattering (MS) theory. The method is based on the decomposition of the EXAFS signals into a sum of several contributions, that are the n-body terms. It allows the direct comparison of the raw experimental data with a model theoretical signal. The procedure avoids any filtering of the data and allows a statistical analysis of the results. The theoretical signal is calculated ab initio and contains the relevant two-body γ(2), the three-body γ(3) and the four body26 γ(4) MS terms. For the case of the Ni-edge the following n-body terms have been included in the fitting procedures: the two-atom contributions γ(2) Ni–O with degeneracy of six and the two-atom contributions γ(2) Ni–Ni with degeneracy of six. This also accounts for two Ni–Fe interactions at the same distance. This approximation holds due to the relative identical scattering power of both metals. For the case of the Fe K-edge the following n-body terms have been included in the fitting procedures: the two-atom contributions γ(2) Fe–O with degeneracy of six and the two-atom contributions γ(2) Fe–Ni with degeneracy of six. Data analysis was performed by minimizing a χ2-like residual function that compares the theoretical signal, αmod(E), to the experimental one, αexp(E). The phase shifts for the photoabsorber and backscattered atoms were calculated ab initio according to the muffin-tin approximation and allowing 10–15% overlap between the muffin-tin spheres. The Hedin–Lundqvist complex potential27 was used for the exchange–correlation potential of the excited state. The core hole lifetime28 was fixed to the tabulated value and included in the phase shift calculation. The experimental resolution used in the fitting analysis was about 2 eV, in agreement with the stated value for the beamline used.

3. Results and discussion

3.1 Characterizations of the LDH films

After the electrodeposition the LDH films were characterized by XRD, SEM coupled with EDS, TEM, and AFM analyses to confirm the layered structure of the materials, the molar ratio between the bivalent to trivalent cations and to investigate their morphology. Since the reproducibility of the electrochemical synthesis is quite good, we refer to what already published as to all these characterizations.20

3.2 Electrochemical characterization

Fig. 1a shows the cyclic voltammograms (CVs), normalized with respect to the peak current, recorded in 1 M KOH at the Pt electrodes coated with Ni/Al or Ni/Fe LDHs. The two samples display a quasi-reversible peak system related to the redox couple Ni(III)/Ni(II). The peaks current intensity and potential value depend on the trivalent metal, and in the presence of Fe, the Ni peak system as well as the solvent discharge is anticipated. Moreover, the reversibility of the Ni(III)/Ni(II) electrochemical system is much better, as evidenced by the higher charge exchanged during the cathodic scan.
image file: c6ra19192d-f1.tif
Fig. 1 (a) CV curves, normalized with respect to the peak current, recorded in 1 M KOH at Pt electrodes coated with Ni/Al and Ni/Fe LDHs. Scan rate: 0.1 V s−1. (b) Mass vs. time plots recorded during the electrosynthesis of Ni/Al and Ni/Fe LDHs on Pt, carried out at −0.90 V vs. SCE.

The mass of the LDHs deposited on Pt during the electrosynthesis was determined performing EQCM experiments. Fig. 1b displays the massograms recorded throughout the potential pulse for the Ni/Al and Ni/Fe based clays. In the case of Ni/Al LDH the mass grows quickly during the first 15 seconds of applied cathodic potential and then the mass continues to increase slowly. Ni/Fe LDH displays a different trend since, after a few seconds, the mass starts to grow quickly during the whole pulse, leading to a greater deposited amount of the clay (65 vs. 48 μg) in respect to the Ni/Al LDH.

The LDHs were further characterized at different scan rates both in 0.1 and 1 M KOH (Fig. 2). When the pH becomes more alkaline the Ni(III)/Ni(II) redox system moves to lower potential values and, at the same time, an increase of the peak currents is observed. This behavior is typical of Ni based LDHs coated electrodes since it was demonstrated12 that hydroxyls exhibit a higher tendency to enter the interlayer and a higher mobility once inside the interlayer, with respect to the other anions. For both the LDHs the ΔEp values of the Ni(III)/Ni(II) peaks system increase with the scan rate, which indicates that the redox process is controlled by the charge transfer kinetics. Furthermore, the anodic peak current is always higher in the presence of iron, in any condition. Based on the Laviron theory, the electron transfer coefficient (α) can be calculated according to:29

 
image file: c6ra19192d-t1.tif(3)
and results 0.5 for both materials. The electron transfer rate constant (ks) has been also determined. The calculated values are 0.22 and 0.25 s−1 for the Ni/Al and Ni/Fe LDHs, respectively, in 1 M KOH, and 0.18 and 0.20 s−1 in 0.1 M KOH.


image file: c6ra19192d-f2.tif
Fig. 2 CV curves recorded at different scan rates for a Ni/Al LDH ((a) and (b) in 0.1 and 1 M KOH, respectively) and Ni/Fe LDH ((c) and (d) in 0.1 M and 1 M KOH, respectively).

The slightly higher value of the ks relevant to the Fe-based LDH confirms that iron enhances the electroactivity of the couple Ni(III)/Ni(II) even if iron is not directly involved in the redox process as already observed in the literature.18,20

Ni active centres were calculated from the anodic peak charge considering the CVs recorded in 1 M KOH at slow scan rate (0.005 V s−1) on the basis of reaction (1) and are reported in Table 1, together with the total Ni centres determined from the data of the EQCM mass and the molecular weight considering the following formulae: [Ni0.71Al0.29(OH)2](NO3)0.29·0.60H2O and [Ni0.71Fe0.29(OH)2](NO3)0.29·0.80H2O.20 The percentage of the Ni electroactive sites is higher for the Ni/Fe LDH, as already evidenced by the higher anodic peak current in the characterization CV. The percentage of Ni active sites in Ni/Al LDH results 44% than that of Ni/Fe LDH.

Table 1 Calculated total and electroactive Ni sites for Ni/Al and Ni/Fe LDHs
LDH Ni sites on the electrode surface/mol Ni active sites/mol % electroactive Ni centres
Ni/Al 7.67 × 10⁻⁹ 1.73 × 10⁻⁹ 22.6
Ni/Fe 9.66 × 10⁻⁹ 3.09 × 10⁻⁹ 32.0


3.3 Electrocatalytic oxidation of methanol

In view of the application of the investigated LDHs in DMFCs, the CV curves in the presence of 2 M methanol were recorded and are shown in Fig. 3 where the oxidation currents were normalized to the geometric areas in order to directly compare the catalytic activity of the two LDHs. It is immediately evident the more efficient catalytic effect displayed by the Ni/Fe LDH since the current relevant to methanol oxidation is about twice as much the one recorded for the Ni/Al LDH at any potential value, and this result is perfectly in agreement with the percentage of Ni active centres present inside the two clays (Table 1). Another observation is the presence of hysteresis, i.e. the fact that in the backward scan the current crosses the trace of the forward scan, which is a typical feature of the electrocatalytic processes for which the rate of the chemical reaction between the redox mediator and the analyte (reaction (2)) is lower than that of reaction (1).12 From the CVs in Fig. 3 it is also evident the absence of the Ni(III) reduction peak for the Ni/Al LDH, whereas it is still present when the LDH contains Fe. This result confirms that not all the Ni(III) catalytic centres are consumed in the substrate oxidation, and, therefore, Ni/Fe LDH can promote the oxidation of more methanol, again confirming the better performance of the redox mediator when Fe is present.
image file: c6ra19192d-f3.tif
Fig. 3 CV curves recorded at Ni/Al (a) and Ni/Fe (b) LDHs coated electrodes in 1 M KOH in the absence and in the presence of 2 M methanol. Scan rate: 0.1 V s−1.

To evaluate the electrocatalytic activity and stability of Ni/Al and Ni/Fe LDHs under continuous operating conditions, long-term chronoamperometric tests at 5 mA cm−2 were carried out in a 1 M KOH + 2 M methanol solution for 8 hours (Fig. 4). It resulted that the required potential for the Ni/Fe LDH sample, at the same current density, is lower than the one necessary to the Ni/Al LDH, indicating again a significantly improved electrocatalytic activity. Both LDHs exhibited an excellent long-term durability for methanol electro-oxidation.


image file: c6ra19192d-f4.tif
Fig. 4 Chronopotentiometric measurements at 5 mA cm−2 for Ni/Al and Ni/Fe LDHs in 1 M KOH.

3.4 XPS characterization

The deconvoluted XPS spectrum of Ni 2p for Ni/Al LDH before induced electrochemical oxidation is reported in Fig. 5a. The typical binding energies (BE) corresponding to Ni2+ multiplet at around 855.5 and 873.2 eV, associated to Ni2p3/2 and Ni2p1/2, respectively, and the corresponding satellite components at 861.8 and 879.2 eV are observed. Based on the literature, this multiplet splitting is ascribed to charge transfer assignments of the main peaks and the broad satellite peaks (at higher binding energies) to the [c with combining low line]d9[L with combining low line] and the un-screened [c with combining low line]d8 final-state configurations, respectively (c is a core hole and L is a ligand hole).30 This assignment, which explains the double period main line of the Ni 2p spectrum for nickel oxide and other Ni compounds, was proposed and confirmed through quantum-mechanical calculations of clusters.31 The contributions at around 856.8 and 858 eV, taking into account the spectral parameters of Ni2p3/2 reported in ref. 30 can be both ascribed to Ni(II), although a partial contribution of Ni3+ species is not ruled out. Fig. 5b concerns the deconvoluted Ni 2p spectrum obtained after electrochemical oxidation in alkaline solution: no substantial differences in the binding energies are shown. However, the evaluation of the percentages of total area reveals changes in the relative abundance of the detected Ni species. Specifically, the signals attributed to Ni2p1/2 (873.2 eV and 879.2 eV) and the components at around 858 eV show lower percentage values, at variance with the percentage of the component at lower BE (∼855 eV), which appears significantly increased. Assuming that the percentage decrease observed for Ni2p1/2 of about 16% is the same for the Ni2p3/2 component, the increment upon electrochemical oxidation of the signal at lower BE should result from the appearance of a newly formed band at about 856 eV, ascribable to Ni3+ species.30
image file: c6ra19192d-f5.tif
Fig. 5 Deconvoluted Ni 2p XPS spectra of pristine (a) and oxidized (b) Ni/Al LDH, peaks position and relative percentage abundance.

Fig. 6 reports the XPS spectra of Al before (black curve) and after electrochemical oxidation (red curve): a shift towards higher binding energies of the two main components is observed. A possible explanation for this upshift can be related to the change in the oxidation state of a portion of Ni centres. Indeed, Ni species becoming partially 3+, attract more electron density from oxygen species with a consequent decrease of the O2− character into the LDH framework,32 and in turn a modification of BE features for Al species. Alternatively, the higher BE can be attributed to a change in the local chemical environment of Al species and specifically to an enrichment of OH species during oxidation, due to the exchange of interlayer NO3 with OH of the alkaline electrolyte.33 The easy and fast LDHs interlayer anion exchange has been also more recently reported in literature, investigating in situ changes in the structure of layered double hydroxides during electrochemical processes, due to the diffusion of OH species necessary for the charge balance.34


image file: c6ra19192d-f6.tif
Fig. 6 Al 2p XPS spectra of pristine Ni/Al LDH (black curve) and after electrochemical oxidation (red curve).

XPS characterization of Ni/Fe LDH before and after electrochemical oxidation was also performed with the aim to evidence changes in Ni species distribution in Fe-containing system. Fig. 7a shows the deconvoluted XPS spectrum of Ni 2p for pristine Ni/Fe LDH, the most relevant difference compared to the spectrum obtained for pristine Ni/Al LDH is the higher percentage of the component at about 856.1 eV, ascribed to Ni in oxidation state 3+. The presence of a significant amount of Ni3+ in the pristine Fe-based LDH confirms that the presence of iron promotes the Ni oxidation, even before the electrochemical experiment, confirming its role in enhancing the overall electroactivity of the couple Ni(III)/Ni(II). The spectrum registered for Ni/Fe LDH after oxidation is reported in Fig. 7b: a significant increment of the component attributed to Ni3+ (∼856) is found, clearly higher than the percentage increase obtained for Al-based LDH on an equal time of applied potential, in fair agreement with electrochemical results.


image file: c6ra19192d-f7.tif
Fig. 7 Deconvoluted Ni 2p XPS spectra of pristine (a) and oxidized (b) Ni/Fe LDH, peaks position and relative percentage abundance.

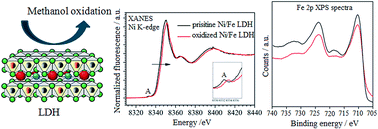
Fig. 8, related to Fe 2p XPS spectra of pristine Ni/Fe LDH (black curve) and after electrochemical oxidation (red curve), shows the main components at 710.3 and 723.6 eV, ascribed to Fe3+ species.35 At variance with that observed for Al, which showed changes in the chemical environment upon electrochemical oxidation, the Fe 2p XPS spectra of pristine Ni/Fe LDH (black curve) and after electrochemical oxidation (red curve) did not evidence any significant change.


image file: c6ra19192d-f8.tif
Fig. 8 Fe 2p XPS spectra of pristine Ni/Fe LDH (black curve) and after electrochemical oxidation (red curve).

3.5 XAS experiments

Due to the presence of two metals in the LDH modifier both Ni and Fe sites have been checked out by the XAS probe. Fig. 9a shows the comparison of the XANES spectra at Ni K-edge of pristine and oxidized Ni/Fe LDHs. The match of the two spectra well indicates that the local coordination geometry of the photoabsorber atom, Ni, remains unchanged during the oxidation. The only difference arises from the shift towards higher energy of the oxidized clay in respect to the pristine one. The curves shape is consistent to the one at the Ni K-edge of the parent Ni/Al LDH.36 This suggests that Ni is octahedrically coordinated by 6 oxygen atoms, two in the apical position and four in the equatorial plane, in the just synthesized Ni/Fe LDH. A close inspection of the edge and of the pre-edge position (see the inset of Fig. 9a) reveals that the extent of the energy shift of the XANES curve relative to the oxidized thin film is ∼1.5 eV (edge) and ∼1 eV (pre-edge), both values are consistent with the oxidation to Ni(III).37 This experimental evidence corroborates the general eqn (1).
image file: c6ra19192d-f9.tif
Fig. 9 (a) Comparison of the XANES spectra of both the pristine and the oxidized Ni/Fe LDHs at the Ni K-edge (8333 eV). Pre-edge peak A is due to a 1s–3d electronic transition and a magnification is displayed in the inset. (b) XANES spectra at the Fe K-edge of the pristine and oxidized LDHs, including a magnification of the pre-edge peak.

Fig. 9b displays the XANES curves recorded at the Fe K-edge for both electrodeposits. The traces are characterized by a typical pre-edge peak at about 7114 eV which is related to the 1s–3d electronic transition and can be used as a fingerprint for the local charge around Fe. The position and the intensity of such a peak indicate mainly the occurrence of the Fe(III) oxidation state in an octahedral environment, for both samples. Only a small difference is observed in the energy position of the overall XANES trace, consistent with a possible Fe(III) oxidation.

In addition there is a difference in the feature (shoulder) visible in the rising part of the edge, at about 7120–7121 eV. This shoulder (indicated by an arrow) is associated with the transitions to empty bound states38 that deal with the local coordination geometry of the photo-absorber. Such a feature in the edge zone could be due to a different long range order of Fe, possibly ascribable to structural defects.

A difference is also visible in the white line intensity at about 7130 eV where a transition to empty bound states occurs. Thus, the analysis at the Fe K-edge indicates an invariance of the charge associated with Fe between the two samples (in agreement with the XPS results) but small changes at the Fe local site can be postulated in light of the evidences provided by the rising part of the XANES spectrum.

To gain complementary information of the local structure and charge of the pristine Ni/Fe LDH, an EXAFS analysis has been performed at both Ni and Fe K-edge. Due to the molar concentration ratio of the two metals in the electrodeposits (Ni[thin space (1/6-em)]:[thin space (1/6-em)]Fe, 3[thin space (1/6-em)]:[thin space (1/6-em)]1) the EXAFS spectra at the Ni site are characterized by a better S/N ratio, and will be analyzed firstly. Fig. 10a compares the Fourier Transform (FT) signals of the corresponding EXAFS spectra at the Ni K-edge of the native and oxidized materials. As this plot can be intended to display the radial distribution of the atoms surrounding the central one, the Ni, modifications can be observed for both peaks which are due, most likely, to a decrease of the intensities. As indicated in the figure the first peak is related to the first atomic shell surrounding the Ni and the second peak, at about 2.6 Å, is associated to the second coordination shell, which is formed by 6 metal atoms (which are 4 Ni atoms plus 2 Fe atoms based on the relative stoichiometry). The differences in intensity of both shells are probably ascribable to an increase of the structural disorder. To confirm this hypothesis and to gain a more quantitative understanding of the metals behavior a successive fitting analysis has been performed.


image file: c6ra19192d-f10.tif
Fig. 10 (a) Experimental Fourier Transforms (FTs) relative to the EXAFS spectra of both the pristine and the oxidized Ni/Fe LDHs at the Ni K-edge. (b) Comparison of the experimental (-▲-) vs. theoretical (●) k-extracted EXAFS for the pristine and oxidized LDHs, at both Ni and Fe K-edges.

A best fit procedure was conducted at both metal edges of the two materials considering the experimental evidence provided by the FT of Fig. 10a, i.e., only the first two shells around the metal site contribute mostly to the experimental photo-absorption process and, therefore, the first and second two body distributions have been included in the fitting procedure. Details are specified in the Experimental section. Fig. 10b displays the comparison of the theoretical and experimental k-extracted EXAFS signals for the two LDHs, at both K-edges. All theoretical signals of Fig. 10b match well the experimental ones, demonstrating the reliability of the data analysis.

Fig. 11 reports the details of the EXAFS analysis, showing the various theoretical contributions to the total signal, for both Ni and Fe K-edge in panels (a) and (b), respectively. Even though the metal–oxygen first shell largely contributes to the total signal in both edges, the metal–metal signal in the second shell is rather important for the interpretation of the total experimental one. It is also interesting to notice that the two-body Fe–Ni (Fe) signal has a smaller intensity when compared to that relative to the Ni–Ni(Fe) one.


image file: c6ra19192d-f11.tif
Fig. 11 Best fit of pristine LDH at both Ni and Fe K-edge. Panels (a) and (b) show the details of the EXAFS analysis for the Ni and Fe edge, respectively, in terms of individual EXAFS contributions to the total theoretical signal. The comparison of the total theoretical signal (●) with the experimental one (-▲-) is also shown. The residual signal is reported at the bottom. Panels (c) and (d) display the contour plot for the error determination of the Ni–O and Fe–O first shell distances.

Table 2 reports the inter-atomic distances and the corresponding EXAFS Debye–Waller factors (σ2, best-fit) of the investigated clays. The statistical errors associated with the parameters are indicated in parenthesis. They were determined by correlation maps (contour plots) for each pair of parameters, and two examples for the highly correlated Ni–O and Fe–O are displayed in Fig. 11, panels (c) and (d) for the pristine LDH. These plots were selected among the parameters having a strong correlation to reflect the highest error. The inner elliptical contour corresponds to the 95% confidence level. It is important to emphasize that this evaluation provides only statistical errors on EXAFS refined parameters and it does not account for systematic errors in the theory or those peculiar to the experimental technique. The Ni–O interaction shortens from 2.051 to 2.038 Å in the oxidized LDH, while the Ni–Ni(Fe) interaction holds at a value of 3.11 Å. Unlikely, the Fe site is seen to be the same in the two materials: the Fe–O first shell is at about 1.99 Å. The second coordination shell of Fe is consistent to the one seen for the Ni site. The Ni–O EXAFS bond variance becomes higher for the oxidized LDH and, hence, the presence of a more structural disorder can be postulated in this case. In addition, a significant decrease of this parameter relevant to the second shell of Fe has been observed in the oxidized material. This fact should be evaluated together with the value found at the Ni site. Overall the EXAFS Debye Waller Factors at the Ni site are lower than those concerning the Fe site. This can be ascribable to a more regular Ni–O–Ni triplet with respect to the “defective” Ni–O–Fe, as testified by the relative first shell distribution and by the EXAFS Debye Waller Factor. During oxidation the decrease of the structural disorder relative to the Fe–O–Ni triplet may favor a particular structural arrangement for the Ni reactive sites.

Table 2 EXAFS analysis. Atomic first and second shell distances and corresponding EXAFS Debye–Waller factors of the pristine and oxidized LDHs. Errors in parenthesis have been determined by Contour plots (see Fig. 11c and d)
Parameters Ni K-edge Fe K-edge
Pristine Oxidized Pristine Oxidized
Ni–O/Å 2.051(7) 2.038(8)    
σNi–O22 0.0065(15) 0.0072(15)    
CNNi–O 6 6    
Ni–Ni(Fe)/Å 3.11(1) 3.11(1)    
σNi–Ni(Fe)22 0.0090(15) 0.0011(2)    
CNNi–Ni(Fe) 6 6    
Fe–O/Å     1.99(1) 1.984(8)
σFe–O22     0.012(2) 0.011(1)
CNFe–O     6 6
Fe–Ni(Fe)/Å     3.10(2) 3.10(2)
σFe–Ni(Fe)22     0.025(6) 0.017(3)
CNFe–Ni(Fe)     6 6
E0/eV 8327.0(5) 8328.0(5) 7126.0(5) 7125.0(5)
S02 0.81(4) 0.91(5) 0.70(5) 0.70(5)


Overall, the experimental evidences here reported for XANES and EXAFS suggest that Ni sites act as the electro-active species during the film oxidation but differences in the local site are expected for both Ni and Fe. The NiO6 octahedron shrinks slightly in oxidized electroactive films with a concomitant presence of a structural disorder. In addition, the structural analysis at the Fe site points out that Fe has a major role in promoting Ni reaction, as suggested by the recent work by Friebel et al.39 Its local site displays more structurally disorder than that of Ni and thus can host structural rearrangements during oxidation phenomena, from which, in turn Ni may benefit. For instance, this can lead to a decrease of the resistance in the electronic transport, and activate the activity of Ni centres for oxygen evolution reaction, as reported by the literature.18,40

4. Conclusions

Ni/Al and Ni/Fe LDHs have been electrosynthesized on Pt electrodes and investigated as catalysts for methanol fuel cells. The required potential for methanol oxidation is lower for Ni/Fe LDH, so suggesting a key role played by Fe in the electrocatalysis supported by the LDH. To further investigate the material, electrochemical and X-ray spectroscopic investigations have been conducted on the electrodeposited materials. The electrochemical characterization indicates that Fe enhances the electroactivity of the couple Ni(III)/Ni(II), even if it is not directly involved in the redox process, and that the percentage of Ni active sites in Fe containing material results ∼50% more than the one typical of the Ni/Al LDH. XPS and XAS experiments have been carried out to better characterize the electronic and structural effects due to Fe presence. To this aim the materials have been investigated both immediately after the electrosynthesis (pristine) and after potentiostatic oxidation.

X-ray photoelectron spectroscopy on both Ni/Fe and Ni/Al LDHs reveals a higher percentage of the Ni3+ component in the case of Fe-based LDHs (pristine and oxidized), confirming that the presence of iron enhances the electroactivity of the Ni(III)/Ni(II) couple. The X-ray absorption spectroscopic study at both Ni and Fe K-edge reveals both structural and electronic differences among the pristine and oxidized materials. Both X-ray techniques confirm the presence of Ni3+ centres in the oxidized samples whereas the charge associated to Fe does not show a significant variation. The local atomic environment of Ni has been checked out by EXAFS, revealing a NiO6 octahedron shrinking in oxidized electroactive films with a concomitant enhancement of the structural disorder. The Ni–O–Fe triplet is found to be asymmetric even in the pristine LDH, with Ni–O and Fe–O distances being 2.05 and 1.99 Å, respectively. An interesting ordered evolution is found in the second shell of Fe, a shell which corresponds to Ni, suggesting that Fe can host structural rearrangements phenomena during oxidation.

Acknowledgements

The Authors are grateful to the University of Bologna, Italy, for providing financial support. XAS experiments at ELETTRA Sincrotrone Trieste were partially supported by the proposal # 20135290.

Notes and references

  1. T. Iwasita, Electrochim. Acta, 2002, 47, 3663–3674 CrossRef CAS.
  2. E. Antolini and E. R. Gonzalez, J. Power Sources, 2010, 195, 3431–3450 CrossRef CAS.
  3. I. G. Casella, T. R. I. Cataldi, A. M. Salvi and E. Desimoni, Anal. Chem., 1993, 65, 3143–3150 CrossRef CAS.
  4. C. Xu, Y. Hu, J. Rong, S. P. Jiang and Y. Liu, Electrochem. Commun., 2007, 9, 2009–2012 CrossRef CAS.
  5. Y. Zhao, Y. E. L. Fan, Y. Qiu and S. Yang, Electrochim. Acta, 2007, 52, 5873–5878 CrossRef CAS.
  6. I. Danaee, M. Jafarian, F. Forouzandeh, F. Gobal and M. G. Mahjani, Int. J. Hydrogen Energy, 2008, 33, 4367–4376 CrossRef CAS.
  7. A. A. El-Shafei, J. Electroanal. Chem., 1999, 471, 89–204 CrossRef CAS.
  8. A. N. Golikand, S. Shahrokhian, M. Asgari, M. G. Maragheh, L. Irannejad and A. Khanchi, J. Power Sources, 2005, 144, 21–27 CrossRef CAS.
  9. M. A. Abdel Rahim, B. Hanaa, R. M. Hassan and A. Hamid, J. Power Sources, 2006, 154, 59–65 CrossRef CAS.
  10. S. M. Golabi and A. Nozad, Electroanalysis, 2004, 16, 199–209 CrossRef CAS.
  11. U. Costantino, F. Leroux, M. Nocchetti and C. Mousty, Developments in Clay Science 5, in Handbook of Clay Science Second Edition Part B Techniques and applications, ed. B. Faïza and L. Gerhard, Elsevier, 2013, pp. 765–791 Search PubMed.
  12. B. Ballarin, R. Seeber, D. Tonelli and A. Vaccari, J. Electroanal. Chem., 1999, 463, 123–127 CrossRef CAS.
  13. D. Tonelli, E. Scavetta and M. Giorgetti, Anal. Bioanal. Chem., 2013, 405, 603–614 CrossRef CAS PubMed.
  14. E. Scavetta, M. Berrettoni, M. Giorgetti and D. Tonelli, Electrochim. Acta, 2002, 47, 2451–2461 CrossRef CAS.
  15. Y. Wang, D. Zhang, W. Peng, L. Liu and M. Li, Electrochim. Acta, 2011, 56, 5754–5758 CrossRef CAS.
  16. M. Fleischmann, K. Korinek and D. Pletcher, J. Electroanal. Chem., 1971, 31, 39–49 CrossRef CAS.
  17. Z. Li, M. Shao, H. An, Z. Wang, S. Xu, M. Wei, D. G. Evans and X. Duan, Chem. Sci., 2015, 6, 6624–6631 RSC.
  18. L. Trotochaud, S. L. Young, J. K. Ranney and S. W. Boettcher, J. Am. Chem. Soc., 2014, 136, 6744–6753 CrossRef CAS PubMed.
  19. X. Long Guo, X. Ying Liu, X. Dong Hao, S. Jin Zhu, F. Dong, Z. Quan Wen and Y. Xin Zhang, Electrochim. Acta, 2016, 194, 179–186 CrossRef.
  20. E. Scavetta, Y. Vlamidis, T. Posati, M. Nocchetti and D. Tonelli, ChemElectroChem, 2016, 3, 1320–1328 CrossRef CAS.
  21. E. Scavetta, A. Mignani, D. Prandstraller and D. Tonelli, Chem. Mater., 2007, 19, 4523–4529 CrossRef CAS.
  22. M. Giorgetti, ISRN Mater. Sci., 2013, 2013, 938625 Search PubMed.
  23. A. Di Cicco, G. Aquilanti, M. Minicucci, E. Principi, N. Novello, A. Cognigni and L. Olivi, J. Phys.: Conf. Ser., 2009, 190, 012043 CrossRef.
  24. B. Ravel and M. Newville, J. Synchrotron Radiat., 2005, 12, 537–541 CrossRef CAS PubMed.
  25. A. Filipponi and A. Di Cicco, Phys. Rev. B: Condens. Matter Mater. Phys., 1995, 52, 15135–15149 CrossRef CAS.
  26. M. Giorgetti, M. Berrettoni, A. Filipponi, P. J. Kulesza and R. Marassi, Chem. Phys. Lett., 1997, 275, 108–112 CrossRef CAS.
  27. L. Hedin and B. I. Lundqvist, J. Phys. C: Solid State Phys., 1971, 4, 2064–2083 CrossRef.
  28. M. O. Krause and J. H. Oliver, J. Phys. Chem. Ref. Data, 1979, 8, 329–338 CrossRef CAS.
  29. Q. L. Sheng, H. Yu and J. B. Zheng, Electrochim. Acta, 2007, 52, 4506–4512 CrossRef CAS.
  30. A. P. Grosvenor, M. C. Biesinger, R. St. C. Smart and N. S. McIntyre, Surf. Sci., 2006, 600, 1771–1779 CrossRef CAS.
  31. M. A. van Veenendaal and G. A. Sawatsky, Phys. Rev. Lett., 1993, 70, 2459–2462 CrossRef CAS PubMed.
  32. D. G. Cantrell, L. J. Gillie, A. F. Lee and K. Wilson, Appl. Catal., A, 2005, 287, 183–190 CrossRef CAS.
  33. R. Roto, L. Yu and G. Villemure, J. Electroanal. Chem., 2006, 587, 263–268 CrossRef CAS.
  34. C. Taviot-Guého, P. Vialat, F. Leroux, F. Razzaghi, H. Perrot, O. Sel, N. D. Jensen, U. G. Nielsen, S. Peulon, E. Elkaim and C. Mousty, Chem. Mater., 2016, 28, 7793–7806 CrossRef.
  35. M. C. Biesinger, B. P. Payne, A. P. Grosvenor, L. W. M. Lau, A. R. Gerson and R. St. C. Smart, Appl. Surf. Sci., 2011, 257, 2717–2730 CrossRef CAS.
  36. I. Carpani, M. Berrettoni, M. Giorgetti and D. Tonelli, J. Phys. Chem. B, 2006, 110, 7265–7269 CrossRef CAS PubMed.
  37. D. Buchholz, J. Li, S. Passerini, G. Aquilanti, D. Wang and M. Giorgetti, ChemElectroChem, 2015, 2, 85–97 CrossRef CAS.
  38. M. Giorgetti, L. Guadagnini, D. Tonelli, M. Minicucci and G. Aquilanti, Phys. Chem. Chem. Phys., 2012, 14, 5527–5537 RSC.
  39. D. Friebel, M. W. Louie, M. Bajdich, K. E. Sanwald, Y. Cai, A. M. Wise, M. Cheng, D. Sokaras, T. Weng, R. Alonso Mori, R. C. Davis, J. R. Bargar, J. K. Norskov, A. Nilsson and A. T. Bell, J. Am. Chem. Soc., 2015, 137, 1305–1313 CrossRef CAS PubMed.
  40. Y. Vlamidis, E. Scavetta, M. Gazzano and D. Tonelli, Electrochim. Acta, 2016, 188, 653–660 CrossRef CAS.

This journal is © The Royal Society of Chemistry 2016