Synthesis, structure, and calf-thymus DNA binding of ternary fleroxacin–Cu(II) complexes†
Ying Xiao,
Kailin Xu,
Qing Wang,
Xinnuo Xiong,
Yanmei Huang and
Hui Li*
College of Chemical Engineering, Sichuan University, Chengdu, Sichuan, China. E-mail: lihuilab@sina.com; Fax: +86 28 85401207; Tel: +86 28 85405149
First published on 19th August 2016
Abstract
Two mononuclear copper(II) (Cu(II)) complexes containing quinolone drug fleroxacin (flrx) were synthesized in the presence of 1,10-phenanthrolin (phen) and 2,2′-bipyridine (bipy). To fully characterize these two complexes, single-crystal X-ray diffraction study and other characterizations were employed. X-ray crystallography results showed that the deprotonated flrx coordinated with the central Cu(II) via one pyridone oxygen and one carboxylate oxygen. Intermolecular interactions including hydrogen bonding and π–π stacking stabilized these complexes. Moreover, interactions of [Cu(flrx)(bipy)Cl]·4H2O and [Cu(flrx)(phen)·H2O]·9.8H2O complexes with calf-thymus DNA (CT DNA) were investigated. Fluorescence measurements and fluorescence lifetime investigations indicated that CT DNA could effectively quench the fluorescence of the complexes and the interaction modes were static quenching. Isothermal titration calorimetry showed that the two complexes exhibited a similar moderate binding affinity to CT DNA, and their binding constants were basically consistent with the results of the fluorescence measurements. Thermodynamic parameters revealed that the bindings were driven by considerable enhancements in beneficial entropy and unfavorable increases in enthalpy, and the negative Gibbs energy values indicated that the interactions were spontaneous. Circular dichroism, interaction with denatured CT DNA, and iodide quenching studies suggested that the possible interaction modes between CT DNA and these two complexes are both in the intercalation mode.
Introduction
Quinolones are a large class of synthetic antibacterial drugs with a 4-oxo-1,4-dihydroquinoline skeleton. These types of agents target topoisomerases II and IV, which influence DNA replication and transcription.1,2 Quinolones are not only widely used to treat various infections, but also effective for many cancers, such as human breast cancer and prostate cancer.3–5Coordination between metal ions and adjacent carbonyl and carboxyl groups of quinolones has attracted considerable attention in the past because some of these modified quinolone derivatives exhibit favorable biological properties and improved resistance properties.6,7 Diverse metal–quinolone complexes have been proven to exhibit antibacterial activity,8 anticancer activity,9 and binding affinity to biomacromolecules.10 Among all these complexes, the mixed ligand complexes of quinolones stood out from the numerous quinolone complexes because of their noteworthy biological activities.11 A considerable number of ternary complexes exhibit surprising biological performances in the presence of a nitrogendonor heterocycle.12,13 Researches on the interaction between quinolone ternary complexes and DNA have shown that the complexes exhibit enhanced binding affinity.14,15 Besides, given that copper(II) (Cu(II)) plays an important role on numerous biological functions and influences gene expression in mammalian cells, its complexes attracted significant attention compared with other conventional metal–drug complexes.16,17
Fleroxacin (flrx) is a third-generation quinolone drug that efficiently inhibits Gram-positive and Gram-negative bacteria.18 Although the coordination of some quinolones with metals has been extensively investigated, only a few studies have focused on flrx complexes. In addition, the reported flrx complexes were simply characterized without obtaining their crystal structures.19,20
DNA is an important macromolecule that carries hereditary information, controls cellular structure and function, and plays an essential role in cellular progression, such as DNA transcription, translation, and replication.21 Cellular DNA is the target of various drugs, including antibacterial and anticancer drugs.22,23 Given that quinolone itself is an antibacterial drug and its complexes show antibacterial activities and certain anticancer effects, binding between quinolone complexes and DNA has been widely investigated.24,25
In our previous work, a mononuclear Cu(II) complex, [Cu(flrx)(phen)·H2O]·9.8H2O, was synthesized and fully characterized.26 The ability of this complex to cleave DNA and to interact with human serum albumin was investigated. As a continuation of our previous work, the present study investigated the coordination of flrx with Cu(II) in the presence of 2,2′-bipyridine (bipy). The obtained crystal was characterized by X-ray crystallography. Further characterizations were applied to confirm the structure of the crystal. Considering the advanced anticancer and antibacterial abilities of the ternary complexes of quinolones,12,27 we presented the DNA binding properties of flrx complexes in this article. The interactions of [Cu(flrx) (bipy)Cl]·4H2O (complex 1) and [Cu(flrx)(phen)·H2O]·9.8H2O (complex 2) with calf-thymus DNA (CT DNA) were investigated. Fluorescence studies were conducted to determine the effects of CT DNA on the intrinsic fluorescence of these two complexes. Time-resolved fluorescence lifetime determination was conducted to confirm the quenching type. Isothermal titration calorimetry (ITC) measurements were performed to probe the binding affinities and thermodynamic variables. Further analyses, covering circular dichroism (CD), interaction with single-stranded CT DNA (ss-CT DNA), and iodide quenching studies, were employed to assess the binding modes.
Experimental
Materials
Flrx and bipy, which were used to synthesize complex 1, were procured from J&K Scientific Ltd. (Beijing, China). CT DNA was purchased from Sigma Chemical Co. (St. Louis, MO, USA). The absorbance ratio of CT DNA at 260/280 nm was 1.8 to 1.9, indicating that CT DNA was sufficiently free of protein contamination.28 DNA stock solution was prepared with phosphate buffer solution (PBS, pH 7.40) and stored at 0 °C for no more than one week. Other analytical grade reagents and chemicals were obtained from Chengdu Kelong Chemical Co., Ltd. (China, Chengdu).Synthesis and characterization
![[double bond, length as m-dash]](https://www.rsc.org/images/entities/char_e001.gif) O)pyridine, 1633; νasym (CO2), 1589; νsym (CO2), 1369; Δ = ν(CO2)asym − ν(CO2)sym: 220 cm−1 (KBr disk). The obtained complex is soluble in water, methanol, and ethanol. Complex 2 had been prepared via the same process, except that bipy (78.09 mg, 0.5 mmol) was replaced by 1,10-phenanthrolin (phen; 99.11 mg, 0.5 mmol).26
O)pyridine, 1633; νasym (CO2), 1589; νsym (CO2), 1369; Δ = ν(CO2)asym − ν(CO2)sym: 220 cm−1 (KBr disk). The obtained complex is soluble in water, methanol, and ethanol. Complex 2 had been prepared via the same process, except that bipy (78.09 mg, 0.5 mmol) was replaced by 1,10-phenanthrolin (phen; 99.11 mg, 0.5 mmol).26It's necessary to produce stability investigation on the complexes in the PBS buffer (pH 7.40), which was employed for the next biological studies. The Cary Eclipse fluorescence spectrophotometer (Varian, USA) was used to monitor whether changes have occurred.
Interaction with CT DNA
Inner filter effect was considered and corrected in this study. All fluorescence intensities were corrected for the absorption of excited light and the re-absorption of emitted light by applying the following equation:31
 | (1) |
Results and discussion
Crystal structure of complex 1
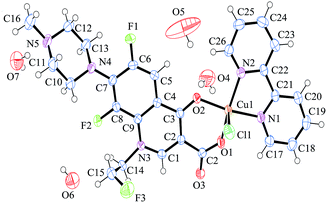
The crystallographic data of complex 1 are summarized in Table 1, which shows that the synthesized coordination compound behaves as P![[1 with combining macron]](https://www.rsc.org/images/entities/char_0031_0304.gif) space group in triclinic form. The crystal structure of the mononuclear complex 1 is shown in Fig. 1. Selected bond distances and angles of complex 1 are depicted in Table 2. For complex 1, the central Cu(II) is chelated to one pyridone oxygen atom and one carboxylate oxygen atom of the deprotonated flrx and to two nitrogen atoms from the pyridine rings of the bipy molecule, which is similar to the structure of complex 2. According to the angles of Cu(II) and the chlorine and oxygen atoms [O(1)–Cu(1)–Cl(1) = 97.66 (6)°, O(2)–Cu(1)–Cl(1) = 94.67(5)°], the chlorine atom from metal salt occupies the axial position. Moreover, four lattice water molecules providing hydrogen bond interactions to strengthen crystalline stability are included. As an index of the degree of trigonality to the five-coordinate structures, trigonality index t (t = (Φ1 − Φ2)/60, where Φ1 and Φ2 represent the two largest angles in the coordination sphere, respectively) was applied. t = 0 denotes a perfect square pyramid, while t = 1 indicates a perfect trigonal bipyramid.33 The calculated t = (168.43–158.50)/60 = 0.165 reveals that complex 1 behaved with distortion from the regular square-based pyramidal geometry, which is also observed in other similar Cu–quinolones complexes.34,35
space group in triclinic form. The crystal structure of the mononuclear complex 1 is shown in Fig. 1. Selected bond distances and angles of complex 1 are depicted in Table 2. For complex 1, the central Cu(II) is chelated to one pyridone oxygen atom and one carboxylate oxygen atom of the deprotonated flrx and to two nitrogen atoms from the pyridine rings of the bipy molecule, which is similar to the structure of complex 2. According to the angles of Cu(II) and the chlorine and oxygen atoms [O(1)–Cu(1)–Cl(1) = 97.66 (6)°, O(2)–Cu(1)–Cl(1) = 94.67(5)°], the chlorine atom from metal salt occupies the axial position. Moreover, four lattice water molecules providing hydrogen bond interactions to strengthen crystalline stability are included. As an index of the degree of trigonality to the five-coordinate structures, trigonality index t (t = (Φ1 − Φ2)/60, where Φ1 and Φ2 represent the two largest angles in the coordination sphere, respectively) was applied. t = 0 denotes a perfect square pyramid, while t = 1 indicates a perfect trigonal bipyramid.33 The calculated t = (168.43–158.50)/60 = 0.165 reveals that complex 1 behaved with distortion from the regular square-based pyramidal geometry, which is also observed in other similar Cu–quinolones complexes.34,35
| Empirical formula | Complex 1 |
| Formula weight | 695.57 |
| Temperature/K | 293.15 K |
| Crystal system | Triclinic |
| Space group | P![[1 with combining macron]](https://www.rsc.org/images/entities/char_0031_0304.gif) |
| a/Å | 9.4109(7) |
| b/Å | 11.7658(8) |
| c/Å | 15.5101(7) |
| α/° | 77.188(5) |
| β/° | 80.638(5) |
| γ/° | 67.200(7) |
| Volume/Å3 | 1538.13(17) |
| Z | 2 |
| ρcalc/g cm−3 | 1.502 |
| μ/mm−1 | 0.867 |
| F(000) | 718.0 |
| Crystal size/mm3 | 0.4 × 0.4 × 0.3 |
| Radiation | MoKα (λ = 0.71073) |
| 2θ range for data collection/° | 6.04 to 52.74 |
| Index ranges | −10 ≤ h ≤ 11, −14 ≤ k ≤ 14, −19 ≤ l ≤ 19 |
| Reflections collected | 12![[thin space (1/6-em)]](https://www.rsc.org/images/entities/char_2009.gif) 635 635 |
| Independent reflections | 6276 [Rint = 0.0229, Rsigma = 0.0408] |
| Data/restraints/parameters | 6276/0/420 |
| Goodness-of-fit on F2 | 1.041 |
| Final R indexes [I ≥ 2σ(I)] | R1 = 0.0377, wR2 = 0.0887 |
| Final R indexes [all data] | R1 = 0.0503, wR2 = 0.0973 |
| Largest diff. peak/hole/e Å−3 | 0.31/−0.38 |
| Bond distance (Å) | |||
| Cu(1)–O(1) | 1.908(15) | Cu(1)–N(2) | 2.012(18) |
| Cu(1)–O(2) | 1.949(15) | O(1)–C(27) | 1.273(3) |
| Cu(1)–Cl(1) | 2.572(8) | O(2)–C(3) | 1.269(2) |
| Cu(1)–N(1) | 1.999(19) | O(3)–C(27) | 1.228(2) |
![[thin space (1/6-em)]](https://www.rsc.org/images/entities/char_2009.gif) |
|||
| Bond angle (°) | |||
| O(1)–Cu(1)–O(2) | 93.88(6) | O(2)–Cu(1)–N(1) | 168.43(8) |
| O(1)–Cu(1)–Cl(1) | 97.77(6) | O(2)–Cu(1)–N(2) | 93.18(7) |
| O(1)–Cu(1)–N(1) | 88.58(7) | N(1)–Cu(1)–Cl(1) | 96.19(6) |
| O(1)–Cu(1)–N(2) | 158.50(8) | N(1)–Cu(1)–N(2) | 80.71(7) |
| O(2)–Cu(1)–Cl(1) | 94.67(5) | N(2)–Cu(1)–Cl(1) | 101.85(6) |
In terms of the distances between central atom and coordinated atoms, the distances between the two oxygen atoms and central copper [Cu(1)–O(1) = 1.908 (15) Å, Cu(1)–O(2) = 1.949 (15) Å] are slightly shorter than those between nitrogen atoms and copper ion [Cu(1)–N(1) = 1.999 (19) Å, Cu(1)–N(2) = 2.012 (18) Å]. The largest distance is observed between copper and chlorine atoms [Cu(1)–Cl(1) = 2.572 (8) Å]. The whole structural feature was observed and described in previously reported similar quinolone complexes.36,37
Intermolecular hydrogen bonds are shown in Fig. S1,† and detailed information on hydrogen bonds are presented in Table S1.† The common types of existing hydrogen bonds include O–H⋯O, O–H⋯N, O–H⋯F, and O–H⋯Cl. The participating oxygen atoms all come from lattice water molecules, whereas the nitrogen and fluorine atoms come from the ligand flrx, and the chlorine atom comes from the Cu(II) salt. The crystal structure is stabilized by the hydrogen bonds to some degree. Fig. S2† shows the stacking interaction. The entire structure exhibits unique layers with an antiparallel arrangement. The distance between the adjacent flrx and bipy molecules is approximately 3.4 Å, which is often attributed to the possible existence of π–π stacking.38,39 Detailed structural information on complex 2 was provided in our previous work.26
Crystallographic data of complex 1 and 2 were submitted to the Cambridge Crystallographic Data Centre (CCDC), and these complexes were given the publication numbers CCDC-1494707 and 1457402,26 respectively.
Characterization
As for complex 1, FTIR was employed to obtain information on the coordination of ligands with metal. The presence of numerous functional groups in the molecules results in complicated spectra; thus, only the most typical vibrations are selected for interpretation.The FTIR spectra (Fig. S3†) shows that the band at 1625 cm−1, which is attributed to pyridone stretching ν(C![[double bond, length as m-dash]](https://www.rsc.org/images/entities/char_e001.gif) O)p of flrx, slightly shifts to 1633 cm−1, revealing that flrx coordinates with Cu(II) via pyridone oxygen. The strong bands at 1720 and 1286 cm−1 assigned to ν(C
O)p of flrx, slightly shifts to 1633 cm−1, revealing that flrx coordinates with Cu(II) via pyridone oxygen. The strong bands at 1720 and 1286 cm−1 assigned to ν(C![[double bond, length as m-dash]](https://www.rsc.org/images/entities/char_e001.gif) O)carboxyl and ν(C–O)carboxyl stretching vibrations of the carboxyl group (–COOH) of free flrx shift to 1589 and 1369 cm−1, respectively. These two new bands could be correspondingly ascribed to antisymmetric [νasym (CO2)] and symmetric [νsym (CO2)] stretching vibrations of the carboxylate group. Δ [=ν(CO2)asym − ν(CO2)sym] is a parameter used to determine the coordination mode of the carboxylate ligand, which is 220 cm−1 for complex 1, indicating that the carboxylate group coordinated in a monodentate mode.40 The FTIR results reveal that the deprotonated flrx ligand chelates to Cu(II) in a bidentate mode via pyridone oxygen and one carboxylate oxygen atom. The binding mode is similar to that in homogeneous complexes.10,41
O)carboxyl and ν(C–O)carboxyl stretching vibrations of the carboxyl group (–COOH) of free flrx shift to 1589 and 1369 cm−1, respectively. These two new bands could be correspondingly ascribed to antisymmetric [νasym (CO2)] and symmetric [νsym (CO2)] stretching vibrations of the carboxylate group. Δ [=ν(CO2)asym − ν(CO2)sym] is a parameter used to determine the coordination mode of the carboxylate ligand, which is 220 cm−1 for complex 1, indicating that the carboxylate group coordinated in a monodentate mode.40 The FTIR results reveal that the deprotonated flrx ligand chelates to Cu(II) in a bidentate mode via pyridone oxygen and one carboxylate oxygen atom. The binding mode is similar to that in homogeneous complexes.10,41
Fig. S4† shows the TG result. The TG curve shows four weight loss stages. From 80 °C to 130 °C, a weight loss of 2.97% is observed, corresponding to the release of one crystal water molecule (calcd = 2.59%). The subsequent weight loss stages overlapped, causing difficulty in ascription. Taken as a whole, the subsequent weight loss of 50.13% at 130 °C to 450 °C could be generally ascribed to the loss of the three remaining crystal water molecules, the bipy, part of the piperazine ring of flrx, deprotonated carboxylgroup, and CH2CH2F (calcd = 50.38%). The final part of weight loss (7.01%) corresponds to the release of the remaining piperazine ring of flrx (calcd = 6.34%).
DSC measurement was employed to obtain information on melting point. As shown in Fig. S5,† the first endothermic peak between 120.70 °C and 160.14 °C is attributed to the release of lattice water molecules. A sharp endothermic peak appeared at 202.88 °C, corresponding to the melting point of the compound. The final exothermic peak can be attributed to the degradation of the complex. Related characterization of complex 2 was reported in our previous article.26
Given that subsequent biological studies will be performed in PBS (pH 7.40), investigating the stability of the complex in this buffer solution is necessary. Fluorescence was used to monitor whether changes have occurred. No evident change was observed (figure not shown) after monitoring for more than two days. The results revealed that the complex remained stable in PBS (pH 7.40) for a long period of time.
Interaction with CT DNA
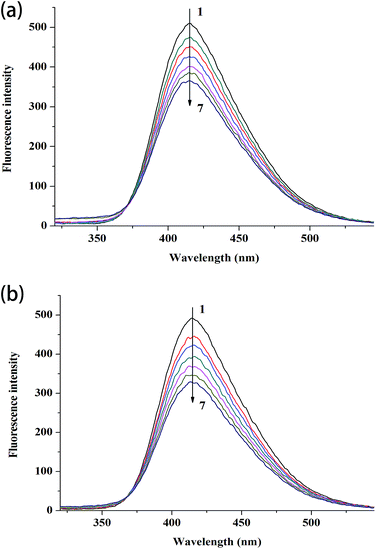
The binding constants based on the fluorescence emission are estimated by the following equation:
 | (2) |
| τ = α1τ1 × α2τ2 | (3) |
Fig. 3 shows the fluorescence lifetime of the free complexes and the complexes after interacting with different CT DNA concentrations. As shown in Table 3, the lifetime values of free complex 1 and 2 are 0.973 and 0.958 ns, respectively. After interacting with different CT DNA concentrations, τ values for complex 1 are 1.006 and 1.028 ns and those for complex 2 are 0.999 and 1.045 ns. τ values only slightly increased with the increment in CT DNA concentration. These phenomena indicate the formation of complexes between CT DNA and the two metal complexes. Thus, the results confirm that fluorescence quenching involves a static mechanism, along with the formation of the ground-state complex.
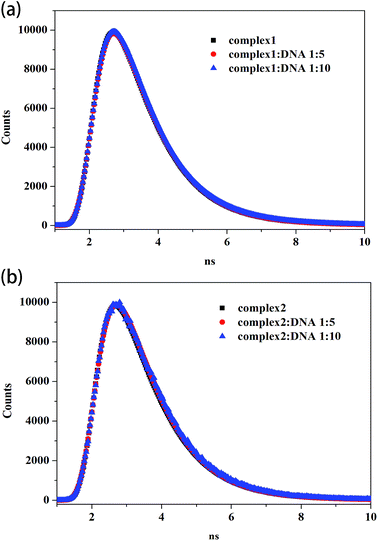 | ||
| Fig. 3 Time-resolved fluorescence lifetime of complex 1 (a) and complex 2 (b) (8 μM) in the absence and presence of CT DNA (40 μM, 80 μM). | ||
| System | Molar ratio (CT DNA![[thin space (1/6-em)]](https://www.rsc.org/images/entities/char_2009.gif) : :![[thin space (1/6-em)]](https://www.rsc.org/images/entities/char_2009.gif) com) com) |
τ1 (ns) | τ2 (ns) | α1 | α2 | τ (ns) | χ2 |
|---|---|---|---|---|---|---|---|
| CT DNA-complex 1 | 0 | 0.503 | 1.102 | 0.213 | 0.786 | 0.973 | 1.494 |
5![[thin space (1/6-em)]](https://www.rsc.org/images/entities/char_2009.gif) : :![[thin space (1/6-em)]](https://www.rsc.org/images/entities/char_2009.gif) 1 1 |
0.773 | 1.310 | 0.567 | 0.433 | 1.006 | 1.296 | |
10![[thin space (1/6-em)]](https://www.rsc.org/images/entities/char_2009.gif) : :![[thin space (1/6-em)]](https://www.rsc.org/images/entities/char_2009.gif) 1 1 |
0.787 | 1.458 | 0.641 | 0.359 | 1.028 | 1.385 | |
| CT DNA-complex 2 | 0 | 0.339 | 1.053 | 0.133 | 0.867 | 0.958 | 1.051 |
5![[thin space (1/6-em)]](https://www.rsc.org/images/entities/char_2009.gif) : :![[thin space (1/6-em)]](https://www.rsc.org/images/entities/char_2009.gif) 1 1 |
0.822 | 1.357 | 0.670 | 0.330 | 0.999 | 1.252 | |
10![[thin space (1/6-em)]](https://www.rsc.org/images/entities/char_2009.gif) : :![[thin space (1/6-em)]](https://www.rsc.org/images/entities/char_2009.gif) 1 1 |
0.920 | 2.175 | 0.900 | 0.100 | 1.045 | 1.288 |
| ΔG = ΔH − TΔS | (4) |
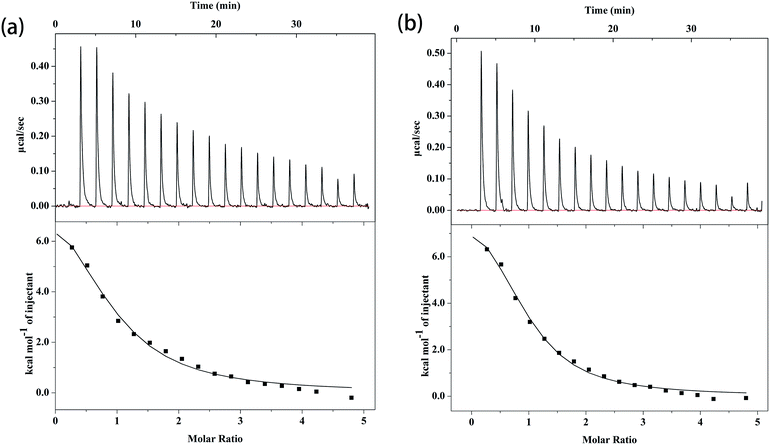
The ITC profiles of the binding of complex 1 and 2 with CT DNA are depicted in Fig. 4, and the related parameters are summarized in Table 4. The K value of small molecule to CT DNA is a vital reference standard to determine the magnitude of binding strength. As shown in Table 4, the K value of complex 1 to CT DNA is (1.03 ± 0.199) × 105 M−1, whereas that of complex 2 is (1.59 ± 0.238) × 105 M−1. The ITC results show that the two complexes and CT DNA systems exhibit moderately intense combinations,46 revealing a tendency that is similar to that in the fluorescence results mentioned above. Moreover, the binding constants of complex 1 and 2 to CT DNA are of the same magnitude compared to other quinolone–Cu mixed ligand complexes.46,47 The K values of complex 1 and 2 are of the same order of magnitude as that of the classical intercalator EB (K = (1.23 ± 0.07) × 105 M−1).14 Although the two K values are in the same order of magnitude, the ternary complex containing phen (complex 2) exhibits better affinity to CT DNA than the ternary complex containing bipy (complex 1), which is consistent with previous results.37,44 This disparity can be explained by the fact that a relatively better planar is present in phen, and flat molecules can slide into the base pairs of DNA (intercalate).48 For the binding of complex 1 and 2 to CT DNA, ΔH is 41.2 ± 5.51 and 38.7 ± 2.83 kJ mol−1, respectively; ΔS is 233 and 229 J mol−1 K−1, respectively; and the calculated ΔG is −28.3 ± 5.51 and −29.6 ± 2.83 kJ mol−1, respectively. The ΔH and ΔS values reveal that the interactions of the complexes with CT DNA are driven by an unfavorable increase in enthalpy, along with considerable enhancements in beneficial entropy.49 The main interaction force occurring between CT DNA and small molecules can be deduced via thermodynamic parameters. ΔH < 0 or ΔH ≈ 0 along with ΔS > 0 corresponds to electrostatic force; ΔH < 0 and ΔS < 0 refer to van der Waals interactions or hydrophobic interactions; and ΔH > 0 as well as ΔS > 0 indicates hydrophobic force.50 The positive values of ΔH and ΔS illustrate that the main force for both interactions is hydrophobic force, which is speculated to existed in intercalating agent–DNA systems.48 Moreover, the negative values of ΔG indicates that the two interactions are spontaneous processes. Apart from the binding affinities, the thermodynamic parameters of the two complexes to CT DNA also show no considerable differences, which can be explained by the similar crystal structures. Furthermore, the K, ΔH, and ΔS values indicate that the most possibility binding mode between the two complexes and CT DNA is intercalation.
| Complex | Complex 1 | Complex 2 |
| K (M−1) | (1.03 ± 0.199) × 105 | (1.59 ± 0.238) × 105 |
| ΔH (kJ mol−1) | 41.2 ± 5.51 | 38.7 ± 2.83 |
| ΔS (J mol−1 K−1) | 233 | 229 |
| ΔG (kJ mol−1) | −28.3 ± 5.51 | −29.6 ± 2.83 |
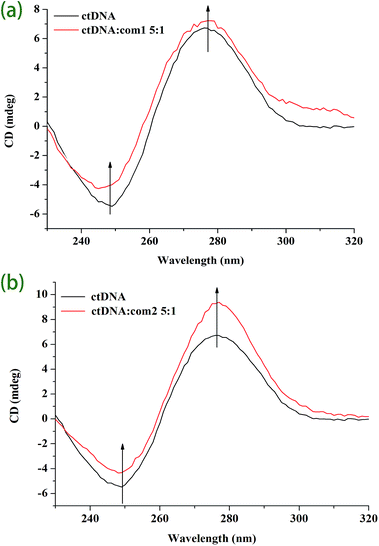 | ||
Fig. 5 CD spectra of CT DNA in the absence and presence of complex 1 (a) and complex 2 (b) at molar ratio of 5![[thin space (1/6-em)]](https://www.rsc.org/images/entities/char_2009.gif) : :![[thin space (1/6-em)]](https://www.rsc.org/images/entities/char_2009.gif) 1 (CT DNA 1 (CT DNA![[thin space (1/6-em)]](https://www.rsc.org/images/entities/char_2009.gif) : :![[thin space (1/6-em)]](https://www.rsc.org/images/entities/char_2009.gif) complex). complex). | ||
Moreover, the results indicate that the interaction mode between DNA and both complexes is intercalative.
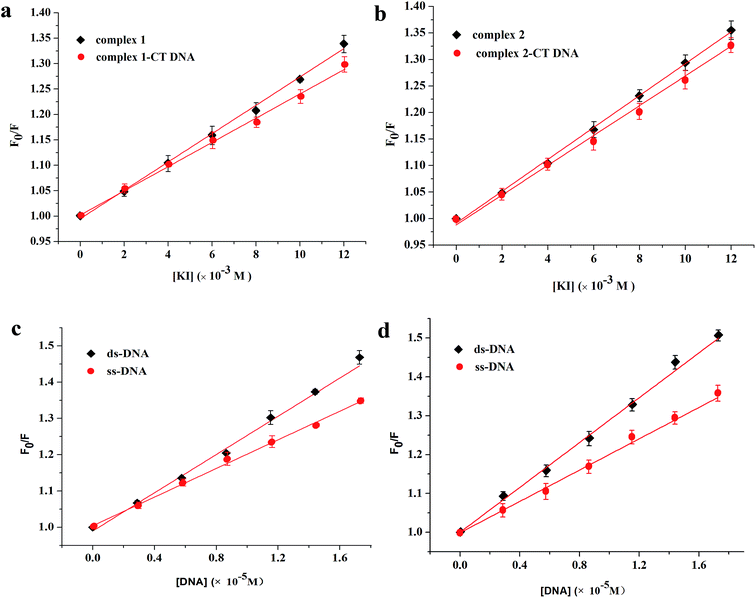
| F0/F = 1 + Ksv[Q] | (5) |
Fig. 6c and d shows the quenching results after the reaction. For complex 1, the calculated quenching constants are (2.63 ± 0.06) × 104 and (1.97 ± 0.04) × 104 M−1 for ds-DNA and ss-DNA, respectively. For complex 2, the slopes are (2.92 ± 0.04) × 104 and (2.09 ± 0.06) × 104 M−1 for ds-DNA and ss-DNA, respectively. The quenching ability of ds-DNA is evidently stronger than that of ss-DNA, indicating that the two complexes could intercalate into CT DNA. The possible binding modes identified in this article are consistent with those shown in the previous experiments.
Conclusion
This study characterized the complex of Cu(II) with the quinolone antibacterial drug flrx which was synthesized in the presence of bipy. X-ray crystallography and other complementary methods revealed that flrx coordinated with Cu(II) via pyridone oxygen and one carboxylate oxygen atom. Moreover, the complex exhibited the space group P![[1 with combining macron]](https://www.rsc.org/images/entities/char_0031_0304.gif) in triclinic form.
in triclinic form.
The interactions of the synthesized and previous reported complexes with CT DNA were investigated using ITC and various spectroscopic techniques. Fluorescence investigation showed that CT DNA quenched the fluorescence of the two complexes effectively. The quenching mechanisms involved static model, as shown by time-resolved fluorescence lifetime determination. The binding constants determined by ITC showed that both complexes exhibited moderate binding ability, although complex 2 exhibited better affinity to CT DNA than complex 1, which is consistent with the fluorescence results. The thermodynamic profiles, including ΔG, ΔS, and ΔH, indicated that binding occurred spontaneously, along with considerable enhancement in beneficial entropy and unfavorable increase in enthalpy. The binding mode of the two complexes to CT DNA is most likely intercalative binding based on the results of CD explorations, KI quenching studies, and DNA denaturation experiments.
Acknowledgements
This work was supported by the National Development and Reform Commission and Education of China (Grant No. 2014BW011) and the Large-scale Science Instrument Shareable Platform Construction of Sichuan Province (Grant No. 2015JCPT0005-15010102).References
- J. Tuma, W. H. Connors, D. H. Stitelman and C. Richert, J. Am. Chem. Soc., 2002, 124, 4236–4246 CrossRef CAS PubMed.
- I. Tsitsa, A. Tarushi, P. Doukoume, F. Perdih, A. de Almeida, A. Papadopoulos, S. Kalogiannis, A. Casini, I. Turel and G. Psomas, RSC Adv., 2016, 6, 19555–19570 RSC.
- L. A. Mitscher, Chem. Rev., 2005, 105, 559–592 CrossRef CAS PubMed.
- P. Mukherjee, E. R. Mandal and S. K. Das, Int. J. Hum. Genet., 2005, 5, 57 CAS.
- O. Aranha, R. Grignon, N. Fernandes, T. J. McDonnell, D. P. Wood and F. H. Sarkar, Int. J. Oncol., 2003, 22, 787–794 CAS.
- G. G. Mohamed, H. F. Abd El-Halim, M. M. I. El-Dessouky and W. H. Mahmoud, J. Mol. Struct., 2011, 999, 29–38 CrossRef CAS.
- W. H. Mahmoud, G. G. Mohamed and M. M. I. El-Dessouky, J. Mol. Struct., 2015, 1082, 12–22 CrossRef CAS.
- N. E. A. El-Gamel and M. A. Zayed, Spectrochim. Acta, Part A, 2011, 82, 414–423 CrossRef CAS PubMed.
- M. A. Ragheb, M. A. Eldesouki and M. S. Mohamed, Spectrochim. Acta, Part A, 2015, 138, 585–595 CrossRef CAS PubMed.
- M. Zampakou, S. Balala, F. Perdih, S. Kalogiannis, I. Turel and G. Psomas, RSC Adv., 2015, 5, 11861–11872 RSC.
- G. Psomas and D. P. Kessissoglou, Dalton Trans., 2013, 42, 6252 RSC.
- M. E. Katsarou, E. K. Efthimiadou, G. Psomas, A. Karaliota and D. Vourloumis, J. Med. Chem., 2008, 51, 470–478 CrossRef CAS PubMed.
- R. Singh, R. N. Jadeja, M. C. Thounaojam, T. Patel, R. V. Devkar and D. Chakraborty, Inorg. Chem. Commun., 2012, 23, 78–84 CrossRef CAS.
- A. Tarushi, C. P. Raptopoulou, V. Psycharis, A. Terzis, G. Psomas and D. P. Kessissoglou, Bioorg. Med. Chem., 2010, 18, 2678–2685 CrossRef CAS PubMed.
- K. C. Skyrianou, F. Perdih, I. Turel, D. P. Kessissoglou and G. Psomas, J. Inorg. Biochem., 2010, 104, 161–170 CrossRef CAS PubMed.
- R. Uauy, M. Olivares and M. Gonzalez, Am. J. Clin. Nutr., 1998, 67, 952S–959S CAS.
- R. B. Rucker, T. Kosonen, M. S. Clegg, A. E. Mitchell, B. R. Rucker, J. Y. Uriu-Hare and C. L. Keen, Am. J. Clin. Nutr., 1998, 67, 996S–1002S CAS.
- S. Lian, G. Wang, L. Zhou and D. Yang, Luminescence, 2013, 28, 967–972 CrossRef CAS PubMed.
- W. Yan, Z. Tieli, Z. Huichun and J. Linpei, Anal. Lett., 2000, 33, 3303–3314 CrossRef CAS.
- S. Q. Shah and M. R. Khan, Transition Met. Chem., 2011, 36, 283–287 CrossRef CAS.
- A. Subastri, C. H. Ramamurthy, A. Suyavaran, R. Mareeswaran, P. Lokeswara Rao, M. Harikrishna, M. Suresh Kumar, V. Sujatha and C. Thirunavukkarasu, Int. J. Biol. Macromol., 2015, 78, 122–129 CrossRef CAS PubMed.
- L. H. Hurley, Nat. Rev. Cancer, 2002, 2, 188–200 CrossRef CAS PubMed.
- S. U. Rehman, Z. Yaseen, M. A. Husain, T. Sarwar, H. M. Ishqi and M. Tabish, PLoS One, 2014, 9, e93913 Search PubMed.
- M. N. Patel, P. A. Dosi and B. S. Bhatt, Med. Chem. Res., 2011, 21, 2723–2733 CrossRef.
- K. Shiva Prasada, L. Shiva Kumara, B. Vijaya and H. D. Revanasiddappa, MyScience, 2010, 5, 1–10 Search PubMed.
- Y. Xiao, Q. Wang, Y. Huang, X. Ma, X. Xiong and H. Li, Dalton Trans., 2016, 45, 10928–10935 RSC.
- C.-Y. Chen, Q.-Z. Chen, X.-F. Wang, M.-S. Liu and Y.-F. Chen, Transition Met. Chem., 2009, 34, 757–763 CrossRef CAS.
- J. Marmur, J. Mol. Biol., 1961, 3, 208–218 CrossRef CAS.
- O. V. Dolomanov, L. J. Bourhis, R. J. Gildea, J. A. K. Howard and H. Puschmann, J. Appl. Crystallogr., 2009, 42, 339–341 CrossRef CAS.
- G. M. Sheldrick, Acta Crystallogr., Sect. C: Struct. Chem., 2015, 71, 3–8 CrossRef PubMed.
- M. Shahlaei, B. Rahimi, M. R. Ashrafi-Kooshk, K. Sadrjavadi and R. Khodarahmi, J. Lumin., 2015, 158, 91–98 CrossRef CAS.
- F. Y. Wu, Y. L. Xiang, Y. M. Wu and F. Y. Xie, J. Lumin., 2009, 129, 1286–1291 CrossRef CAS.
- A. W. Addison, T. N. Rao, J. Reedijk, J. van Rijn and G. C. Verschoor, J. Chem. Soc., Dalton Trans., 1984, 7, 1349–1356 RSC.
- E. Yareth Bivián-Castro, F. Cervantes-Lee and G. Mendoza-Díaz, Inorg. Chim. Acta, 2004, 357, 349–353 CrossRef.
- E. Chalkidou, F. Perdih, I. Turel, D. P. Kessissoglou and G. Psomas, J. Inorg. Biochem., 2012, 113, 55–65 CrossRef CAS PubMed.
- D. K. Saha, S. Padhye, C. E. Anson and A. K. Powell, Transition Met. Chem., 2003, 28, 579–584 CrossRef CAS.
- P. Ruiz, R. Ortiz, L. Perello, G. Alzuet, M. Gonzalez-Alvarez, M. Liu-Gonzalez and F. Sanz-Ruiz, J. Inorg. Biochem., 2007, 101, 831–840 CrossRef CAS PubMed.
- P. Fernandes, I. Sousa, L. Cunha-Silva, M. Ferreira, B. de Castro, E. F. Pereira, M. J. Feio and P. Gameiro, J. Inorg. Biochem., 2014, 131, 21–29 CrossRef CAS PubMed.
- V. A. Kawade, A. A. Kumbhar, A. S. Kumbhar, C. Nather, A. Erxleben, U. B. Sonawane and R. R. Joshi, Dalton Trans., 2011, 40, 639–650 RSC.
- E. P. Irgi, G. D. Geromichalos, S. Balala, J. Kljun, S. Kalogiannis, I. Turel and G. Psomas, RSC Adv., 2015, 5, 36353–36367 RSC.
- C. Protogeraki, E. G. Andreadou, F. Perdih, I. Turel, A. A. Pantazaki and G. Psomas, Eur. J. Med. Chem., 2014, 86, 189–201 CrossRef CAS PubMed.
- J. Chai, J. Wang, Q. Xu, F. Hao and R. Liu, Mol. BioSyst., 2012, 8, 1902–1907 RSC.
- K. Shanmugaraj, S. Anandakumar and M. Ilanchelian, Dyes Pigm., 2015, 112, 210–219 CrossRef CAS.
- D. Xiao, L. Zhang, Q. Wang, X. Lin, J. Sun and H. Li, J. Lumin., 2014, 146, 218–225 CrossRef CAS.
- S. K. Jana, S. K. Seth, H. Puschmann, M. Hossai and S. Dala, RSC Adv., 2014, 4, 57855–57868 RSC.
- M. N. Patel, C. R. Patel and H. N. Joshi, Appl. Biochem. Biotechnol., 2013, 169, 1329–1345 CrossRef CAS PubMed.
- F. Dimiza, S. Fountoulaki, A. N. Papadopoulos, C. A. Kontogiorgis, V. Tangoulis, C. P. Raptopoulou, V. Psycharis, A. Terzis, D. P. Kessissoglou and G. Psomas, Dalton Trans., 2011, 40, 8555–8568 RSC.
- M. Hasanzadeh and N. Shadjou, Mater. Sci. Eng., C, 2016, 61, 1002–1017 CrossRef CAS PubMed.
- G. Wang, H. Wu, D. Wang, C. Yan and Y. Lu, Spectrochim. Acta, Part A, 2013, 104, 492–496 CrossRef CAS PubMed.
- S. Kashanian, M. M. Khodaei, H. Roshanfekr, N. Shahabadi and G. Mansouri, Spectrochim. Acta, Part A, 2012, 86, 351–359 CrossRef CAS PubMed.
- P. Zhao, S.-F. Jin, J.-Z. Lu, J.-L. Lv, G.-Q. Wu, P.-P. Chen, C.-L. Tan and D.-W. Chen, Spectrochim. Acta, Part A, 2015, 137, 227–235 CrossRef CAS PubMed.
- K. Nejedly, J. Chladkova, M. Vorlickov, I. Hrabcova and J. Kypr, Nucleic Acids Res., 2005, 33, e5 CrossRef PubMed.
- J. Kypr and M. Vorlickova, Biopolymers, 2002, 67, 275–277 CrossRef PubMed.
- N. Shahabadi, Z. Mirzaei kalar and N. H. Moghadam, Spectrochim. Acta, Part A, 2012, 96, 723–728 CrossRef CAS PubMed.
- P. Uma Maheswari and M. Palaniandavar, J. Inorg. Biochem., 2004, 98, 219–230 CrossRef CAS PubMed.
- U. Saha and K. K. Mukherjea, Int. J. Biol. Macromol., 2014, 66, 166–171 CrossRef CAS PubMed.
- G. Zhang, X. Hu and P. Fu, J. Photochem. Photobiol., B, 2012, 108, 53–61 CrossRef CAS PubMed.
- B. Qiu, L. Guo, W. Wang and G. Chen, Biosens. Bioelectron., 2007, 22, 2629–2635 CrossRef CAS PubMed.
- C. Cai, X. Chen and F. Ge, Spectrochim. Acta, Part A, 2010, 76, 202–206 CrossRef PubMed.
Footnote |
| † Electronic supplementary information (ESI) available. CCDC 1494707. For ESI and crystallographic data in CIF or other electronic format see DOI: 10.1039/c6ra18971g |
| This journal is © The Royal Society of Chemistry 2016 |

