Synergistic effects of filler-migration and moisture on the surface structure of polyamide 6 composites under an electric field

Qi Zhou*a, Jingjing Zhangab, Yuanyu Wanga, Weidong Wanga, Shunying Yaoa, Yang Conga and Jianghua Fanga
aSchool of Materials and Chemical Engineering, Ningbo University of Technology, Ningbo 315016, P. R. China. E-mail: zhouqi@nbut.cn
bDepartment of Polymer Science and Engineering, School of Material Science and Chemical Engineering, Ningbo University, Ningbo, 315211, Zhejiang, P. R. China

Received 26th July 2016 , Accepted 2nd October 2016

First published on 3rd October 2016


Abstract

Polyamide 6 (PA6) and PA6 composites with 2 wt% of nanofillers (aminopropyl isobutyl POSS (AB-POSS) or polymer grade montmorillonite (PGN)) were synthesized by electric assisted phase inversion at different moistures. The breath figure phenomenon occurred spontaneously although the moisture of the atmosphere just reached 55%, owing to the fast evaporation rate of 2,2,2-trifluoro ethanol under the electric field. The results of X-ray diffraction indicated that the high moisture disturbed the original arrangement of H-bonded planes in the PA6, which affected the crystalline structure of PA6 and the dispersion of PGN. The PGN and AB-POSS had different migration behaviors under the electric field. This migration behavior and the moisture showed synergistic influences on the surface structure of the PA6 composites. Water contact angle measurements showed that the surface of PA6 composites was able to switch from hydrophobic to hydrophilic (i.e., 58.7–125.8°) owing to the synergistic effects of filler-migration and moisture. The proposed formation mechanism of the PA6 composites under the electric was discussed.

1. Introduction

Polymeric membranes have been widely used in industrial applications, such as microfiltration, ultrafiltration, reverse osmosis, gas separation and photography.1–3 Porosity is important for determining the end use of a membrane. The porosity and the pore sizes of the membrane determine the efficiency of filtration for microfiltration and ultrafiltration.1,2

Electric field assisted phase inversion offers an efficient method to prepare polymeric membranes with the desired surface structure.4–7 With the presence of an electric field, not only the evaporation rate of solvent can be enhanced but also the molecular dynamics of polymer chains and the migration of inorganic fillers can be controlled.8–11 Böker A et al.8–10 synthesized a polystyrene-b-poly(2-vinyl pyridine) membrane by electric field assisted phase inversion. Order-disorder transition of the polymer chains, kinetics of chain alignment and thermodynamic properties of the copolymer were largely correlated with the presence of electric field. Zhai et al.11 developed an electric assisted breath figure (BF) method to control the pore size of polystyrene film. Wet air is introduced onto the surface of casting solution under the electric field. The surface tension of water was reduced by increasing the voltage. Patterned arrays of micrometer-sized pores in polymer films were formed by condensing the water droplets on the surface of the polymer solution. Further incorporation of silica, which acted as steric barriers to avoid coalescence of water droplets, enhanced the ordered structure of pores.12 So far, the electric assisted phase inversion is always conducted on the nonpolar polymers (e.g. polystyrene) or block copolymers.8–12 Recently, our group applied electric assisted phase inversion on the polar polymer systems (i.e., polyamide (PA) and its composites). The PA is a widely used engineering plastic and its crystallization typically depends on the H-bonds. It was found that the presence of electric field not only influenced the alignment of H-bonds of PA6 but also controlled the migration behavior of fillers. The crystallinity of PA6 was reduced significantly.13 Importantly, the electric field notably accelerated the evaporation rate of solvent (i.e. 2,2,2-trifluoroethanol, TFE) comparing with the membrane prepared without the electric field.13 This fast evaporation rate of TFE may significantly decrease the surface temperature of the polymer solution, which is possible to induce the BF phenomenon and affects the surface structure. However, to the best of our knowledge, there is no report focusing on the BF phenomenon of polar polymers under the electric field.

In this work, PA6 and PA6 composites are synthesized by electric assisted phase inversion. Two kinds of inorganic fillers (i.e., aminopropyl isobutyl POSS (AB-POSS) and polymer grade montmorillonite (PGN)) will present different migration behaviors under the electric field.14,15 The preparation of membrane is conducted with the atmosphere moisture changing from 20 to 85%. We aim to reveal the synergistic effects of filler-migration and moisture on the BF phenomenon and microstructure of PA6 and its composites under the electric field. The surface structures and hydrophilicity of PA6 composites are studied.

2. Experiments

2.1 Materials

PA6 (Mw = 30[thin space (1/6-em)]000 g mol−1) were purchased from Sigma-Aldrich. The samples were dried under vacuum for at least 24 h at 80 °C. Aminopropylisobutyl POSS (AB-POSS) was obtained from Hybrid Plastics Company. Polymer grade montmorillonite (PGN) was obtained from Nanocor Company. The structure of AB-POSS and MMT are shown in Fig. 1. The density of PA6, AB-POSS and PGN are 1.02 g cm−3, 1.16 g cm−3, 2.5 g cm−3, respectively.14,15 The PA6, AB-POSS, and PGN were dried in a vacuum oven for 24 h at 70 °C. 2,2,2-Trifluoroethanol (99.5% of purity) was purchased from Sigma-Aldrich and was used as received.
image file: c6ra18963f-f1.tif
Fig. 1 Microstructure of AB-POSS and PGN filler.

2.2 Preparation of PA6 and PA6 composites under electric field

The PA6 was dissolved in TFE at a concentration of 0.05 wt%. The mixture was stirred for at least 4 h to achieve a PA6 solution. The fillers were added into the solutions with a filler/PA6 ratio of 2 wt% and stirred for at least 48 h. 2 ml of the solutions was cast and spread over an electrode plate with an area of 56 cm2 at room temperature. The moisture was varied from 20 to 85% depending on the relative humidity of the environment. The moisture was monitored by a hygrometer. The experimental equipment was shown in our previous work.13 Two metal sheets with Teflon coating were used as electrode plates. The polymer solution was cast onto the bottom plate which was connected to the ground. The electric field strength was fixed at 0.75 MV m−1 by a high voltage d.c. power source. 1 h was spent for evaporating the solutions totally. However, it would take 5 h to achieve the membrane without the assistance of electric field. The fluctuation of moisture was ±2% during the casting procedure. All the samples were dried under vacuum at 70 °C for more than 24 h. The films had a thickness of 30 ± 10 μm.

2.3 Characterization

All the samples were dried in a vacuum oven at 70 °C for more than 24 h before characterizations.
2.3.1 X-ray diffraction measurements (XRD). XRD measurements were carried out on a Bruker D8 Advance diffractometer with a sample area of 1 cm2. The detector operated at 40 kV and 40 mA, using Cu Kα radiation (λ = 0.154 nm). The step size was 0.01°.
2.3.2 Scanning electron microscopy (SEM) and energy dispersive X-ray (EDX). Morphology of the polymer surface was analyzed by a HITACHI S-4800 SEM using an acceleration voltage of 10 kV. Samples were coated by Pt before the observation. EDX analysis was also conducted on the same instrument using the EDX apparatus. The atomic concentration of silicon on the polymer surface was calculated by EDX without gold sputtering.
2.3.3 Water contact angle (WCA). WCA measurements were performed with an FTA200 Dynamic Contact Angle Analyzer, determined using a sessile droplet of ultrapure water (Mili-Q, Millipore Corp.) having a volume of ∼50 μl at room temperature (about 23 °C), and determined at the triple point of air, water and membrane. Five independent measurements were conducted on the same sample, and the mean value was determined.

3. Results and discussion

3.1 Effect of the moisture on the crystal structure of PA6 and its composites

PA6 is a semi-crystalline polymer and exhibits two crystal forms: α phase and γ phase.16 The main differences between these two phases lie in the lattice parameters and the orientation of the H-bonds between the N–H and C[double bond, length as m-dash]O groups. The α crystalline phase has crystal parameters with a = 0.956 nm, b = 1.724 nm, c = 0.801 nm, and β = 67.5°.17 In the α phase, the H-bonds are formed between anti-parallel chains. The γ phase has crystal parameters with a = 0.933 nm, b = 1.688 nm, c = 0.478 nm, and β = 121.0°, and the twisted chains allow the H-bonds to be formed between parallel chains.17–19

Fig. 2 compares the XRD results of PA6 and its composites. For PA6 and PA6/AB-POSS (Fig. 2a and c), two primary reflections can be observed at 2θ = 20.0° and 2θ = 24.0°, which are attributed to the α 200 and α 002 (H-bonded) crystal planes, respectively. However, the PA6/PGN composite, prepared at low moisture (i.e., 40%), contains both α phase and γ phase crystals where two further primary reflections for γ 020 (at 2θ = 11.0°) and γ 001 (at 2θ = 21.5°) are shown (see Fig. 2b).20 This result means that the addition of PGN favors the formation of γ phase crystals.20,21 For PA6/PGN prepared at a higher moisture (i.e., > 50%), only the reflections from α crystals are observed, indicating that the high moisture diminishes the effect of PGN on the formation of γ phase crystals and can result in a more stable crystal (i.e., α crystal). At the region of 2θ below 10.0°, the pure PGN shows reflections at 2θ = 7.5° from its (001) plane indicating a 1.2 nm distance of the interlayer (d001). For PA6/PGN composites prepared at the moisture of 40%, the 2θ of (001) plane of PGN is split into two peaks, locating at 3.6° (d001 = 2.4 nm) and 5.4° (d001 = 1.6 nm), respectively. This phenomenon suggests that the PA6 chains are intercalated into the PGN interlayers with an increment of the basal spacing of PGN. This dispersion of PGN may be caused by the influence of two kinds of crystals of PA6 which affect the dispersion state of PGN.19,20 However, only one reflection peak of PGN appears at a low position (at 4.1°, d001 = 2.2 nm) when the sample is prepared at higher moistures (>50%). This reflection peak moves to a high 2θ slightly, indicating a decreased distance of PGN interlayer. Thus, the interaction between humidity and PA6 chains can influence the formation of PA6 crystals and also the dispersion of PGN fillers.


image file: c6ra18963f-f2.tif
Fig. 2 The XRD results of (a) PA6, (b) PA6/PGN, and (c) PA6/AB-POSS samples prepared at different humidity; (d) I24/I20 (intensity ratio) of each polymer calculated by Jade 5.0.

A sample with an isotropic arrangement of phase crystals will show reflections of about equal intensity (peak area) from both the (002) and (200) planes.17,19 However, the intensity of α 200 planes is lower than that of α 002 in all of the samples, which indicates a preferential arrangement of H-bonded planes.18 Fig. 2d shows the intensity ratio (I24/I20) of each reflection peaks. It can be found that the data of I24/I20 gradually decreases with the increment of moistures. This indicates that the moisture can hinder the original arrangement of the H-bonded plane of PA6, showing the strong interaction between the water molecules and polymer chains.

3.2 Effect of the moisture on the morphology of PA6 and its composites

3.2.1 Surface morphology of PA6 and its composites. Fig. 3 shows the SEM images of the air-facing surface of pure PA6. The surface structure of PA6, prepared at the moisture of 20%, is similar to that of the moisture of 40% (see Fig. S1 in the ESI). As shown in Fig. 3a, the surface shows micro voids at a low moisture case. When the moisture is up to 55%, the surface shows disordered and porous structure, as is shown in Fig. 3b and c. The diameters of pores are around 5–7 μm. The pore size is further enlarged with the increment of moisture (see Fig. 3b–g). The bottom-side morphology of the PA6 samples is shown in Fig. 4. The surface morphology of the bottom side is relatively flat due to the substrate effect. The samples, prepared at the moisture of 40%, are quite smooth without any micro voids (see Fig. 4a and b). The film appears porous structure with an increment of pore size when the humidity is further increased (see Fig. 4c–f).
image file: c6ra18963f-f3.tif
Fig. 3 SEM images of the air-facing side of pure PA6 samples prepared at different moistures. (a) 40%; (b) 55%; (d) 75%; (f) 85%; (c), (e) and (g) is the magnification of (b), (d) and (f) where the framed area is the magnified zone.

image file: c6ra18963f-f4.tif
Fig. 4 SEM images from the bottom side of pure PA6 samples prepared at different moistures and magnification: (a) 40%; (b) 55%; (c) 70%; (d) magnifying imaging of (c); (e) 85% and (f) magnifying imaging of (e).

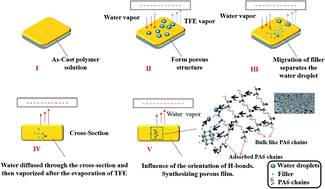
Evolution of the morphology as a function of the moisture can be explained by the theory of the breath-figure mechanism:22 the temperature of the solution surface drops down when the TFE is evaporated under the electric field. The brume in the atmosphere will condense onto the cold surface, and form water droplets. In our system, the polar TFE and polymer solution cannot hold the water droplets owing to the good miscibility between TFE and water.23,24 Thus, coalescence of water droplets occurs, and a disordered array of pores is formed. It shall be mentioned that the TFE has a 5 times higher of evaporation rate under the electric field than that of the case without the electric field.13 Thus, the surface temperature of polymer solution drops down very fast. As a result, the brume in the atmosphere can condensate on the surface of casting solution. The BF phenomenon can occur spontaneously although the atmosphere moisture only reaches 55%. The further increment of moisture will enlarge the water aggregation, leading to an increment of pore size. Furthermore, the density of water is greater than that of the TFE. Thus, the water droplets will sink into the casting solution. However, the water molecules will be evaporated later than the TFE due to its high boiling point. A porous structure is thus formed throughout the films. Multi-scales pores with diameters ranging from nanometers to micrometers can be obtained along the cross-section. The effect of moisture on the surface morphology of PA6 composites is similar to that of the pure PA6 samples (see Fig. S2–S5).

3.2.2 Cross-section morphology of PA6 and its composites. Fig. 5 shows the cross-section morphology of the PA6 and its composites. All of the samples prepared at 40% of the humidity are compacted (see Fig. 5a). There are some micro voids in the upper zone when the humidity rises to 55%. The lower region assumes a sponge-like structure (see Fig. 5b). The whole cross-section becomes sponge-like with a further increment of the moisture, except the top area occupying by some concavities (see Fig. 5c and d). This morphology is generated by the aggregation and permeation of water droplets, whose volumes are served as the templets during the evaporation. Interestingly, the similar pore size and structure are observed at the air-facing side of PA6 and PA6/PGN composites: large cavities are in the upper layers, while the pores with small sizes present at the lower layer (see Fig. 5Ic and d and IIc and d). However, the size of cavities is much smaller at the air-facing side of PA6/AB-POSS. The cross-section of PA6/AB-POSS presents a relatively homogenous sponge-like structure (see Fig. 5IIIc and d), appearing a higher porosity, particularly on the bottom side. This porous structure may be caused by the permeation and dispersion of water droplets which will be further discussed in the following section.
image file: c6ra18963f-f5.tif
Fig. 5 SEM images of cross-section of pure PA6 samples prepared at different humidity: (a) 40%; (b) 55%; (c) 70 and (d) 85%. The first line (I) is PA6; the second line (II) is PA6/PGN composites; the third line (III) is PA6/AB-POSS composites.

3.3 Migration of filler in the PA6 composites films prepared under the electric field

The weight concentration of silicon is higher than that of the air-facing side in the bottom side of PA6/PGN composites (see Table 1). This indicates that the PGN fillers migrate to the lower side. However, the weight concentration of silicon are almost the same on the topside and bottom side of PA6/AB-POSS, close to the theoretical concentration of silicon (0.19 wt% (ref. 14)). This indicates that the migration of the AB-POSS is hindered when the electric field is applied. It may be due to the presence of the electric field where the motion of AB-POSSs is confined through the charge interaction, thereby hindering its migration.13 Interestingly, the concentration of silicon inside the pore is larger than that of the pore-edge. It suggests that the fillers are aggregated surrounding the water droplets.25,26 A higher concentration of silicon can be observed inside the pores when the composites are synthesized at a high moisture. It indicates that the water droplets can accelerate the aggregation of fillers.
Table 1 The water contact angle and silicon atomic concentration on the topside and bottom side of PA6 and its composites
Sample Humidity (%) Topside SWCAa (°) Bottom SWCA (°) WSi on the top-sideb wt% WSi on the bottom side wt% WSi inside of pores wt% WSi on the edge of pores wt%
a SWCA is the static water contact angles.b WSi is the weight concentration of silicon.
PA6 40 58.7 ± 1.2 62.0 ± 0.9
55 73.9 ± 2.1 63.3 ± 1.0
70 85.1 ± 1.1 64.8 ± 0.6
85 91.3 ± 1.4 65.6 ± 1.4
PA6/PGN 40 60.2 ± 1.1 63.2 ± 1.2 0.04 0.18    
55 72.4 ± 0.6 65.3 ± 0.6 0.04 0.20 0.19 0.09
70 86.1 ± 1.0 68.3 ± 0.3 0.05 0.18 0.43 0.02
85 90.3 ± 0.6 78.1 ± 1.8 0.05 0.16 1.10 0.02
PA6/AB-POSS 40 80.6 ± 1.7 72.4 ± 2.6 0.18 0.23
55 103.5 ± 2.1 78.0 ± 1.5 0.20 0.22 0.39 0.03
70 118.6 ± 2.9 107.9 ± 1.6 0.20 0.21 0.53 0.02
85 125.8 ± 1.0 107.3 ± 1.6 0.20 0.19 1.30 0.10


3.4 Contact angle of PA6 and its composites prepared under the electric field

Table 1 shows the typical static water contact angles (SWCAs) of PA6 and its composites. All the polymers present an increment of SWCAs with increasing the moisture on both sides. This can be ascribed to the rough surface which is caused by the increased amount of pores and the enlarged pore size.11,12,19 A cavitation can appear in the interspace between the polymer surface and the water droplet, hindering the extension of water droplet.11,12 A similar dependence of SWCAs on the moisture can be found in the PA6/AB-POSS composites. However, the SWCAs of PA6/AB-POSS composites are increased apparently on both sides of the films. These SWCAs are further increased with the increment of the moisture. The SWCAs can even reach 125.8° for the air-facing side and 107.3° for the bottom side when the humidity is 85%. The migration of AB-POSS is hindered under the electric field, inducing a homogeneous distribution of pores along the cross-section. More small pores can be formed at the airside and bottom side of the membrane, which will increase the SWCAs significantly because of the increased roughness.

3.5 A proposed mechanism of the structure evolution of PA6 and its composites

Fig. 6 shows a proposed mechanism for the structure evolution of PA6 and its composites in the presence of electric field under the different moistures. The electric field can induce the evaporation of TFE, leading to a dramatic reduction of surface temperature.23 Many brumes will thus condense on the surface of solution and form water droplets with increasing the moisture.12,23 It is hard to stabilize the water droplets on the surface of casting solution as the water droplets can dissolve into the TFE at arbitrary concentration. The water will subsequently permeate into the solution. These water droplets will be removed out after the evaporation of TFE due to their high boiling points. Thus, the porous structure of the membrane can be obtained through out the cross-section at high moisture. Also, the water droplets can aggregate at a high humidity (80%), forming many large pores.27 Incorporation of fillers may hinder the aggregation of water droplets through the H-bonds interaction. Therefore, a more homogenously porous structure is formed.22 However, the electric field can control the migration of fillers during the phase inversion.13 The PGNs migrate to the bottom side owing to its high density. Thus, the surface morphology of the air-facing side in the PA6/PGN composites is similar to that of the pure PA6. The migration of AB-POSS is hindered, leading to a homogenous distribution of AB-POSS along the cross-section and also an increment of crystallinity of PA6 (see Fig. S6 in the ESI). This increased polymer crystallinity and the assembly behaviors of AB-POSS around the water droplets are like envelopes that can hinder the coalescing of water droplets during the permeation of water droplets.22 Thus, a homogeneous distribution of AB-POSS along the cross-section can finally direct a homogeneously porous structure along the cross-section of PA6 composites. Moreover, the interaction among water droplets, PA6 chains, and fillers are present through the H-bonds. This interaction may occur throughout the polymer matrix during the permeation of water droplets. The moisture can thus diminish the original arrangement of H-bonded planes of PA6 and its composites with the assistance of electric field.
image file: c6ra18963f-f6.tif
Fig. 6 A proposed mechanism for the structure evolution of PA6 and its composites in the presence of electric field.

4. Conclusions

The combined influence of moisture and filler-migration to the structure of PA6, PA6/PGN, and PA6/AB-POSS composites were investigated under the electric field. It was found that the moisture affected the formation of PA6 crystals and the arrangement of the H-bonded plane. The fast evaporation rate of TFE significantly dropped down the surface temperature of casting solution and condensed the brumes in the atmosphere. Thus, the breath figure was able to occur spontaneously although the humidity was only reach 55%, resulting in a porous polymer matrix. However, the water droplets permeated through the cross section during the casting, leading to a heterogeneously porous structure along the cross-section of the film. This heterogeneously porous structure showed a relationship with the migration of fillers. The PGNs migrated to the bottom side owing to its high density. In consequence, the morphology and hydrophilicity at the air-side surface of PA6/PGN composites were similar with that of the pure PA6. However, a membrane with the homogenous distribution of pores was obtained, since the migration of AB-POSSs was hindered by the electric field.

Acknowledgements

Funding from the project of National Natural Science Foundation of China (No. 51203081), the Natural Science Foundation of Zhejiang Province (LY16E030005, LY14B040001), the Natural Science Foundation of Ningbo (2016A610095), Weiming Wang innovation funding of Ningbo University of Technology (2015012) and Ningbo Science and Technology Innovation Team (2011B2002) are gratefully acknowledged.

References

  1. W. Salim and W. W. Ho, Curr. Opin. Chem. Eng., 2015, 8, 76–82 CrossRef.
  2. S. Kim and Y. M. Lee, Prog. Polym. Sci., 2015, 43, 1–32 CrossRef CAS.
  3. A. Figoli, T. S. E. Di Nicolo, X. M. Li, T. He, S. Tornaghi and E. Drioli, Green Chem., 2014, 16, 4034–4059 RSC.
  4. M. P. Stoykovich, K. C. Daoulas, M. Müller, H. Kang, J. J. de Pablo and P. F. Nealey, Macromolecules, 2010, 43, 2334–2342 CrossRef CAS.
  5. K. Galatsis, K. L. Wang, M. Ozkan, C. S. Ozkan, Y. Huang, J. P. Chang, H. G. Monbouquette, Y. Chen, P. Nealey and Y. Botros, Adv. Mater., 2010, 22, 769–778 CrossRef CAS PubMed.
  6. T. Xu, J. T. Goldbach and T. P. Russell, Macromolecules, 2003, 36, 7296–7300 CrossRef CAS.
  7. V. Olszowka, M. Hund, V. Kuntermann, S. Scherdel, L. Tsarkova and A. Böker, ACS Nano, 2009, 3, 1091–1096 CrossRef CAS PubMed.
  8. C. Liedel, K. A. Schindler, M. J. Pavan, C. Lewin, C. W. Pester, M. Ruppel, V. S. Urban, R. Shenhar and A. Böker, Small, 2013, 9, 3276–3281 CAS.
  9. C. Liedel, C. W. Pester, M. Ruppel, C. Lewin, M. J. Pavan, V. S. Urban, R. Shenhar and P. Bösecke, ACS Macro Lett., 2013, 2, 53–58 CrossRef CAS.
  10. H. G. Schoberth, C. W. Pester, M. Ruppel, V. S. Urban and A. Böker, ACS Macro Lett., 2013, 2, 469–473 CrossRef CAS.
  11. S. Zhai, J. R. Ye, N. Wang, L. H. Jiang and Q. Shen, J. Mater. Chem. C, 2014, 2, 7168–7172 RSC.
  12. S. Zhai, E. J. Hu, Y. Y. Zhi and Q. Shen, Colloids Surf., A, 2015, 469, 294–299 CrossRef CAS.
  13. Q. Zhou, Y. Cong, N. K. Wu and L. S. Loo, Appl. Surf. Sci., 2015, 357, 1454–1462 CrossRef CAS.
  14. Q. Zhou, Z. Q. Wang, Y. L. Shi, J. H. Fang, H. Q. Gao and L. S. Loo, Appl. Surf. Sci., 2013, 284, 118–125 CrossRef CAS.
  15. Q. Zhou, J. Y. Zhang, J. H. Fang and W. Li, RSC Adv., 2015, 5, 16631–16639 RSC.
  16. H. Meng, G. X. Sui, P. F. Fang and R. Yang, Polymer, 2008, 49, 610–620 CrossRef CAS.
  17. T. D. Fornes and D. R. Paul, Polymer, 2003, 44, 3945–3961 CrossRef CAS.
  18. L. S. Loo and K. K. Gleason, Macromolecules, 2003, 36, 6114–6126 CrossRef CAS.
  19. Q. Zhou, K. P. Pramoda, J. M. Lee, K. Wang and L. S. Loo, J. Colloid Interface Sci., 2001, 335, 222–230 Search PubMed.
  20. Q. Zhou, J. H. Fang, H. Q. Gao and L. S. Loo, Appl. Surf. Sci., 2013, 282, 115–120 CrossRef CAS.
  21. S. S. Nair and C. Ramesh, Macromolecules, 2005, 38, 454–462 CrossRef CAS.
  22. A. Zhang, H. Bai and L. Li, Chem. Rev., 2015, 115, 9801–9868 CrossRef CAS PubMed.
  23. K. H. Wong, M. Hernandez-Guerrero, A. M. Granville, T. P. Davis, C. Barner-Kowollik and M. H. Stenzel, J. Porous Mater., 2006, 13, 213–223 CrossRef CAS.
  24. H. Battenbo, R. J. Cobley and S. P. Wilks, Soft Matter, 2011, 7, 10864–10873 RSC.
  25. A. Asadinezhad, H. A. Knonakdar, S. H. Jafari, F. Simon and U. A. Wagenknecht, J. Appl. Polym. Sci., 2013, 128, 1569–1574 CAS.
  26. W. Sun, Y. Zhou and Z. Chen, Macromol. Res., 2013, 21, 414–418 CrossRef CAS.
  27. Y. Tian, H. Ding, Q. Jiao and Y. Shi, Chem. Phys., 2006, 207, 545–553 CAS.

Footnote

Electronic supplementary information (ESI) available. See DOI: 10.1039/c6ra18963f

This journal is © The Royal Society of Chemistry 2016
Click here to see how this site uses Cookies. View our privacy policy here.