A highly selective and simultaneous determination of ascorbic acid, uric acid and nitrite based on a novel poly-N-acetyl-L-methionine (poly-NALM) thin film

Ayyadurai Kannana, Arumugam Sivanesanb, Govindasamy Kalaivania, Arumugam Manivelc and Ranganathan Sevvel*a
aPost Graduate and Research Department of Chemistry, Vivekananda College, Tiruvedakam West, Madurai-625 234, Tamil Nadu, India. E-mail: sevvelr@gmail.com; Fax: +91 4543 258358; Tel: +91 98657 08536
bNanotechnology and Molecular Sciences Discipline, Faculty of Science and Engineering, Queensland University of Technology, 2 George St. Gardens Point Campus, Brisbane 4001, QLD, Australia
cPost Graduate and Research Department of Chemistry, Saraswathi Narayanan College, Madurai-625 022, Tamil Nadu, India

Received 20th July 2016 , Accepted 27th September 2016

First published on 29th September 2016


Abstract

This paper demonstrates the facile fabrication of an N-acetyl-L-methionine (NALM) polymer film on a glassy carbon electrode (GCE) by an electropolymerization technique. Atomic force microscopy (AFM), X-ray photoelectron spectroscopy (XPS), scanning electron microscopy (SEM) and electrochemical techniques such as cyclic voltammetry (CV) and differential pulse voltammetry (DPV) were used to characterize the modified electrode. This poly-NALM/GCE not only exhibits strong electrocatalytic activity towards the oxidation of ascorbic acid (AA), uric acid (UA) and nitrite with a shift in oxidation potential towards the less positive side, but also enhances peak current responses at physiological pH (7.2) conditions. Further, the overlapped anodic voltammetric peaks of the three analytes on a bare GC electrode were well-resolved into their independent oxidation peaks at the poly-NALM/GC modified electrode with a peak separation of 160 and 590 mV for AA–UA and UA–nitrite, respectively. Under the optimal experimental conditions, the anodic peak currents of AA, UA and nitrite increased linearly within the concentration ranges 10–1000 μM, 1–600 μM and 1–500 μM with correlation coefficients of 0.990, 0.996 and 0.994, respectively. The detection limits are 0.97, 0.34 and 0.75 μM for AA, UA and nitrite ion, respectively (S/N = 3). The modified electrode was successfully utilized to determine AA, UA and nitrite ion simultaneously in real samples such as human urine and tap water samples.

1. Introduction

Ascorbic acid (AA), uric acid (UA) and nitrite ions are indispensable biomolecules in human metabolism which are usually coexisting in our body fluids.1,2 AA can be found in many biological systems and food materials. Because of the antioxidant nature of ascorbic acid, it acts against free radical induced diseases. It is imperative in iron absorption, collagen synthesis, enhancement of immunity, and plays a crucial role in wound healing and osteogenesis, and treatments for scurvy and cancer.3–5 UA (2,6,8-trihydroxypurine) is the main end product of purine metabolism. For a healthy human being, the typical concentration of UA is 0.2–0.5 mM in serum and 1.4–4.4 mM in urine. Monitoring of UA in blood and urine is one of the parameters in clinical analysis. Variations in the concentrations of UA in the human body have been related to many diseases, such as arthritis, gout, hyperuricaemia, Lesch–Nyan disease, obesity, diabetes, high cholesterol, high blood pressure, kidney disease and heart disease.6–9 Nitrite ion is an antioxidant that is used to cure processed meat.10 Nitrite is found in drinking water due to the usage of nitrate rich fertilizers used in agricultural land and also found in animal feed stuffs.11 On the other hand, excess exposure to nitrite can cause accelerated pulse, dyspnea, muscle tremors, weakness, vomiting, unstable gait, and cyanosis leading to death. Ingested nitrite causes the oxidation of haemoglobin into methaemoglobin in blood, where the methaemoglobin cannot bind with an oxygen molecule and subsequently leads to methaeglobinamia or blue baby syndrome.12 Nitrite can also be converted into carcinogenic N-nitroso compounds in the body, which may result in cancer and hypertension.13 Due to the above physiological significance, simultaneous and selective determination of AA, UA and nitrite is part and parcel of diagnostic research, food analysis and their physiological function studies. The electrochemical method is a robust and user-friendly technique well-suited to the detection of biomolecules such as AA, UA and nitrite.14 However, bare electrodes like glassy carbon and other metal electrodes fail to detect the biomolecules simultaneously due to overlapping of their voltammetric signals and fouling effects.15,16 To overcome these complications, chemically modified electrodes (CME) have been developed in recent decades. Some important examples of CMEs are self-assembled monolayers,17–20 conducting polymers,21,22 clay modified electrodes,23,24 metal oxides,25,26 metal nanoparticles,27–29 and carbon based material modified electrodes.30–32 Among the various methods of preparation of CMEs, electropolymerization is a promising technique to immobilize the polymer on a GCE. The advantages of electropolymerized electrodes are precise control over the thickness of the film, wide choice of electrode materials, strong adherence power on the surface of the electrode, broad potential window, large surface area which promotes higher turn-over efficiency, ease of preparation, high stability and sensitivity.33

Amino acids are the building blocks of proteins and are known to be precursors for various physiological metabolic processes. Only a few reports are available in the literature using amino acids as polymers to sense biomolecules.34–37 To the best of our knowledge, the electropolymerization of N-acetyl-L-methionine has not been reported so far. In this study we report the fabrication of a poly(N-acetyl-L-methionine) film modified glassy carbon electrode i.e., poly-NALM by electropolymerization using cyclic sweeps and this modified electrode is applied to catalyse the oxidation of AA, UA and nitrite and simultaneous determination of them by voltammetric methods. The developed sensor demonstrated high selectivity, stability and satisfactory reproducibility in response to AA, UA and nitrite. Finally, the ability of this methodology for the simultaneous determination of AA, UA and nitrite in human urine and tap water samples has been evaluated with satisfactory recoveries. The main advantages of the newly fabricated AA, UA and nitrite sensors are that the poly-NALM preparation and modification (rapid and inexpensive electrodeposition method) adopted in the present study are very simple when compared to the literature reports.

2. Experimental

2.1. Chemicals

N-Acetyl-L-methionine (NALM), ascorbic acid (AA), uric acid (UA) and sodium nitrite were purchased from Aldrich and were used as received. All other chemicals used in this experiment were of analytical grade. Phosphate buffer solutions were prepared with 0.1 M Na2HPO4 and 0.1 M NaH2PO4 and adjusting the pH using 0.1 M H3PO3. Doubly distilled deionized water was used for the preparation of all solutions and washing.

2.2. Live subject statement

All experiments were performed in compliance with the relevant laws and institutional guidelines. A consent was obtained for any experimentation with human subjects.

2.3. Instruments

Electrochemical measurements like cyclic voltammetry (CV), and differential pulse voltammetry (DPV) were performed using CHI 6088D potentiostats (CH Instrument. Austin, TX, USA). A conventional two compartment three electrode cell, consisting of mirror polished BASi glassy carbon electrode (GCE-3 mm diameter) as the working electrode, platinum wire as counter electrode and Ag/AgCl (saturated KCl) as reference electrode. All reported potentials were reference to Ag/AgCl (saturated KCl). XPS measurements were carried out in a PHI 5000 VersaProbeTM-Scanning ESCA Microprobe™ (ULVAC-PHI, Japan/USA, 2008) instrument at a base pressure of < 5 × 10⁻⁹ mbar. Monochromatic AlKα radiation was used and the X-ray beam, focused to a 100 μm diameter, was scanned over a (250 × 250) μm2 surface at an operating power of 25 W (15 kV). SEM measurements were performed using an FEI Nova™ NanoSEM Scanning Electron Microscope 450 with an accelerating voltage of 10 kV under high vacuum. The Atomic Force Microscopy (AFM) image was recorded by a scanning probe microscope (Vecco, USA). All experiments were done at room temperature.

2.4. Fabrication of the poly-NALM/GCE

The poly-NALM/GCE film electrode was prepared by the following process. The GCE was first mirror polished mechanically with 0.05 μm alumina slurry using a polishing cloth and subsequently rinsed with deionized water. Then the electrode was sonicated in deionized water for 15 min to completely remove any adsorbed alumina particles. Electropolymerization of N-acetyl-L-methionine (NALM) on GCE was carried out by 7 successive potential sweeps between −0.3 and 1.8 V at a scan rate of 50 mV s−1 in 2.5 mM of N-acetyl-L-methionine (NALM) containing 0.1 M Phosphate Buffer Solution (PBS pH 7.2). After the electropolymerization, the modified electrode was rinsed thoroughly with distilled water. The N-acetyl-L-methionine modified electrode was denoted as poly-NALM/GCE. To optimise the concentration of N-acetyl-L-methionine monomer for polymerization, we prepared poly-NALM from different concentrations of NALM solution ranging from 0.5 mM to 4 mM concentration. The surface coverage was evaluated from the CV at 100 mV s−1. Based on the Fig. S1, the surface coverage increases with increasing NALM concentration in the range of 0.5–2.5 mM and starts to level off when the NALM concentration is higher than 2.5 mM. Therefore, 2.5 mM NALM concentration was selected as the optimum level in subsequent studies. Throughout the studies we have used 7 cycles to deposit the N-acetyl-L-methionine film because this preparation showed the highest sensitivity towards biomolecules.

3. Results and discussions

3.1. Electropolymerization of NALM on GCE

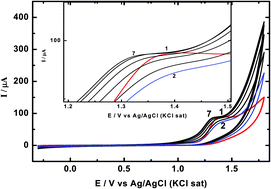
Fig. 1 shows a continuous cyclic voltammogram (CV) recorded during the electropolymerization of NALM on the surface of a GCE in phosphate buffer (pH 7.2) solution. In the first cycle, N-acetyl-L-methionine showed an irreversible electrochemical oxidation peak at a potential of 1.39 V. In the second cycle, the oxidation peak current was decreased and the potential of peak was slightly shifted to a less positive potential. From the third cycle onwards the oxidation peak current slowly increased up to seventh cycle. The increasing peak current suggests that the new monomer undergoes oxidation in each oxidation potential scan and the quantity of electroactive conducting polymer increases on the GCE. Based on Fig. 1, we propose the mechanism of electropolymerization of NALM shown in Scheme 1. The amine group of NALM was oxidized to form a free radical at the surface of the glassy carbon electrode. Then the reactive free radicals combine with the surface of the GCE rapidly, and subsequent oxidation of N-acetyl-L-methionine gives a poly-NALM film on the GCE surface. Fig. S2A displays the XPS of poly-NALM on ITO plate in C 1s and N 1s regions. The C 1s spectrum of poly-NALM was deconvoluted into three component peaks at 284.1, 285.8, 287.4 and 288.8 eV and were attributed to (–C–C–), (–C–S–), (–C–N–) and (–N–C[double bond, length as m-dash]O),38 respectively. Fig. S2B shows that the N 1s region of poly-NALM was deconvoluted into one component peak at 399.7 eV and it was associated with (–N–C–).39 The results obtained from CV and XPS support the proposed mechanism as given in Scheme 1.
image file: c6ra18440e-f1.tif
Fig. 1 Cyclic voltammograms (7 cycles) obtained for electropolymerization of NALM on GCE in 0.1 M phosphate buffer solution (pH 7.2) at a scan rate of 50 mV s−1. 1, 2 and 7 represent 1st, 2nd and 7th cycles.

image file: c6ra18440e-s1.tif
Scheme 1 Mechanism of electropolymerization of N-acetyl-L-methionine on GCE.

3.2. Surface morphology of the poly-NALM film

The surface morphology of the poly-NALM film was analysed by SEM and AFM. SEM images (Fig. S3A and B) and the AFM image (Fig. 2) showed the surface morphology of the poly-NALM film deposited by 7 cycles on an ITO electrode. The SEM images of the poly-NALM film showed a comparatively smooth and homogeneous surface. Similarly, the AFM image of the poly-NALM clearly indicates the formation of a homogeneous spherical like structure with increased real surface area. It is corroborated by the increased oxidation peak currents of AA, UA and nitrite at the poly-NALM/GC modified electrode.
image file: c6ra18440e-f2.tif
Fig. 2 AFM image of poly-NALM film.

3.3. Electrochemical impedance spectroscopy study

Electrochemical Impedance Spectroscopy (EIS) is an effective tool for studying resistivity changes of the electrode surface during the modification process. EIS contains both a semicircle part at high frequency and linear part at low frequency which correspond to an electron transfer limited process and diffusion process respectively. The diameter of the semicircle in the impedance spectrum is equal to charge transfer resistance, Rct. Fig. 3 shows the results of impedance spectra of a bare GCE (curve a) and poly-NALM/GCE (curve b). On the bare GCE, the value of Rct was obtained as 6960 Ω (curve a). After fabrication of poly-N-acetyl-L-methionine at the GCE surface, the value of Rct was obtained as 834 Ω (curve b). The decreased Rct value for poly-NALM/GCE shows that the conductive poly-NALM film has been attached to the GCE surface and it indicates that the electron transfer process of the modified electrode is relatively fast compared to the bare GCE.
image file: c6ra18440e-f3.tif
Fig. 3 Nyquist plots showing faradaic impedance measurements of bare GCE (a), poly-NALM/GCE (b) in 1 mM K3[Fe(CN)6]/K4[Fe(CN)6] (1[thin space (1/6-em)]:[thin space (1/6-em)]1) containing 0.1 M KCl.

3.4. Electrochemical properties of the poly-NALM/GCE

The CV obtained for poly-NALM deposited on a GCE over 7 cycles in 0.1 M H2SO4 at a scan rate of 20 mV s−1 is shown in Fig. 4A. It can be seen that the poly-NALM film on GCE shows a redox couple about 0.338/0.370 V at a low scan rate of 20 mV s−1. The observed peak separation potential, ΔEp = (EpaEpc) of 32 mV indicates that the redox couple of the poly-NALM film has a reversible behaviour which denotes the perfect Nernstian system. Based on the Nernst equation (ΔEp is close to 2.3RT/nF or 59/n mV at 25 °C),40 the number of electrons in the redox process is 2. The effect of potential scan rate (ν) on the electrochemical properties of the poly-NALM/GCE was studied by CV in 0.1 M H2SO4 solution at different scan rates (Fig. 4B). When the scan rate was increased from 50 to 1000 mV s−1, both the oxidation and reduction peak currents were linearly increased without any change of redox potential, which confirmed that the electrode reaction is a surface confined redox process and reversible redox reaction. Plots of anodic currents are linearly dependent on scan rate (ν) in the range from 50 to 1000 mV s−1 (Fig. 4B inset). The surface coverage was evaluated from the cyclic voltammogram recorded at 0.02 V s−1 and using the equation Γ = Q/nFA, where Q is the charge obtained by integrating the anodic peak current under the background correction, n is the number of electrons involved in the electron transfer process, F is the Faraday constant and A is the geometric area of the GC electrode (0.0707 cm2).41,42 The surface coverage of poly-NALM film on the glassy carbon electrode is 2.04 × 10⁻¹⁰ mol cm−2 indicating the formation of an ultrathin poly-NALM film on the GCE.
image file: c6ra18440e-f4.tif
Fig. 4 (A) Cyclic voltammogram of poly-NALM/GCE in 0.1 M H2SO4 at a scan rate of 20 mV s−1. (B) Cyclic voltammograms of poly-NALM/GCE in 0.1 M H2SO4 at scan rates of (a) 50, (b) 100, (c) 200, (d) 300, (e) 400, (f) 500, (g) 600, (h) 700, (i) 800, (j) 900, (k) 1000 mV s−1 in 0.1 M H2SO4. Inset: plot of anodic peak current vs. scan rate.

3.5. Single electrochemical oxidation of AA, UA and nitrite

The electrochemical behaviour of AA, UA and nitrite was investigated by cyclic voltammetry at the surface of bare GCE and poly-NALM/GCE. Fig. 5A shows the CV of 750 μM AA at bare GCE (curve a) and poly-NALM/GCE (curve b) in 0.1 M phosphate buffer solution (pH 7.2), respectively. As can be seen, the bare GC electrode showed a broad oxidation peak for AA at 310 mV (6.5 μA), which indicates that slow electron transfer kinetic. After electrode modification, the poly-NALM/GCE showed a well-defined oxidation peak for AA at 130 mV with an enhanced peak current (17.1 μA). Furthermore, a 180 mV less positive potential shift and a threefold higher oxidation current were obtained for AA at poly-NALM/GCE compared to the bare GC electrode. For 400 μM UA (in Fig. 5B), a sluggish oxidation peak potential of 440 mV (7.5 μA) was observed at the bare electrode, however a well-defined and sharp oxidation peak was obtained at 320 mV (14.2 μA) at poly-NALM/GC modified electrode. Moreover, a 120 mV less positive potential shift and two fold higher oxidation current were observed at the poly-NALM/GC electrode which indicates that the modified electrode shows a high electron transfer rate. In a similar way (in Fig. 5C), for 500 μM nitrite, the oxidation peak potential of 1090 mV (13.7 μA) was observed at the bare GC electrode but a clearly defined oxidation peak potential of 870 mV (25.1 μA) at the poly-NALM/GCE with 220 mV less positive potential and approximately two fold higher oxidation current were observed. These significant increases in current responses and shifting to a less positive potential at the poly-NALM modified electrode confirms that the modified electrode facilitates the electrochemical oxidation and thus decreases the over potential of the analytes.
image file: c6ra18440e-f5.tif
Fig. 5 Cyclic voltammogram of 750 μM AA (A), 400 μM UA (B) and 500 μM nitrite (C) at a bare GCE (a) and a poly-NALM/GCE (b) in phosphate buffer solution (pH 7.2). Scan rate 50 mV s−1.

3.6. Influence of the solution pH value

The pH value of buffer solution significantly influences the oxidation peak current and peak potential of AA, UA and nitrite ion at poly-NALM/GC electrode. The effect of pH value of the solution on peak current and peak potential has been studied by recording the CVs of AA, UA and nitrite ion at concentrations of 750 μM, 400 μM and 500 μM, respectively, in a series of PB solutions of varying pH in the range 4.2–9.2. The plot of the peak currents versus varying pH for AA, UA and nitrite ion are shown in Fig. 6A. As can be seen, the peak currents of these three compounds increase with the pH value from 4.2 to 7.2 and reach a maximum at pH 7.2, and then they decrease gradually when the pH values were increased. Thus pH 7.2 was selected as the optimum pH for the determination of these three compounds. It can be seen from Fig. 6B that the oxidation peak potentials of AA, UA and nitrite ion shift negatively with a gradual increase of the pH value. The slopes of the curve Ep versus pH were obtained as −0.061 V, −0.063 V and −0.059 V for AA, UA and nitrite, respectively. The obtained slopes are close to the theoretical value of 0.059 V pH−1 and suggest that the same protons and electrons are involved in the electrode reaction.37
image file: c6ra18440e-f6.tif
Fig. 6 Effect of pH on peak current (A) and peak potential (B) for the oxidation of 750 μM AA, 400 μM UA and 500 μM nitrite at the poly-NALM/GC modified electrode.

3.7. The effect of scan rate on the electrochemical oxidation of AA, UA and nitrite ion

The influence of scan rate on the electrochemical behaviour of AA, UA and nitrite ions at the poly-NALM/GC modified electrode was studied by CV. As shown in Fig. 7, the anodic peak currents of AA, UA and nitrite increase linearly with the square root of scan rate in the range of 50–1000 mV s−1, 50–1000 mV s−1 and 50–800 mV s−1, respectively. The linear equations for AA, UA and nitrite ion are ipa = 3.073ν1/2 − 2.004, ipa = 2.1964ν1/2 − 8.969 and ipa = 2.806ν1/2 − 4.794 with correlation coefficients of 0.9974, 0.9992 and 0.9989, respectively. These results indicate that the electrode reactions of these three analytes at the poly-NALM/GC modified electrode are diffusion controlled processes.1,28
image file: c6ra18440e-f7.tif
Fig. 7 CVs of 750 μM AA (A), 400 μM UA (B) and 500 μM nitrite (C) at poly-NALM/GCE in 0.1 M PBS pH 7.2, under various scan rates. Scan rates for AA and UA (from inner to outer) are 50, 100, 200, 300, 400, 500, 600, 700, 800, 900 and 1000 mV s−1. Scan rates for nitrite (from inner to outer) are 50, 100, 200, 300, 400, 500, 600, 700 and 800 mV s−1. The insets in (A)–(C) are plots of peak currents vs. square root of the scan rates.

3.8. Electrochemical behaviour of AA, UA and nitrite in a mixture at poly-NALM/GCE

Fig. 8 displays the CVs of 750 μM of AA, 500 μM of UA and 500 μM of nitrite in phosphate buffer solution (pH 7.2) at bare GC and poly-NALM/GC electrodes. The bare electrode showed the oxidation potential of AA and UA at 440 mV and nitrite at 1100 mV which means that the oxidation peaks of AA and UA completely merged and the peak potentials for AA and UA are indistinguishable (curve a). This reveals that it was not possible to determine AA, UA and nitrite simultaneously at the bare GCE. Further, in the subsequent cycles a decrease of the peak currents was observed for AA, UA and nitrite (curve b). This revealed that the bare GC electrode is not suitable for stable detection. In contrast to the bare GC electrode, poly-NALM/GCE oxidizes AA, UA and nitrite at 170 mV, 330 mV and 920 mV respectively with enhanced current response in the mixture (curve c). Further the oxidation peaks of AA, UA and nitrite were more stable at poly-NALM/GCE in the subsequent cycles (curve d). The separation of the oxidation peak potential for AA–UA and UA–nitrite were of 160 mV and 590 mV respectively. The separations were good enough for simultaneous determination of AA, UA and nitrite. This indicated that the oxidation of AA, UA and nitrite at poly-NALM/GCE is independent and therefore simultaneous measurements of these three analytes are possible without any interference. Curve e is the CV of the modified electrode in the absence of analytes.
image file: c6ra18440e-f8.tif
Fig. 8 Cyclic voltammograms of 750 μM AA, 500 μM UA and 500 μM nitrite at the bare GCE. (a) After the 10th cycle (b) and at the poly-NALM/GCE (c) after the 10th cycle (d) in phosphate buffer solution (pH 7.2). Scan rate 50 mV s−1. (e) CV obtained for poly-NALM/GCE in the absence of AA, UA and nitrite in 0.1 M phosphate buffer solution.

3.9. Simultaneous determinations of AA, UA and nitrite

The main objective of this study is to determine AA, UA and nitrite simultaneously using poly-NALM/GCE. Fig. 9A shows the DPVs obtained for the simultaneous determination of AA, UA and nitrite at poly-NALM/GCE in 0.1 M phosphate buffer solution (pH 7.2). It shows the oxidation peak for 10 μM AA at 40 mV, 1 μM UA at 260 mV and 1 μM nitrite at 770 mV. We investigated the current response of AA, UA and nitrite at poly-NALM/GCE while simultaneously incrementing the concentration of AA, UA and nitrite. It showed that the oxidation current of AA, UA and nitrite were linearly increased when simultaneously increasing their concentrations without any shift in the oxidation potential. The linear relationships between peak currents ipa (μA) and concentrations c (μM) of AA, UA and nitrite are: ipa, AA = 1.154 + 0.0103cAA (r = 0.990), ipa, UA = 1.818 + 0.036cUA (r = 0.996), and ipa, nitrite = 1.382 + 0.0218cnitrite (r = 0.994) respectively (Fig. 9B–D). The linear concentration ranges of AA, UA and nitrite in simultaneous determinations are 10–1000 μM, 1–600 μM and 1–500 μM respectively. The detection limits of AA, UA and nitrite are found to be 0.97, 0.34 and 0.75 μM (S/N = 3), respectively. The performance of the fabricated AA, UA and nitrite sensors are very much comparable to the literature values (Table 1).1,2,43–48 It is evident from Table 1 that the newly designed poly-NALM modified electrode exhibited a relatively low detection limit, high sensitivity and wide linear range. The superiority of the present sensor can be attributed to that fact that the high electrical conductivity and electroactive functional groups of the polymers.
image file: c6ra18440e-f9.tif
Fig. 9 (A) Differential pulse voltammograms for the simultaneous increase of (I) (a) 10, (b) 20, (c) 40, (d) 60, (e) 100, (f) 150, (g) 200, (h) 300, (i) 400, (j) 600, (k) 800, (l) 1000 μM of AA, (II) (a) 10, (b) 25, (c) 50, (d) 100, (e) 150, (f) 200, (g) 250, (h) 300, (i) 350, (j) 400, (k) 500, (l) 600 μM of UA and (III) (a) 1, (b) 5, (c) 25, (d) 50, (e) 75, (f) 100, (g) 150, (h) 200, (i) 250, (j) 300, (k) 400, (l) 500 μM of nitrite at a poly-NALM/GCE in phosphate buffer solution (pH 7.2). (B) Plot of concentration of AA vs. current. (C) Plot of concentration of UA vs. current. (D) Plot of concentration of nitrite vs. current.
Table 1 Comparison of some modified electrodes in the determination of AA, UA and NO2
Electrode Linear range (μM) Detection limit (μM) Reference
AA UA NO2 AA UA NO2
Nano-Au/p-TA/GCE 2.1–50 1.6–110 15.9–277 1.1 0.08 0.89 43
MWNTs/MGF 100–6000 5–100 18.28 0.93 44
Fe(III)TPyP-Ba/GCE 5–330 0.4–25 1–250 0.9 0.06 0.5 45
Activated GCE 25–300 5–70 23.38 4.70 46
Au/RGO/GCE 200.4–1500 8.8–50.3 50.1 1.8 47
La/MWCNT/GCE 0.4–71 0.04–81 0.4–71 0.14 0.015 0.013 1
PAPT/GCE 2–1000 2–1200 0.35 0.6 48
CTAB-GO/MWNT/GCE 5–300 3–600 5–800 1 1 1.5 2
Poly-NALM/GC 10–1000 1–600 1–500 0.97 0.34 0.75 This work


3.10. Selective determination of AA, UA and nitrite

The other objective of this work is the selective determination of one compound in the presence of higher concentrations of the other compounds. It is well known that AA, UA and nitrite coexist in human fluids. Therefore it is necessary to selectively determine each compound. Fig. 10A–C shows the selective determination of AA, UA and nitrite at poly-NALM/GCE in 0.1 M phosphate buffer solution (pH 7.2). Fig. 10A shows the DPVs for consecutive increments of 10 μM AA in the presence of 250 μM each of UA and nitrite. Higher concentrations of UA and nitrite did not affect the oxidation peak current and peak potential of AA. The electro-oxidation of AA, UA and nitrite on poly-NALM is represented in Scheme 2. The oxidation peak current of AA linearly increased with increasing concentration. Likewise, Fig. 10B and C show the linear increase of oxidation currents of UA and nitrite when the concentration of the other two compounds are high and constant. The oxidation currents of AA, UA and nitrite were linearly increased with correlation coefficients of 0.9997, 0.9996 and 0.9965, respectively. These results proved that the selective and sensitive determination of AA, UA and nitrite is possible at a poly-NALM/GC electrode.
image file: c6ra18440e-f10.tif
Fig. 10 DPVs obtained at poly-NALM/GCE for (A) each addition increases the concentration of AA by 10 μM from 0 to 130 μM in the presence of 250 μM of each UA and nitrite, (B) each addition increases the concentration of UA by 5 μM from 0 to 65 μM in the presence of 500 μM AA and 250 μM of nitrite and (C) each addition increases the concentration of nitrite by 10 μM from 0 to 130 μM in the presence of 500 μM AA 250 μM of UA. Inset: in (A)–(C) is plot of oxidation current vs. concentration of AA, UA and nitrite respectively.

image file: c6ra18440e-s2.tif
Scheme 2 Electrochemical oxidation of AA, UA and nitrite on poly-NALM/GCE.

3.11. Anti-interference of the poly-NALM film

The anti-interference ability of poly-NALM/GCE was investigated towards the detection of AA, UA and nitrite in the presence of commonly existing ions Na+, K+, NH4+, Mg2+, Ca2+, Cl, F, CO32− and SO42− and some physiological interferents such as glucose, citric acid, cysteine and oxalate by the DPV method. No change in current and shifting of potential were observed for 30 μM AA, 10 μM UA and 10 μM nitrite in the presence of a 500-fold excess of the above mentioned species, indicating that the present modified electrode was not affected by maximum concentrations of foreign substances and is highly selective towards the AA, UA and nitrite. Moreover, dopamine, epinephrine, serotonin and tyrosine had very small influences on the determination of AA and UA which is shown in Table S4.

3.12. Repeatability and reproducibility of the poly-NALM film

To validate the performance of the poly-NALM/GC electrode on biosensing, repeatability and reproducibility are very significant parameters. To check the repeatability of the modified electrode, the DPVs were recorded for 50 μM AA, 20 μM and 20 μM nitrite in 0.1 M phosphate buffer solution (pH 7.2). It was found that the oxidation peak currents of AA, UA and nitrite remain with relative standard deviations of 2.1%, 1.8% and 2.4% respectively for 20 repetitive measurements, indicating that this modified electrode has good stability on repetitious measurements. The modified electrode was stored in 0.1 M phosphate buffer solution at 4 °C in a refrigerator. After ten days, the current responses were decreased by 4%, 2.5% and 3.3% for AA, UA and nitrite respectively. In addition, to verify the reproducibility of the results, three different poly-NALM/GC electrodes were prepared and responses toward the AA, UA and nitrite recorded. The peak current showed relative standard deviations of 2.4%, 2.4% and 3.1% for AA, UA and nitrite respectively, confirming that the results are reproducible.

3.13. Real sample analysis

To assess the practical applicability of this research work for the simultaneous determination of AA, UA and nitrite in real samples, human urine and tap water were selected for analysis using standard addition technique. For the pretreatment of human urine, the urine sample was centrifuged and the obtained supernatant was diluted 100 times with 0.1 M phosphate buffer solution (pH 7.2). The tap water sample was used as such. No AA or nitrite has been detected in male urine which was in line with reported literature49 and uric acid concentration is very close to the literature.46,50 The results are summarized in Table 2, which indicates that the recoveries of the spiked samples were in the range of 97–106%. Therefore, the real sample analysis, showed that the successful applicability of the this work for simultaneous determination of AA, UA and nitrite.
Table 2 Determination results of AA, UA and nitrite in real samples (n = 6)
Sample Detected (μM) Added (μM) Found (μM) Recovery (%)
Urine 1
AA 0 40.0 40.9 102.2
UA 6.3 20.0 26.0 98.9
Nitrite 0 20.0 19.1 95.5
[thin space (1/6-em)]
Urine 2
AA 0 30.0 28.8 96
UA 9.2 30.0 40.6 103.6
Nitrite 0 10.0 9.8 98
[thin space (1/6-em)]
Tap water
AA 0 20.0 19.3 96.5
UA 0 20.0 19.7 98.5
Nitrite 5.4 10.0 15.4 100


4. Conclusions

A fast and simple procedure was adopted for the fabrication of a poly-NALM/GC modified electrode for the electrochemical detection of AA, UA and nitrite simultaneously. The modified electrode exhibited good electrocatalytic activity towards the oxidation of AA, UA and nitrite. Further, this modified electrode not only enhanced the electrochemical catalytic oxidation of AA, UA and nitrite also resolved the overlapping of anodic oxidation peaks. The separation of the oxidation peak potentials for AA–UA and UA–nitrite were of 160 and 590 mV, respectively, and demonstrated that the electrode could be used to detect AA, UA and nitrite simultaneously and selectively. Furthermore, this modified electrode showed good stability, high reproducibility and low detection limit. In addition, this modified electrode was employed for the simultaneous determination of AA, UA and nitrite in real samples with satisfactory results.

Acknowledgements

Financial support from the University Grants Commission – South Eastern Regional Office (UGC – SERO), Hyderabad, for the award of Minor Research Project (No. F MRP-5855/15) (SERO-UGC) is gratefully acknowledged by AK. AK, GK and RS would like to thank The Management and The Principal, Vivekananda College, Tiruvedakam West to carry out this work. AK, GK and RS thank Dr P. Veluchamy, Senior Consultant Engineer, First solar, USA for donating CHI Electrochemical workstation to our institution.

References

  1. W. Zhang, R. Yuan, Y.-Q. Chai, Y. Zhang and S.-H. Chen, Sens. Actuators, B, 2012, 166–167, 601–607 CrossRef CAS .
  2. Y. J. Yang and W. Li, Biosens. Bioelectron., 2014, 56, 300–306 CrossRef CAS PubMed .
  3. N. V. Bhagavan, Medical Biochemistry, Elsevier, Amsterdam, 4th edn, 2001 Search PubMed .
  4. R. F. Cathcart, Med. Hypotheses, 1991, 35, 32–37 CrossRef CAS PubMed .
  5. A. M. Pisoschi, A. Pop, A. I. Serban and C. Fafaneata, Electrochim. Acta, 2014, 121, 443–460 CrossRef CAS .
  6. D. Lakshmi, M. J. Whitcombe, F. Davis, P. S. Sharma and B. B. Prasad, Electroanalysis, 2011, 23, 305–320 CrossRef CAS .
  7. P. Gai, H. Zhang, Y. Zhang, W. Liu, G. Zhu, X. Zhang and J. Chen, J. Mater. Chem. B, 2013, 1, 2742–2749 RSC .
  8. I. Grabowska, M. Chudy, A. Dybko and Z. Brzozka, Sens. Actuators, B, 2008, 130, 508–513 CrossRef CAS .
  9. L. Tian, B. Zhang, D. Sun, R. Chen, B. Wang and T. Li, Microchim. Acta, 2014, 181, 589–595 CrossRef CAS .
  10. G. M. McKnight, C. W. Duncan, C. Leifert and M. H. Golden, Br. J. Nutr., 1999, 81, 349–358 CrossRef CAS PubMed .
  11. B. M. Thomson, C. J. Nokes and P. J. Cressey, Food Addit. Contam., 2007, 24, 113–121 CrossRef CAS PubMed .
  12. A. Cockburn, G. Brambilla, M. L. Fernández, D. Arcella, L. R. Bordajandi, B. Cottrill, C. van Peteghem and J. L. Dorne, Toxicol. Appl. Pharmacol., 2013, 270, 209–217 CrossRef CAS PubMed .
  13. B. Unnikrishnan, P. L. Ru, S. M. Chen and V. Mani, Sens. Actuators, B, 2013, 177, 887–892 CrossRef CAS .
  14. D. W. Kimmel, G. LeBlanc, M. E. Meschievitz and D. E. Cliffel, Anal. Chem., 2012, 84, 685 CrossRef CAS PubMed .
  15. H. R. Zare, N. Nasirizadeh and M. M. Ardakani, J. Electroanal. Chem., 2005, 577, 25–33 CrossRef CAS .
  16. S. Mahshid, C. Li, S. S. Mahshid, M. Askari, A. Dolati, L. Yang, S. Luo and Q. Cai, Analyst, 2011, 136, 2322–2329 RSC .
  17. C. R. Raj, K. Tokuda and T. Ohsaka, Bioelectrochemistry, 2001, 53, 183–191 CrossRef CAS PubMed .
  18. M. Shamsipur, M. Asgari, M. G. Maragheh and D. Matt, Sens. Actuators, B, 2015, 209, 9–14 CrossRef CAS .
  19. M. A. Raj and S. A. John, J. Phys. Chem. C, 2013, 117, 4326–4335 CAS .
  20. C. Retna Raj and T. Ohsaka, J. Electroanal. Chem., 2003, 540, 69–77 CrossRef CAS .
  21. M. Ates, Mater. Sci. Eng., C, 2013, 33, 1853–1859 CrossRef CAS PubMed .
  22. V. S. Vasantha and S. M. Chen, J. Electroanal. Chem., 2006, 592, 77–87 CrossRef CAS .
  23. C. Mousty, Appl. Clay Sci., 2004, 27, 159–177 CrossRef CAS .
  24. J. M. Zen and A. S. Kumar, Anal. Chem., 2004, 76, 205A–211A CAS .
  25. J. B. Raoof, R. Ojani and M. Baghayeri, Anal. Methods, 2011, 3, 2367–2373 RSC .
  26. C. F. Tang, S. A. Kumar and S. M. Chen, Anal. Biochem., 2008, 380, 174–183 CrossRef CAS PubMed .
  27. S. S. Kumar, J. Mathiyarasu and K. L. Phani, J. Electroanal. Chem., 2005, 578, 95–103 CrossRef CAS .
  28. L. Zhang and X. E. Jiang, J. Electroanal. Chem., 2005, 583, 292–299 CrossRef CAS .
  29. G. Z. Hu, Y. G. Ma, Y. Guo and S. J. Shao, Electrochim. Acta, 2008, 53, 6610–6615 CrossRef CAS .
  30. Q. W. Li, Y. M. Wang and G. A. Luo, Mater. Sci. Eng., C, 2000, 11, 71–74 CrossRef .
  31. Y. Zhang and R. Yuan, Biosens. Bioelectron., 2011, 26, 3977–3980 CrossRef CAS PubMed .
  32. Y. F. Zhao, Y. Q. Gao, D. P. Zhan, H. Liu, Q. Zhao, Y. Kou, Y. Shao, M. Li, Q. Zhung and Z. Zhu, Talanta, 2005, 66, 51–57 CrossRef CAS PubMed .
  33. S. Cosnier, Anal. Bioanal. Chem., 2003, 377, 507–520 CrossRef CAS PubMed .
  34. A. M. Yu and H. Y. Chen, Anal. Chim. Acta, 1997, 344, 181–185 CrossRef CAS .
  35. S. Chitravathi, B. E. Kumara Swamy, G. P. Mamatha and B. S. Sherigara, J. Mol. Liq., 2011, 160, 193–199 CrossRef CAS .
  36. W. Ma and D. M. Sun, Russ. J. Electrochem., 2007, 43, 1382–1389 CrossRef CAS .
  37. R. Ojani, A. Alinezhad and Z. Abedi, Sens. Actuators, B, 2013, 188, 621–630 CrossRef CAS .
  38. D. M. Eby, K. Artyushkova, A. K. Paravastu and G. R. Johnson, J. Mater. Chem., 2012, 22, 9875–9883 RSC .
  39. R. A. Brizzolara, Surf. Sci. Spectra, 1996, 4, 96–101 CrossRef CAS .
  40. E. Sabatani, J. Cohen-Boulakia, M. Bruening and I. Rubinstein, Langmuir, 1993, 9, 2974–2981 CrossRef CAS .
  41. E. Laviron, J. Electroanal. Chem., 1979, 101, 19–28 CrossRef CAS .
  42. S. Thiagarajan, R. F. Yang and S. M. Chen, Bioelectrochemistry, 2009, 75, 163–169 CrossRef CAS PubMed .
  43. C. Wang, R. Yuan, Y. Chai, Y. Zhang, F. Hu and M. Zhang, Biosens. Bioelectron., 2011, 30, 315–319 CrossRef CAS PubMed .
  44. H. Li, Y. Wang, D. Ye, J. Luo, B. Su, S. Zhang and J. Kong, Talanta, 2014, 127, 256–261 Search PubMed .
  45. J. C. Kemmegne-Mbouguen and L. Angnes, Sens. Actuators, B, 2015, 212, 464–471 CrossRef CAS .
  46. Z. Temocin, Sens. Actuators, B, 2013, 176, 796–802 CrossRef CAS .
  47. C. Wang, J. Du, H. Wang, C. Zou, F. Jiang, P. Yang and Y. Du, Sens. Actuators, B, 2014, 204, 302–309 CrossRef CAS .
  48. L. Zhang and L. Wang, J. Solid State Electrochem., 2013, 3, 691–700 CrossRef .
  49. A. A. Ensafi, M. Taei and T. Khayamian, J. Electroanal. Chem., 2009, 633, 212–220 CrossRef CAS .
  50. R. Zhang, G. D. Jin, D. Chen and X. Y. Hu, Sens. Actuators, B, 2009, 138, 174–181 CrossRef CAS .

Footnote

Electronic supplementary information (ESI) available. See DOI: 10.1039/c6ra18440e

This journal is © The Royal Society of Chemistry 2016
Click here to see how this site uses Cookies. View our privacy policy here.