Direct hydroxylation of benzene to phenol using H2O2 as an oxidant over vanadium-containing nitrogen doped mesoporous carbon catalysts

Liya Hu, Cheng Wang, Bin Yue*, Xueying Chen and Heyong He*
Department of Chemistry and Shanghai Key Laboratory of Molecular Catalysis and Innovative Materials, Collaborative Innovation Center of Chemistry for Energy Materials, Fudan University, Shanghai 200433, China. E-mail: yuebin@fudan.edu.cn; heyonghe@fudan.edu.cn; Tel: +86 21 65643916

Received 16th July 2016 , Accepted 3rd September 2016

First published on 5th September 2016


Abstract

Highly ordered nitrogen doped mesoporous carbon (NC) was synthesized via a hard template method using hexamethylenetetramine as the precursor and KIT-6 as the template. The NC materials calcined at different temperatures were used as supports to prepare a series of vanadium containing catalysts by the impregnation method. The integration of the highly ordered three-dimensional (3D) mesostructure, the hydrophobic surface with an open π-conjugated system, the abundant defects introduced by nitrogen related functionalities, and the highly dispersed vanadium species made the catalysts highly efficient in the benzene hydroxylation reaction using H2O2 as an oxidant. By optimizing the preparation and reaction conditions, a maximum benzene conversion of 31.0% and a phenol selectivity of 97.2% were obtained over a 4.2V/NC-600 catalyst, which was superior to the activity of the vanadium supported two-dimensional (2D) hexagonal mesoporous carbon with an amorphous framework.

Introduction

As an important intermediate in the synthesis of phenol resins, dyes and medicine, phenol is mainly produced by the three-step cumene process in industry.1 However, this process suffers from a low one-pass yield of phenol, a low atomic efficiency and an equimolar amount of acetone byproduct.2,3 Alternatively, the direct hydroxylation of benzene to phenol under mild conditions is attractive. Considering the difficulty in the activation of benzene C–H bonds and the higher reactivity of phenol than that of benzene, the conversion of benzene to phenol with high efficiency is still a challenge, which prompts the exploration of excellent and economical catalysts for the titled reaction.

Recently, graphite-like carbon materials (such as graphene, graphene oxide and graphitic carbon nitride) have been widely used as promising materials in the benzene-involved reactions, including the Friedel–Crafts reactions,4,5 the CO2-based benzene oxidation,6 and the hydroxylation of benzene to phenol.7–9 Their fascinating catalytic activity is mainly attributed to the intrinsic physicochemical properties of the supports. The π-conjugated system of graphite-like supports may promote the benzene adsorption and activation, efficiently facilitating the catalytic activity.5,10 Moreover, defects at the edge and curvature, and doped atoms that favor the electron re-localization and the formation of active oxygen species may play an important role in the activation of reactants.5,8,11 Our previous work revealed that both the hydrophobicity and the open π-conjugated system of the support surface were beneficial to the benzene adsorption and activation.9,12 Based on the above knowledge, to design an efficient catalyst that combines a π-conjugated hydrophobic surface, a high surface area with abundant catalytic defects and an ordered 3D mesostructure to maximize the reactants diffusion is the anticipated target.

Graphitic carbon nitride (g-C3N4), as an analogue of graphite, possesses stacked π-conjugated planar layers of nitrogen-bridged tri-s-triazine and can be simply prepared by pyrolysis of nitrogen-rich precursors such as urea, cyanamide, dicyandiamide, and melamine.13,14 However, a perfect infinite g-C3N4 sheet lacks efficient defects, which disfavors its catalytic performance. Instead, nitrogen doped graphitic carbon materials, similar with g-C3N4 except for more abundant defects, are more suitable in view of catalysis. The incorporation of nitrogen atoms into carbon materials can be obtained either by post-treatment of carbons or by direct pyrolysis of the nitrogen-containing precursors.15,16 The former method is generally subjected to a nitrogen-containing atmosphere, mainly NH3 at high temperature,17,18 which is uncontrollable in dispersion of nitrogen atoms. In contrast, the latter one is a more advisable way to realize a homogeneous incorporation of nitrogen atoms. Furthermore, to fabricate ordered mesoporous nitrogen doped carbon materials, a general approach is via the hard template method using mesoporous silica template such as SBA-15,19 KIT-6,20 MCF (mesocellular siliceous foam),21 etc.

Herein, the ordered NC was synthesized by an in situ doping method using the low-toxic hexamethylenetetramine (HMTA) as the precursor and KIT-6 as the hard template. Since the pristine NC had limited catalytic activity in the benzene hydroxylation reaction, vanadium species, which exhibited remarkable catalytic performance and high stability according to our previous work,9,12,22,23 were introduced into the NC materials by the impregnation method. A series of NC supports calcined at different temperatures were synthesized to investigate the influence of NC structure and surface properties on the catalytic activity of benzene hydroxylation using H2O2 as an oxidant. Also, the NC supporting catalysts were compared with the vanadium supported 2D hexagonal mesoporous carbon with amorphous framework, further revealing the superior properties of the NC support.

Experimental

Preparation of the NC materials

The mesoporous KIT-6 was synthesized following the literature method.24 In a typical synthesis, 4.0 g of pluronic P123 was dissolved in 144 g of H2O and 6.4 mL of concentrated HCl (37 wt%) with stirring at 35 °C for 4 h. Then 4.0 g of butanol was added and the mixture was stirred for another 1 h before the addition of 8.6 g of tetraethyl orthosilicate. The mixture was further stirred at 35 °C for 24 h, and subsequently aged at 100 °C for another 24 h under static condition in a closed polypropylene bottle. The obtained white product was filtered, washed and dried at 60 °C overnight. Finally, the product was calcined in air with a heating rate of 1 °C min−1 from room temperature to 550 °C and then kept at 550 °C for 5 h.

The obtained KIT-6 was then used as a template in the synthesis of NC materials according to the reported method except for some modifications.21 In a typical synthesis, 0.5 g of KIT-6 was dispersed in 18.0 g of 44.4 wt% HMTA aqueous solution and the mixture was stirred at room temperature for 5 h, followed by heating at 60 °C to remove water. The obtained white powder was calcined in air at different temperatures (400, 500, 600, and 700 °C) for 2 h, wherein the calcination started from room temperature with a heating rate of 2 °C min−1. Then the obtained dark powder was immersed into 17.1 g of 16.6 wt% HF aqueous solution at room temperature for 24 h to remove the siliceous template. The product was collected by centrifugation and washed with water thoroughly. After drying at 120 °C, the final product was obtained and denoted as NC-y, where y represented the calcination temperature.

For comparison, a 2D hexagonal mesoporous carbon (C-hexa) was also synthesized via the self-assembly of pluronic F127 and phenolic resol.23 Typically, 1.0 g of F127 and 14.0 g of ethanol were stirred at 50 °C for 30 min to form a clear solution. Then 6.0 g of resol precursor solution (20 wt% in ethanol) was added and the mixture was stirred for another 1 h before poured into a Petri dish. After evaporating ethanol at room temperature for 6 h, heating at 120 °C for 24 h, the product was calcined under N2 atmosphere with a heating rate of 1 °C min−1 from room temperature to 600 °C and then kept at 600 °C for 3 h to obtain the final C-hexa.

Preparation of the V/NC materials

0.3 g of NC-y was dispersed in 30 mL of NH4VO3 aqueous solution containing different NH4VO3 amount (0.01, 0.02, 0.03, and 0.04 g) and the mixture was stirred at room temperature for 24 h. The solvent was then removed by rotary evaporation. The obtained powder was dried at 60 °C, calcined under N2 atmosphere from room temperature to 300 °C with a heating rate of 2 °C min−1 and kept at 300 °C for another 2 h. The final catalyst was denoted as xV/NC-y, where x represented the weight percentage of vanadium loading (1.4, 2.8, 4.2, and 5.6 wt%). For comparison, the same method was used to synthesize the 4.2V/C-hexa catalyst.

Benzene hydroxylation reaction

The hydroxylation of benzene to phenol over various catalysts was carried out as follows. Typically, 0.02 g of catalyst, 0.4 mL of benzene, and 5 mL of 80 wt% acetic acid were added in a 25 mL of three-necked round bottle flask connected with a reflux condenser. The mixture was stirred at 70 °C for 30 min before the dropwise addition of 1.4 mL of 30 wt% H2O2. After reaction for another 3 h, the catalyst was separated by centrifugation and the obtained liquid was analyzed by a GC9560 gas chromatography (GC, Shanghai Hua-Ai Chromatography Analysis Co. Ltd.) equipped with a HP-5 capillary column. The products were confirmed by the retention time of the standard samples. The quantitative analysis of the products was determined by the calibration curves and using toluene as the internal standard. Under the present conditions, except for small amount of hydroquinone and catechol, no other byproducts such as benzoquinone, biphenyl, and oligomer were detected by GC. The conversion of benzene, the selectivity of phenol, and the yield of phenol were calculated as the molar ratio of the converted benzene to its initial one, the formed phenol to the converted benzene, and the formed phenol to the initial benzene, respectively.

Benzene and phenol adsorption tests

A certain amount of benzene (6.7, 7.9, 9.0, 10.1, and 11.2 mmol) or phenol (1, 2, 3, 4, and 5 mmol) and 80 wt% acetic acid were mixed to form a series of 10 mL of solution. Then 0.02 g of catalyst was added into each solution and the mixture was stirred at room temperature for 24 h. The initial and equilibrious concentrations of benzene or phenol were analyzed by GC.25

Catalyst characterization

The X-ray diffraction (XRD) patterns were recorded on a Bruker D8 Advances X-ray diffractometer using Cu-Kα radiation with a voltage of 40 kV and a current of 40 mA. N2 adsorption–desorption isotherms were obtained at −196 °C using a Micromeritics Tristar 3000 apparatus. The transmission electron microscopy (TEM) measurements were conducted on a FEI Tecnai G2 F20 S-TWIN electron microscope operated at 200 kV. Raman spectra were recorded on a LabRam-1B microscopic Raman spectrometer with a 532 nm laser excitation. The Fourier transform infrared (FT-IR) spectra were obtained on a Nicolet Nexus 470 infrared instrument using KBr discs. The X-ray photoelectron spectra (XPS) were recorded on a Perkin-Elmer PHI 5000C ESCA system equipped with a dual X-ray source by using Mg Kα (1253.6 eV) anode and a hemispherical energy analyzer. All binding energies were calibrated with contaminant carbon (C 1s = 284.6 eV) as a reference. Elemental analysis was performed on a Thermo Elemental IRIS Intrepid inductively coupled plasma atomic emission spectrometer (ICP-AES).

Results and discussion

Structural characterization

The small-angle XRD patterns of the 1.4V/NC-y catalysts (Fig. 1A) show two diffraction peaks with q values at around 0.82 and 0.94 nm−1, which can be indexed as (211) and (220) diffractions of the cubic Ia3d mesostructure, respectively, according to the q values ratio (about 0.87).24 Also, the peak intensities of the 1.4V/NC-400 catalyst are quite weak while they increase dramatically with increasing NC calcination temperature, implying the successful replication of KIT-6 mesostructure should take place at a calcination temperature higher than 400 °C. Moreover, the small-angle XRD pattern of 4.2V/NC-600 (Fig. 1A(e)) is quite similar to that of 1.4V/NC-600 (Fig. 1A(c)), revealing that the ordered mesostructure remains at high vanadium content. Additionally, 4.2V/C-hexa (Fig. 1A(f)) exhibits a strong diffraction peak and two weak peaks corresponding to (100), (110), and (200) diffractions of 2D hexagonal mesostructure, respectively.26 As for the wide-angle XRD patterns (Fig. 1B), all the xV/NC-y catalysts exhibit a broad peak at around 25.5° corresponding to an interlayer d spacing of 0.349 nm, which can be assigned to the characteristic (002) reflection of the interplanar stacking structure of graphitic materials.19,21 Also, the d spacing of the xV/NC-y catalysts is slightly bigger than that of the perfect g-C3N4 (0.326 nm),13 indicating that the turbostratic ordering of carbon and nitrogen atoms in the graphitic layer of the xV/NC-y catalysts.20,27 This disorder in the carbon layer may produce large defects or curvatures, which is beneficial to catalytic activity. The 4.2V/C-hexa catalyst exhibits a weak peak at around 23° together with a quite broad peak at about 43°, implying an amorphous carbon framework.28 In addition, no diffraction peak corresponding to any crystalline phase of vanadium species is observed in all the catalysts, which is attributed to the low crystallization degree and high dispersion of vanadium species as well as the low vanadium content (less than 5%, see below).
image file: c6ra18132e-f1.tif
Fig. 1 Small-angle (A) and wide-angle (B) XRD patterns of (a) 1.4V/NC-400, (b) 1.4V/NC-500, (c) 1.4V/NC-600, (d) 1.4V/NC-700, (e) 4.2V/NC-600, and (f) 4.2V/C-hexa.

To further testify the ordered mesostructure, two typical catalysts, 4.2V/NC-600 and 4.2V/C-hexa, were chosen and studied by TEM (Fig. 2). In the case of 4.2V/NC-600 (Fig. 2a–d), the order arrangement of mesopores, viewed from the [111], [311], and [531] directions, reveals the characteristic Ia3d structure with 3D bicontinuous framework replicated from the KIT-6 template. The 4.2V/C-hexa catalyst exhibits typical stripe-like and hexagonally arranged pores viewed from [110] and [100] directions respectively, confirming the hexagonal mesoporous structure. No distinct nanoparticles of vanadium species are observed in both 4.2V/NC-600 and 4.2V/C-hexa, attributing to the high dispersion and relatively low content of vanadium species.


image file: c6ra18132e-f2.tif
Fig. 2 TEM images of 4.2V/NC-600 (a–d) and 4.2V/C-hexa (e and f), viewed from the [111] (a), [311] (b), [531] (c and d), [110] (e), and [100] (f) directions. The insets are the corresponding FFT diffractograms.

N2 adsorption–desorption isotherms of xV/NC-y and 4.2V/C-hexa catalysts are shown in Fig. 3A. Except for 1.4V/NC-400, all the catalysts show representative type IV isotherms with pronounced H2 hysteresis loops and distinct capillary condensation steps at relative pressures of 0.4–0.6, reflecting the typical mesoporous structures with uniform pore sizes. As for 1.4V/NC-400, a type IV isotherm with negligible hysteresis loop is observed, implying the severe collapse of the mesostructure after removal of the template. The pore size distribution curves derived from the desorption branches using the BJH model are exhibited in Fig. 3B. No distinct peak can be observed in 1.4V/NC-400, while all other catalysts show one intense peak in the range of 3.3–3.6 nm. Also, the pore size increases gradually with the calcination temperature increasing from 500 to 700 °C, which is probably caused by the shrinkage of carbon framework at high calcination temperature. The BET surface areas and pore volumes of the 1.4V/NC-y catalysts, which are in the range of 5–636 m2 g−1 and 0.02–0.58 cm3 g−1, respectively, increase remarkably with the rise of the calcination temperature (Table 1), further confirming the formation of mesoporous framework. Moreover, it is worth noting that the BET surface area and pore volume of 4.2V/NC-hexa with 2D structure are much higher than those for 4.2V/NC-600 with 3D structure, which is due to the different mesoporous structure.


image file: c6ra18132e-f3.tif
Fig. 3 N2 adsorption–desorption isotherms (A) and pore size distribution curves (B) of (a) 1.4V/NC-400, (b) 1.4V/NC-500, (c) 1.4V/NC-600, (d) 1.4V/NC-700, (e) 4.2V/NC-600, and (f) 4.2V/C-hexa.
Table 1 Textural properties of various catalysts
Catalysts Va (wt%) SBET (m2 g−1) Vpore (cm3 g−1) Dporeb (nm)
a Vanadium content analyzed by ICP-AES.b Pore diameters derived from the desorption branches using the BJH method.
1.4V/NC-400 1.5 5 0.02
1.4V/NC-500 1.2 328 0.30 3.3
1.4V/NC-600 1.3 340 0.35 3.3
1.4V/NC-700 1.3 636 0.58 3.6
4.2V/NC-600 3.5 240 0.25 3.3
4.2V/C-hexa 3.3 593 0.40 3.6


Raman spectroscopy is a powerful tool to identify the structural features of carbon materials. The Raman spectra of all catalysts are illustrated in Fig. 4, showing two broad bands at around 1350 and 1580 cm−1 corresponding to D and G bands, respectively.29 In the case of 1.4V/NC-y, with the increase of calcination temperature from 400 to 700 °C, the D band shifts from 1353 to 1345 cm−1 and the G band shifts from 1575 to 1598 cm−1, which may be due to the variation of nitrogen species in the graphitic carbon matrix.19 Moreover, the G band related to the vibration mode of sp2 domains can be used to explain the degree of graphitization, while the D band is associated with structural defects and partially disordered structures of the sp2 domains.30,31 Therefore, the ID/IG ratio (area ratio of D to G band) is a sensitive measurement of the structure defects of graphitic carbon materials. A larger ID/IG ratio indicates more defects or amorphous carbon structure in graphitic materials. The ID/IG ratios of 1.4V/NC-400, -500, -600, and -700 are 1.1, 1.4, 1.4, and 1.5, respectively, implying the increase of the structure defects with the rise of the calcination temperature. As for 4.2V/NC-600, it shows a similar spectrum to that of 1.4V/NC-600, indicating that the surface properties of NC support retain during the variation of vanadium content. However, 4.2V/C-hexa exhibits a quite sharp G band with the ID/IG ratio of 1.6, implying more defects or amorphous carbon exist in the framework of 4.2V/C-hexa compared with those of xV/NC-y. An appropriate graphitization degree and suitable amount of defects may influence the benzene adsorption and activation, which is important to the benzene hydroxylation reaction.


image file: c6ra18132e-f4.tif
Fig. 4 Raman spectra of (a) 1.4V/NC-400, (b) 1.4V/NC-500, (c) 1.4V/NC-600, (d) 1.4V/NC-700, (e) 4.2V/NC-600, and (f) 4.2V/C-hexa.

The FT-IR spectra of the xV/NC-y catalysts are displayed in Fig. 5. The broad band at around 3412 cm−1 is attributed to the stretching mode of N–H groups in the aromatic rings.20,32 The multiple bands located in the range of 1200–1600 cm−1 are typical stretching mode of aromatic CN heterocycles, wherein the main bands at 1245 and 1570 cm−1 can be assigned to the aromatic C–N stretching and aromatic ring stretching modes, respectively.20,32,33 These results confirm that the xV/NC-y catalysts mainly consist of nitrogen doped aromatic carbon rings. Also, it is worth noting that the band at 3412 cm−1 becomes quite distinct in the case of 1.4V/NC-600, implying the notable increase of aromatic N–H groups at 600 °C. However, at higher calcination temperature, some aromatic N–H groups may suffer from further pyrolysis, leading to the decrease of the corresponding band intensity in 1.4V/NC-700. The band at 3412 cm−1 is less distinct in 4.2V/NC-600 than in 1.4V/NC-600, probably caused by the more interactions between vanadium species and N–H groups at higher vanadium content. For comparison, the FT-IR spectrum of 4.2V/C-hexa is also displayed (Fig. 5f). Three main bands centered at around 3400, 1602, and 1205 cm−1 are attributed to the stretching of phenolic –OH groups, the benzene ring stretching, and the C–O stretching of phenol, respectively.26,34 Also, the small bands at 2922 and 2866 cm−1 can be attributed to the C–H stretching of methyl and methylene groups arising from the phenolic resin.34 These results indicate that the framework of 4.2V/C-hexa is derived from the carbonized phenolic resins. Additionally, a small band at 980 cm−1 arising from the stretching of V[double bond, length as m-dash]O bonds in VOx species is detected in 4.2V/C-hexa,35 while it is not distinct in the case of 4.2V/NC-600, possibly implying the partial agglomeration of vanadium species due to the relatively lower dispersion degree in 4.2V/C-hexa.


image file: c6ra18132e-f5.tif
Fig. 5 FT-IR spectra of (a) 1.4V/NC-400, (b) 1.4V/NC-500, (c) 1.4V/NC-600, (d) 1.4V/NC-700, (e) 4.2V/NC-600, and (f) 4.2V/C-hexa.

XPS measurement is conducted to further investigate the surface chemical properties of various catalysts, especially the N and V chemical states. However, in the case of 1.4V/NC-y, only N 1s spectra are able to be investigated since the V signals are quite weak due to the low vanadium content. As shown in Fig. 6, the N 1s spectra of the 1.4V/NC-y catalysts can be deconvoluted into three peaks around 397.8, 399.7, and 401.7 eV, corresponding to pyridinic N, pyrrolic N, and graphitic N, respectively.20,36,37 To further elucidate the variation of N species with the change of the calcination temperature, the relative integrated intensities of various N species are calculated and listed in Table 2. With the increase of the calcination temperature, a remarkable decrease of pyridinic N content is observed, accompanied by the increase of the graphitic N content. As for the pyrrolic N content, it increases gradually with a pyrolysis temperature from 400 to 600 °C, while a notable decrease is observed with a further temperature increase up to 700 °C. This is consistent with the qualitative observation in FT-IR results, where the relative intensity of aromatic N–H groups reaches maximum at the calcination temperature of 600 °C.


image file: c6ra18132e-f6.tif
Fig. 6 N 1s XPS spectra of (a) 1.4V/NC-400, (b) 1.4V/NC-500, (c) 1.4V/NC-600, and (d) 1.4V/NC-700.
Table 2 N content from XPS and the relative integrated intensities of the deconvoluted N 1s peaks of the 1.4V/NC-y catalysts
Catalysts Na (wt%) Pyridinic Nb (%) Pyrrolic Nb (%) Graphitic Nb (%)
a N content based on XPS.b Percentage of various N species occupied in the total N content.
1.4V/NC-400 5.2 68.9 23.0 8.1
1.4V/NC-500 5.7 60.4 27.7 11.9
1.4V/NC-600 6.1 54.1 30.7 15.2
1.4V/NC-700 6.1 50.6 20.5 28.9


As shown in the XPS survey spectra of 4.2V/NC-600 and 4.2V/C-hexa (Fig. 7A), 4.2V/NC-600 mainly consists of C, N, and O elements, while no N signal is observed in the case of 4.2V/C-hexa. Also, a small amount of V species is detected in both catalysts and the deconvolution of V 2p3/2 peaks is conducted thusly to explore the detailed chemical states of V species. As shown in Fig. 7B, two kinds of V species exist in both 4.2V/NC-600 and 4.2V/C-hexa catalysts, wherein the peaks with high binding energy (517.0 eV) are assigned to the V5+ species while the others (515.7 and 515.6 eV) are ascribed to the V4+ species.38,39


image file: c6ra18132e-f7.tif
Fig. 7 XPS survey (A) and V 2p3/2 (B) spectra of 4.2V/NC-600 (a) and 4.2V/C-hexa (b).

Considering the benzene adsorption ability of the catalyst affects its catalytic activity, both the benzene and phenol adsorption tests are conducted separately over the 1.4V/NC-y catalysts. As shown in Fig. 8A, all the catalysts exhibit a lower equilibrious benzene concentration than the initial one, while 1.4V/NC-600 shows the lowest equilibrious concentration corresponding to the strongest benzene adsorption ability. Based on the above characterization results, with the rise of the pyrolysis temperature, both the specific surface area and pore volume of 1.4V/NC-y catalysts increase gradually (Table 1), consequently facilitating the benzene adsorption. However, the graphitization degree of 1.4V/NC-y catalysts decreases gradually accompanied with the increase of calcination temperature (Fig. 4). Since the graphitic support may enhance the benzene adsorption and activation via the π–π interaction, the decrease of graphitization degree disfavors the benzene adsorption. Therefore, the above two contrary effects give rise to the maximum benzene adsorption ability of 1.4V/NC-600. As for the phenol adsorption (Fig. 8B), all the catalysts display a similar equilibrious concentration which changes slightly compared with the initial one. The adsorption differences between benzene and phenol may be related with their intrinsic polarity properties.


image file: c6ra18132e-f8.tif
Fig. 8 The relationship between initial and equilibrious concentrations of benzene (A) or phenol (B) over the 1.4V/NC-y catalysts.

For comparison, the benzene and phenol adsorption tests are also conducted over 4.2V/NC-600 and 4.2V/C-hexa catalysts (Fig. 9). Although both the BET surface area and pore volume of 4.2V/C-hexa are much higher than those of 4.2V/NC-600, 4.2V/NC-600 shows a lower equilibrious concentration of benzene corresponding to its superior benzene adsorption ability (Fig. 9A). This suggests that in this case the surface graphitization degree has more effects on the benzene adsorption ability than the other factors such as surface area or pore volume, since the carbon framework of 4.2V/NC-600 is graphitic while that of 4.2V/C-hexa is amorphous (Fig. 1B). As for the phenol adsorption test, both catalysts display a similar equilibrious concentration (Fig. 9B), which is as anticipated due to the weak affinity between polar phenol and the catalysts.


image file: c6ra18132e-f9.tif
Fig. 9 The relationship between initial and equilibrious concentrations of benzene (A) or phenol (B) over 4.2V/NC-600 and 4.2V/C-hexa catalysts.

Catalytic activity of xV/NC-y catalysts

The catalytic activity of the xV/NC-y catalysts was investigated in the direct oxidation of benzene to phenol using H2O2 as the oxidant. In order to find out the optimum reaction conditions in the present system, various factors, including reaction time, reaction temperature, catalyst amount, molar ratio of H2O2 to benzene, and solvent, were carefully investigated (Table S1). The obtained optimum reaction conditions were then applied in the catalytic activity tests of the xV/NC-y catalysts. Furthermore, to ascertain the precision of catalytic results, the carbon balance closure was also calculated based on the analysis of products distribution (Table S2).

As shown in Table 3, a blank experiment shows no measurable benzene conversion (entry 1), while NH4VO3 exhibits a 10.0% of benzene conversion with a phenol selectivity of 82.4%. The formation of byproducts, hydroquinone and catechol, are mainly derived from the attack of ˙OH radicals to phenol in solution.40 Since NH4VO3 acts as a homogeneous catalyst, the decomposition of H2O2 is quite rapid (Fig. S1), leading to its limited catalytic activity. As for the 1.4V/NC-y catalysts (entries 3–6), with the rise of the pyrolysis temperature, the benzene conversion increases firstly from 11.4% over 1.4V/NC-400 to 20.7% over 1.4V/NC-600 and then decreases to 12.9% over 1.4V/NC-700, while the phenol selectivity increases gradually from 83.2% to 92.5%. The catalytic differences of 1.4V/NC-y are probably originated from the property differences of NC-y supports. The poor performance of 1.4V/NC-400 can be attributed to the poor mesoporosity and the consequent low pore volume (Fig. 1A and Table 1) that disfavor the diffusion of reactants. With the further increase of calcination temperature, the structural ordering along with the surface area and pore volume are improved (Fig. 1A and Table 1), enhancing the corresponding catalytic activity consequently. However, the graphitization degree of catalysts decreases accompanied with the rise of pyrolysis temperature (Fig. 4), which disfavors the adsorption and activation of benzene and subsequently weakens the benzene conversion. These two contrary factors are responsible for the variation of catalytic activity over the 1.4V/NC-y catalysts. The integration of ordered mesostructure with high surface area and large pore volume (Table 1), and the superior benzene adsorption ability (Fig. 8A) of 1.4V/NC-600 may lead to its superior benzene conversion compared with others.

Table 3 Catalytic performance of various catalystsa
Entry Catalysts Benzene conversion (%) Phenol selectivity (%) Phenol yield (%)
a Reaction conditions: 20 mg of catalyst, 0.4 mL of benzene, 5 mL of 80 wt% acetic acid, 1.4 mL of 30 wt% H2O2, 70 °C for 3 h.b The blank experiment without any catalyst.
1 b 0 0 0
2 NH4VO3 10.0 82.4 8.2
3 1.4V/NC-400 11.4 83.2 9.5
4 1.4V/NC-500 16.5 88.9 14.7
5 1.4V/NC-600 20.7 91.1 18.9
6 1.4V/NC-700 12.9 92.5 11.9
7 2.8V/NC-600 27.5 92.8 25.5
8 4.2V/NC-600 31.0 97.2 30.1
9 5.6V/NC-600 24.1 96.5 23.3
10 4.2V/C-hexa 27.7 96.7 26.8
11 NC-600 Trace
12 C-hexa 0 0 0


According to the above catalytic results, the NC-600 support displays superior performance in the titled reaction. Therefore, it was employed as the support to synthesize a series of catalysts with different vanadium content (xV/NC-600). As shown in Table 3, a notable increase of benzene conversion from 20.7% to 31.0% is observed, accompanied with the increase of phenol selectivity from 91.1% to 97.2% as the rise of vanadium content from 1.4V/NC-600 to 4.2V/NC-600 (entries 5, 7 and 8). As anticipated, the improvement of catalytic activity is due to the enhanced amount of active centers derived from vanadium species. However, a further loading of vanadium species causes a dramatic decrease of benzene conversion as well as slightly lower phenol selectivity (entry 9), which is probably caused by the decrease of H2O2 utilization efficiency due to the high vanadium content.

Comparison between 4.2V/NC-600 and 4.2V/C-hexa

To further explore the superior properties of the NC support, C-hexa with amorphous carbon framework was synthesized and compared with 4.2V/NC-600 for their catalytic activity in benzene hydroxylation reaction.

As shown in Table 3, the pristine C-hexa support reveals no catalytic activity (entry 12), while the NC-600 support exhibits a trace benzene conversion (entry 11). In spite of the poor activity of NC-600, the observed benzene conversion, confirming its capability of benzene activation and oxidation, is nevertheless quite meaningful in catalysis. After the introduction of vanadium species, 4.2V/C-hexa shows a benzene conversion of 27.7% with a phenol selectivity of 96.7%, inferior to the 31.0% of benzene conversion and 97.2% of phenol selectivity over 4.2V/NC-600. Although both the content and chemical states of vanadium species are similar in 4.2V/NC-600 and 4.2V/C-hexa catalysts (Table 1 and Fig. 7B), the vanadium species in 4.2V/NC-600 exhibit relatively better dispersion (Fig. 5), which may contribute to its higher catalytic performance. Moreover, 4.2V/NC-600 possessing an open π-conjugated system shows higher affinity to benzene than that of 4.2V/C-hexa with amorphous carbon framework (Fig. 9A), facilitating the benzene activation and leading to superior catalytic activity consequently. In addition, the 3D mesostructure of 4.2V/NC-600 favoring the reactants diffusion is also beneficial to the catalytic performance. Therefore, owing to the highly ordered 3D mesostructure, the graphitic framework with abundant defects, and the facilitated vanadium dispersion, the NC support is more suitable for the titled reaction compared with the C-hexa support.

Reusability of 4.2V/NC-600

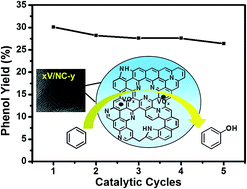
The 4.2V/NC-600 catalyst was used to test the reusability in benzene hydroxylation reaction under the optimized reaction conditions. After each reaction, the catalyst was separated by centrifugation, washed thoroughly with absolute ethanol (30 mL) for three times, and dried at 120 °C for 3 h. The recovered catalyst was tested in the next run under the same reaction conditions. As shown in Fig. 10, the benzene conversion decreases from 31.0% to 27.2% after five cycles, while the phenol selectivity remains nearly unchanged, indicating a good stability of 4.2V/NC-600.
image file: c6ra18132e-f10.tif
Fig. 10 Reusability of the 4.2V/NC-600 catalyst.

In our previous work, the vanadium-containing 2D hexagonal mesoporous carbon were synthesized and showed excellent catalytic performance in the titled reaction.23 Nevertheless, a further improvement of catalytic activity is anticipated by developing a carbon framework with superior surface and structure properties. In this work, the obtained vanadium supported 3D mesoporous carbon catalysts with nitrogen doped π-conjugated structure (4.2V/NC-600) exhibits superior catalytic performance than the 2D hexagonal one (4.2V/C-hexa). Also, the earlier reported vanadium-containing carbon catalysts including V-g-C3N4,41 V/mp-C3N4,42 C3N4-H5PMo10V2O40,43 VxOy@C,44 and VO2-defects/MWCNTs,45 gave a phenol yield from 12.2% to 23.0%, and a phenol selectivity from 93.7% to ∼100%. Although these catalytic reaction conditions differ from the present work, a rough comparison is still reasonable and shows great potential of the xV/NC-y catalysts in benzene hydroxylation reaction, which also gives insight into the future design of efficient catalysts for the direct benzene hydroxylation reaction.

Conclusions

A series of vanadium-containing 3D mesoporous carbon with nitrogen doped π-conjugated planar layers were synthesized and tested in the benzene hydroxylation reaction using H2O2 as an oxidant. The calcination temperature of NC support affected the corresponding mesostructure and graphitization degree, subsequently influencing the catalytic activity. Under the optimum vanadium content and reaction conditions, 4.2V/NC-600 exhibited the best activity with a benzene conversion of 31.0% and a phenol selectivity of 97.2%, superior to most vanadium-containing carbon catalysts reported previously. Also, 4.2V/NC-600 showed good stability during five recycle tests. Besides the excellent catalytic activity of vanadium species, the high performance of 4.2V/NC-600 could also be attributed to the superior properties of NC support, including the highly ordered 3D mesostructure to facilitate reactants diffusion, and the open π-conjugated system to enhance benzene adsorption and activation. The application of xV/NC-y catalysts in present work will be beneficial to the future design of more efficient catalysts for benzene hydroxylation reaction.

Acknowledgements

This work was supported by the National Natural Science Foundation of China (21173050, 21371035) and SINOPEC (X514005).

Notes and references

  1. G. Centi and S. Perathoner, Catal. Today, 2009, 143, 145–150 CrossRef CAS.
  2. L. Balducci, D. Bianchi, R. Bortolo, R. D'Aloisio, M. Ricci, R. Tassinari and R. Ungarelli, Angew. Chem., Int. Ed., 2003, 42, 4937–4940 CrossRef CAS PubMed.
  3. S. Niwa, M. Eswaramoorthy, J. Nair, A. Raj, N. Itoh, H. Shoji, T. Namba and F. Mizukami, Science, 2002, 295, 105–107 CrossRef CAS PubMed.
  4. F. Goettmann, A. Fischer, M. Antonietti and A. Thomas, Chem. Commun., 2006, 4530–4532 RSC.
  5. F. Goettmann, A. Fischer, M. Antonietti and A. Thomas, Angew. Chem., Int. Ed., 2006, 45, 4467–4471 CrossRef CAS PubMed.
  6. F. Goettmann, A. Thomas and M. Antonietti, Angew. Chem., Int. Ed., 2007, 46, 2717–2720 CrossRef CAS PubMed.
  7. P. F. Zhang, Y. T. Gong, H. R. Li, Z. R. Chen and Y. Wang, RSC Adv., 2013, 3, 5121–5126 RSC.
  8. J. H. Yang, G. Sun, Y. J. Gao, H. B. Zhao, P. Tang, J. Tan, A. H. Lu and D. Ma, Energy Environ. Sci., 2013, 6, 793–798 CAS.
  9. C. Wang, L. Y. Hu, Y. C. Hu, Y. H. Ren, X. Y. Chen, B. Yue and H. Y. He, Catal. Commun., 2015, 68, 1–5 CrossRef CAS.
  10. X. F. Chen, J. S. Zhang, X. Z. Fu, M. Antonietti and X. C. Wang, J. Am. Chem. Soc., 2009, 131, 11658–11659 CrossRef CAS PubMed.
  11. G. D. Wen, S. C. Wu, B. Li, C. L. Dai and D. S. Su, Angew. Chem., Int. Ed., 2015, 54, 4105–4109 CrossRef CAS PubMed.
  12. L. Y. Hu, B. Yue, C. Wang, X. Y. Chen and H. Y. He, Appl. Catal., A, 2014, 477, 141–146 CrossRef CAS.
  13. Y. Zheng, J. Liu, J. Liang, M. Jaroniec and S. Z. Qiao, Energy Environ. Sci., 2012, 5, 6717–6731 CAS.
  14. A. Thomas, A. Fischer, F. Goettmann, M. Antonietti, J. O. Muller, R. Schlogl and J. M. Carlsson, J. Mater. Chem., 2008, 18, 4893–4908 RSC.
  15. Z. L. Li, J. H. Liu, C. G. Xia and F. W. Li, ACS Catal., 2013, 3, 2440–2448 CrossRef CAS.
  16. J. Wei, D. D. Zhou, Z. K. Sun, Y. H. Deng, Y. Y. Xia and D. Y. Zhao, Adv. Funct. Mater., 2013, 23, 2322–2328 CrossRef CAS.
  17. T. Horikawa, N. Sakao, T. Sekida, J. Hayashi, D. D. Do and M. Katoh, Carbon, 2012, 50, 1833–1842 CrossRef CAS.
  18. J. Przepiorski, M. Skrodzewicz and A. W. Morawski, Appl. Surf. Sci., 2004, 225, 235–242 CrossRef CAS.
  19. Z. K. Zhao, Y. T. Dai, J. H. Lin and G. R. Wang, Chem. Mater., 2014, 26, 3151–3161 CrossRef CAS.
  20. S. N. Talapaneni, S. Anandan, G. P. Mane, C. Anand, D. S. Dhawale, S. Varghese, A. Mano, T. Mori and A. Vinu, J. Mater. Chem., 2012, 22, 9831–9840 RSC.
  21. J. Xu, T. Chen, X. Wang, B. Xue and Y. X. Li, Catal. Sci. Technol., 2014, 4, 2126–2133 CAS.
  22. L. Y. Hu, B. Yue, X. Y. Chen and H. Y. He, Catal. Commun., 2014, 43, 179–183 CrossRef CAS.
  23. L. Y. Hu, C. Wang, L. Ye, Y. N. Wu, B. Yue, X. Y. Chen and H. Y. He, Appl. Catal., A, 2015, 504, 440–447 CrossRef CAS.
  24. F. Kleitz, S. H. Choi and R. Ryoo, Chem. Commun., 2003, 2136–2137 RSC.
  25. G. Zhang, J. S. Yi, J. M. Shim, J. W. Lee and W. Y. Choi, Appl. Catal., B, 2011, 102, 132–139 CrossRef CAS.
  26. Y. Meng, D. Gu, F. Q. Zhang, Y. F. Shi, L. Cheng, D. Feng, Z. X. Wu, Z. X. Chen, Y. Wan, A. Stein and D. Y. Zhao, Chem. Mater., 2006, 18, 4447–4464 CrossRef CAS.
  27. A. Vinu, K. Ariga, T. Mori, T. Nakanishi, S. Hishita, D. Golberg and Y. Bando, Adv. Mater., 2005, 17, 1648–1652 CrossRef CAS.
  28. C. D. Liang, K. L. Hong, G. A. Guiochon, J. W. Mays and S. Dai, Angew. Chem., Int. Ed., 2004, 43, 5785–5789 CrossRef CAS PubMed.
  29. J. Liang, Y. Jiao, M. Jaroniec and S. Z. Qiao, Angew. Chem., Int. Ed., 2012, 51, 11496–11500 CrossRef CAS PubMed.
  30. I. O. Maciel, N. Anderson, M. A. Pimenta, A. Hartschuh, H. H. Qian, M. Terrones, H. Terrones, J. Campos-Delgado, A. M. Rao, L. Novotny and A. Jorio, Nat. Mater., 2008, 7, 878–883 CrossRef CAS PubMed.
  31. Z. H. Sheng, L. Shao, J. J. Chen, W. J. Bao, F. B. Wang and X. H. Xia, ACS Nano, 2011, 5, 4350–4358 CrossRef CAS PubMed.
  32. W. Z. Shen, L. W. Ren, H. Zhou, S. C. Zhang and W. B. Fan, J. Mater. Chem., 2011, 21, 3890–3894 RSC.
  33. Y. F. Zhang, X. J. Bo, A. Nsabimana, C. Luhana, G. Wang, H. Wang, M. Li and L. P. Guo, Biosens. Bioelectron., 2014, 53, 250–256 CrossRef CAS PubMed.
  34. K. A. Trick and T. E. Saliba, Carbon, 1995, 33, 1509–1515 CrossRef CAS.
  35. S. B. Kristensen, A. J. Kunov-Kruse, A. Riisager, S. B. Rasmussen and R. Fehrmann, J. Catal., 2011, 284, 60–67 CrossRef CAS.
  36. S. B. Yang, X. L. Feng, X. C. Wang and K. Mullen, Angew. Chem., Int. Ed., 2011, 50, 5339–5343 CrossRef CAS PubMed.
  37. A. Vinu, Adv. Funct. Mater., 2008, 18, 816–827 CrossRef CAS.
  38. G. Silversmit, D. Depla, H. Poelman, G. B. Marin and R. De Gryse, J. Electron Spectrosc. Relat. Phenom., 2004, 135, 167–175 CrossRef CAS.
  39. J. Mendialdua, R. Casanova and Y. Barbaux, J. Electron Spectrosc. Relat. Phenom., 1995, 71, 249–261 CrossRef CAS.
  40. M. L. Neidig and K. F. Hirsekorn, Catal. Commun., 2011, 12, 480–484 CrossRef CAS.
  41. G. D. Ding, W. T. Wang, T. Jiang, B. X. Han, H. L. Fan and G. Y. Yang, ChemCatChem, 2013, 5, 192–200 CrossRef CAS.
  42. J. Xu, Q. Jiang, T. Chen, F. Wu and Y. X. Li, Catal. Sci. Technol., 2015, 5, 1504–1513 CAS.
  43. Z. Y. Long, Y. Zhou, G. J. Chen, W. L. Ge and J. Wang, Sci. Rep., 2014, 4, 3651 CAS.
  44. W. T. Wang, G. D. Ding, T. Jiang, P. Zhang, T. B. Wu and B. X. Han, Green Chem., 2013, 15, 1150–1154 RSC.
  45. S. Q. Song, S. J. Jiang, R. C. Rao, H. X. Yang and A. M. Zhang, Appl. Catal., A, 2011, 401, 215–219 CrossRef CAS.

Footnote

Electronic supplementary information (ESI) available. See DOI: 10.1039/c6ra18132e

This journal is © The Royal Society of Chemistry 2016