Predicting surface tension for vegetable oil and biodiesel fuels

Thangaraja J.*a, Anand K.b and Pramod S. Mehtab
aSchool of Mechanical Engineering, Vellore Institute of Technology, Vellore 632014, India. E-mail: thangaraja.j@vit.ac.in
bInternal Combustion Engine Laboratory, Department of Mechanical Engineering, Indian Institute of Technology Madras, Chennai – 600036, India

Received 14th July 2016 , Accepted 29th August 2016

First published on 29th August 2016


Abstract

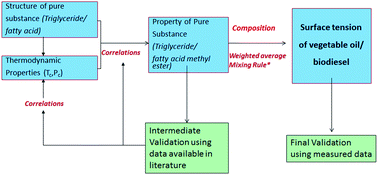
Vegetable oil and biodiesel are considered as alternatives to diesel fuel due to their favorable engine characteristics and renewable nature. Estimates of their surface tension values are essential in understanding fuel spray behavior. This study proposes an approach for predicting the surface tension of vegetable oil and biodiesel based on their composition. In the proposed methodology, the surface tension of fatty acids and methyl esters are first estimated using suitable property correlations available in the literature. The suitability of correlations is adjudged based on validation with the measured data. Further, the correlations are also modified to improve the predictions. A weighted average mixing rule is then employed to determine the surface tension of the vegetable oil and biodiesel from their measured composition. The predicted and measured surface tension values of karanja, palmolein and coconut are compared and found to agree within 7 percent over a useful temperature range of up to 353 K. The effects of transesterification and compositional variations on the surface tension of biodiesel fuels are also discussed in this paper.


1. Introduction

Biofuels based on vegetable oils are emerging as viable alternatives to fossil diesel because of their renewable nature, lower particulate emissions, higher flash point, good lubrication characteristics, potential for carbon di-oxide reduction, biodegradability, non-toxic nature and the absence of sulfur and aromatic compounds.1,2 Vegetable oils and biodiesel have the potential to replace diesel fuel in compression ignition engines for automotive and power generation applications. The renewed interest in using vegetable oils as fuels, owing to their economic advantage over biodiesel fuels requires measures to overcome problems related to their poor atomization characteristics.3

Altin et al.4 studied the potential of vegetable oils as an alternative fuel for diesel engines. The authors highlighted that the higher viscosity of vegetable oil possess severe problems such as fluid flow, atomization and higher particulate characteristics. They concluded that the fuel characteristics of vegetable oils should be improved and diesel delivery systems should be optimized for vegetable oil operation. Ramadhas et al.5 reviewed the use of vegetable oils as a replacement of compression ignition engine fuel. Reduction in crude oil imports, biodegradability and renewability, lower sulphur content and enhanced lubricity are found to be the major advantages of using vegetable oil. However, wider variations in feedstock, material compatibility, cold flow characteristics and oxidation stability are found to be the major technical challenges in applying the vegetable oils as fuels. Ryan et al.6 investigated the effects of vegetable oils on the injection and atomization characteristics of a direct-injection and an indirect-injection diesel engine. The authors opined that the performances of an injection system are influenced by fuel viscosity, density and surface tension. They recommended preheating process to circumvent the inferior spray and atomization characteristics of vegetable oil in comparison with fossil diesel. Further, the effect of compositional variations of vegetable oils was reported not to be impacted in the case indirect-injection engine. Esteban et al.7 characterized the surface tension of vegetable oils for its application in diesel engines. The authors measured the surface tension of vegetable oils in the temperature range 283 to 313 K by fabricating a calibrated dripping tip and a precision balance. Further, the authors proposed an empirical correlation between surface tension and density of vegetable oils and recommended to employ refined, preheated (∼393 K) vegetable oils that possess similar surface tension values as that of diesel. Melo-Espinosa et al.8 predicted the surface tension of vegetable oils using artificial neural networks and multiple linear regression techniques based on their fatty acid composition. Both the models are found to be accurate for estimating the surface tension of vegetable oils, but the authors did not perform any experimental validation and the models are limited to a finite number of carbon atoms (12–18) in the oil samples.

According to the ASTM standards, biodiesel fuels are mono-alkyl esters of long chain fatty acids derived from vegetable oils or animal fats.9 A wide variety of vegetable oil feed stocks including waste vegetable oils are used as potential sources for producing biodiesel depending on availability. The biodiesel is less complex than diesel in terms of molecular composition which comprises of only six to seven methyl/ethyl esters.10 However, it has fuel-bound oxygen and possesses a higher degree of unsaturation compared to diesel.1

The differences between biodiesel and fossil diesel fueled engine performances are attributed to changes in thermo-physical and chemical properties of biodiesel.11–19 The role of fuel properties in diesel combustion processes are summarized in ref. 20. The nature of vegetable oil source used for biodiesel production is found to affect its spray characteristics.21 The surface tension is an important fuel property which affects the stability of surface waves during the drop breakup process.2 It is reported in the literature that a higher viscosity, density and surface tension of biodiesel as compared to diesel fuel affects drop size distribution in terms of larger sauter mean diameter and longer fuel spray penetration.22–24 The atomization process affects the rate of fuel–air mixing and hence the diesel combustion and emission formation. Hence, the knowledge of surface tension of vegetable oils and biodiesel is essential in understanding their atomization process, so also injector design. Further, the surface tension data at varying temperatures from ambient to critical temperature are essential input in fuel spray and combustion modelling analysis.25 Attempts have been made by earlier researchers to predict the surface tension of biodiesel fuel from its molecular composition.

Allen et al.2 predicted the surface tension of methyl ester constituents of biodiesel using Sugden's parachor method and then applied a weighted mass fraction average equation to predict the surface tension of five different biodiesel fuels within 3.5% error. Shu et al.26 applied a mixture topological index method which includes the effect of molecular structure of methyl esters in terms of number of carbon atoms and double bonds to predict the surface tension of five different biodiesel fuels within 2.2% error. Yuan et al.27 predicted viscosity, surface tension and density of soy biodiesel from its composition by using Orrick and Erbar, Macleod Sugden and modified Rackett equations respectively. The maximum prediction error in their work went up to 32%. Chhetri and Watts29 proposed an empirical correlation to predict the surface tension of biodiesel fuels based on regression analysis. However, their predictor equation depends upon the absolute temperature (K) and pressure (kPa) of the measurement. The authors concluded that the temperature has a significant impact in lowering the surface tension than the pressure. A different approach for estimation of biodiesel surface tension was proposed by Phankosol et al.,30 wherein the need of a priori knowledge of surface tension of individual FAMEs is not needed. Their empirical approach considers the biodiesel as a single FAME with an average number of carbon atoms and average number of double bonds. The existing correlations available in the literature to predict surface tension of biodiesel fuels are summarized in Table 1.

Table 1 Correlations available in literature for predicting surface tension of biodiesel
Investigator(s) Biodiesel Correlation type/dependent variable Temperature range/deviation (%)
a Correlation used for estimating surface tension of methyl ester.
Allen et al.2 Coconut, peanut, soybean, palm, canola Sugdena/density, molecular weight image file: c6ra17948g-t1.tif 313 K/3.5
Yuan et al.27 Soybean Macleod Sugdena/density, normal boiling point, critical temperature image file: c6ra17948g-t2.tif 280 to 780 K/0.82% validated at 313 K
Shu et al.26 Coconut, peanut, soybean, palm, canola Mixture topological index/number of carbon atoms, double bonds image file: c6ra17948g-t3.tif 313 K/2.2
Freitas et al.28 Soybean, rapeseed, palm, sunflower and their blends Parachor based Macleod–Sugden and density gradient theory image file: c6ra17948g-t4.tif 303 to 353 K/9.7
Chhetri and Watts29 Canola, jatropha and soapnut Linear regression/absolute temperature and pressure σ = C + A × T + B × P Ambient to 7 MPa and 546 K
Phankosol et al.30 Lit. values of soy, rapeseed, sunflower, palm & blends Gibbs free energies of interfacial interaction/average carbon numbers and double bond(s) σ = 60.211 − 0.4307Z − 0.1125T + 0.00207ZT + 3.676m − 0.00893mT 303 to 303 K/5.7


It is worthwhile to note that except the correlation proposed by Freitas et al.,28 the other surface tension models do not consider the effects of both composition and temperature variations on the predicted surface tension. In a recent review21 comparing the available measured spray characteristics of a variety of vegetable oils, it is highlighted that there is a paucity of data concerning spray characteristics. In the present work, a composition based unified approach is proposed to estimate the surface tension of vegetable oils/biodiesel based on their fatty acid/methyl ester composition. Further, the correlations for the estimation of surface tension of fatty acids/methyl esters are chosen with the due consideration that the molecular composition and molecular structure effects are reflected in the models.

2. Methodology for experiments

The commercially available vegetable oils viz. karanja, palm and coconut used in this study are procured locally from the manufacturers in Tamilnadu and Andhra states of India, stored in air-tight containers and are used for the experiments immediately after their procurement. Further, the current work also explores the effects of variations of vegetable oil feedstocks of different origins on biodiesel surface tension characteristics. Hence, rapeseed and soybean of German origin are also investigated. It might be noted that, these two samples are procured directly as methyl esters/biodiesel from the OWI-Aachen. The selection of fuels is based on their varying degree of unsaturation (DU) content. The present work proposes a methodology for predicting the surface tension of vegetable oils and biodiesel fuels over a wide range of temperatures based on their composition. The present approach will prove to be useful in situations where the measured data are unavailable or measurements deemed to be difficult. It requires a priori knowledge of fatty acid composition and is fairly general and robust to be used for any vegetable oil/biodiesel over a wide range of temperatures. The current work also highlights the effect of transesterification and compositional variations on the surface tension of biodiesel fuels and also suggests suitable methods to address these issues.

The karanja oil has higher unsaturated content and is composed of primarily oleic and linoleic acids, while lauric acid, a short chain saturated acid is the major constituent in coconut oil. The details regarding the origin of vegetable oil plants and their yield are provided in Table 2. Palm oil is one of the most efficient oil bearing crops in terms of land utilization, efficiency and productivity. Further, palm is the highest oil yielding crop, producing on average about 4–5 tonnes of oil per ha per year, about 10 times the yield of soybean oil. Palm oil contributes to around 33% of the world vegetable oil demand.31 However, the oil yield is found to be dependent on the oil extraction process and also on the variations of samples.

Table 2 The origin and plantation details of the oil studied
Oils Source (India) Oil yielda (L ha−1) Oil contenta (%) Lifespan (years)
a Karmakar et al.32
Karanja Tamilnadu 27–39 80–100
Coconut Tamilnadu 2689 63–65 100
Palm Andhra Pradesh 5950 30–60 25–30


2.1 Transesterification

The biodiesel fuels used in the present work are obtained by transesterification of vegetable oils. The major factors affecting transesterification are the molar ratio of vegetable oil to methanol, amount of catalyst, reaction temperature, reaction time and free fatty acid contents (FFAs).33 It is reported in the literature that the vegetable oils with high FFA can be converted to biodiesel by a two-step transesterification process34 or by using a higher amount of catalyst.35 The measured free fatty acids (refer Table 3) for the test samples reveal that, a single stage transesterification is adequate for palmolein and coconut. However for karanja oil which is having a high FFA, a two stage transesterification process is carried out based on the methodology suggested by Ghadge and Raheman.35 Also, Ma et al.36 concluded that the presence of water has more detrimental effect on the transesterification than FFA. The transesterification process carried out involves preheating (∼383 K) of vegetable oil to remove moisture/water content which is then allowed to cool at ambient conditions. Sodium methoxide mixture prepared from 100 ml of methanol and 4 g of potassium hydroxide catalyst is decanted in the reactor at around 313 K with 500 ml of preheated oil. The reaction is carried out for an hour within a temperature range of 338 K and the mixture is allowed to settle for a day in a conical separator. After a day, heated water at 323 K is mixed with biodiesel for methanol washing for three to four times and is allowed to settle for an hour, wherein, the top layer is heated to above 383 K to remove water content from biodiesel. It is to be noted that the transesterification process results in the conversion of fatty acids to their corresponding methyl esters and hence does not change the relative mass percent of the individual constituents in vegetable oil and biodiesel. Table 3 provides the results concerning the effects of transesterification on biodiesel properties. As observed the transesterification process has significantly lowered the viscosities of the parent oil. Further, all the three esterified samples adhere with the biodiesel fuel standards in terms of the measured density and kinematic viscosity.
Table 3 Effect of transesterification process
Fuels Free fatty acid (%) Before transesterification After transesterification
Density (kg m−3) Viscosity (cSt) Density (kg m−3) Viscosity (cSt)
Karanja 5.92 (oleic) 910 42 880 5.25
Palmolein 0.15 (palmitic) 900 35 870 5.40
Coconut 0.22 (lauric) 905 31.5 860 3.10


2.2 Biodiesel composition measurement

The composition of biodiesel samples are measured using the flame ionization gas-chromatography (GC-FID), which contains fused silica capillary column coated with polyethylene glycol. The column is capable of separating out methyl esters ranging from octanoate (C8:0) to lignocerate (C24:0). The sample calibration is carried out with fatty acid methyl ester mixtures of C8 to C24. The sample preparation is carried out in accordance with EN14214 method.

The measured composition of biodiesel samples are included in Table 4. It is observed that the Indian origin biodiesel viz. karanja, coconut, palm and the German origin biodiesel viz. rapeseed, soybean are distinctively different in their compositional constituents. Among the five biodiesel tested, coconut has a dominance of short chain, saturated methyl laurate (C12:0). Whereas the mono-unsaturated methyl oleate (C18:1) is found to be dominant in rapeseed and the di-unsaturated methyl lineolate (C18:2) is more prominent in soybean biodiesel. The properties of interest related to compositional characteristics are estimated and given in Table 5. It is observed that the coconut biodiesel has the lowest DU and lowest molecular weight among all other biodiesel samples. Among the five biodiesel fuels, soybean is having a higher iodine value primarily due to the presence of higher amount of unsaturated contents.

Table 4 Measured composition of biodiesel samples
FAME/biodiesel C10:0 C12:0 C14:0 C16:0 C18:0 C18:1 C18:2 C18:3
Karanja 9.89 4.89 12.89 1.67 53.51 17.11
Palmolein 1.76 15.24 7.51 24.20 5.07 39.69 6.50
Coconut 4.43 42.91 21.09 11.89 3.96 15.69
Rapeseed 0.14 4.46 2.95 63.37 19.95 9.10
Soybean 10.08 3.49 27.55 52.78 6.08


Table 5 Estimated properties of biodiesel from their composition
Properties Karanja Palmolein Coconut Rapeseed Soybean
a Benjumea et al.37b Ramos et al.38c EN 14214.39
Molecular formula C17.9H34.1O1.9 C17.1H33.2O1.9 C14.9H29.6O1.9 C18.8H35.1O1.9 C18.7H34.5O1.9
Molecular weight 281.9 271.52 241.81 294.42 292.54
Fuel bound oxygen (%) 11.33 11.77 13.22 10.85 10.92
Degree of unsaturationa 0.87 0.52 0.15 1.30 1.51
Long chain saturated factorb 2.124 4.955 3.169 1.92 2.75
Iodine valuec 75.65 45.39 13.49 112.85 131.01


2.3 Surface tension measurement

The Sigma tensiometer system (700) which complies with ASTM D971 standard is used for the surface tension measurement. It is based on the measurements of force experienced by a probe during its interaction with the surface of a liquid to be tested. The probe is hanged on a balance and is brought in contact with the liquid interface. The force experienced by the balance when the probe interacts with the surface of the liquid is used to calculate the surface tension. The system used for the study utilizes the interaction of a Du Nouy ring made of platinum with the surface of the liquid. The ring is submerged below the interface by moving a stage where the biodiesel sample is placed. After immersion, the stage is gradually decreased and the ring pulls up the meniscus of the fuel. Eventually this meniscus tears from the ring. Prior to this event, the volume (and thus the force exerted) of the meniscus passes through the maximum value and begins to drop before the actual tearing event. The calculation of the surface tension by this technique is based on the measurement of this maximum force. The ring is cleaned in a butane flame before each measurement. The surface tension measurements for all the samples are carried out from ambient temperature to up to 353 K which is a typical temperature of fuel at the time of injection.22 The measurements were repeated 10 times and the average data was recorded. A water bath circulator is used for maintaining constant temperatures during the measurements. The repeatability of the equipment is examined by measuring the surface tension of karanja biodiesel at five different trials for two different temperature values. The data presented in Fig. 1 show that the repeatability of the data is satisfactory.
image file: c6ra17948g-f1.tif
Fig. 1 Repeatability of the surface tension measurement of karanja biodiesel.

The experimental uncertainty is evaluated using the standard procedure given by Holman.40 During experiments, five repeated observations of surface tension are taken at ambient condition and at maximum temperature of 353 K for karanja biodiesel and their corresponding mean, standard deviation and error according to normal distribution is estimated on 95% confidence criteria i.e. ±1.96* estimated standard deviations and are provided in Table 6. The calculated uncertainty based on this method is found to be 1.63 percent. The uncertainties in the measurements are evaluated using the uncertainty procedure described in Annexure A. The estimated uncertainties associated with different parameters are indicated in Table 15.

Table 6 Uncertainty analysis
Observations ST@306 K ST@353 K
1 29.281 26.555
2 29.146 26.147
3 29.098 27.116
4 29.129 26.423
5 29.081 26.318
Mean 29.147 26.5118
Std. dev. 0.079117 0.369272
Error (95%) 0.155069 0.723773


Though surface tension is not considered in both the European (EN14214) and American norms (ASTM D6751), it is one of the most crucial property, which influences the injection process. The cost of surface tension measurement equipment is very expensive and requires skilled labour for the measurement. Hence, it becomes important to develop accurate models for estimating the surface tension of vegetable oils and biodiesel from the economy stand point.

3. Methodology for surface tension predictions

The methodology for estimation of surface tension of vegetable oils and biodiesel includes three steps as follows: estimation of fundamental properties, viz. normal boiling point, critical pressure and critical temperature of fatty acids and methyl esters, estimation of surface tension of fatty acids and methyl esters and estimation of surface tension of vegetable oils and biodiesel based on their fatty acid/methyl ester composition through suitable mixing rules. The fundamental properties are required to be estimated as they are the inputs for the estimation of surface tension of fatty acids/methyl esters based on corresponding states principle. The correlations for these estimates are chosen from the literature with the due consideration that the molecular composition and molecular structure effects are reflected in the models. Further, a particular correlation for each of the properties is arrived at based on validation with the measured data.

3.1 Estimation of fundamental properties of fatty acids/methyl esters

The details of correlations used for estimating the fundamental properties of fatty acids and their methyl esters and the associated correlation parameters are discussed next.
3.1.1 Normal boiling point (Tnb). The normal boiling point of fatty acids/methyl esters is estimated using Constantinou and Gani correlation.41 It considers the combined effect of different functional groups in fatty acids/methyl esters and reported to provide closer predictions than the existing correlations.42
 
image file: c6ra17948g-t5.tif(1)

Constantinou–Gani correlation uses an advanced group contribution method involving first-order and second-order groups identified by suffix k and j respectively; N and M indicate the number of first and second order groups respectively. It is observed in the present study that first order group contribution (i.e. W = 0) itself provides sufficiently accurate predictions.

3.1.2 Critical temperature (Tc) and pressure (Pc). The critical temperature (in K) and critical pressure (in Pa) required for estimating the surface tension of fatty acids/methyl esters are obtained by using Lydersen correlations,43 given as
 
Tc = T[0.567 + ∑(NΔT) − (∑(NΔT))2]−1 (2)
 
Pc = 101325MW[0.34 + NP)]−2 (3)

Anand et al.42 have shown that Lydersen correlations predict the critical properties within minimum error compared to the experimental values. Lydersen correlation is based on a group contribution method requiring normal boiling point and structural formula of methyl esters for estimating the group contribution parameter ΔT. The correlation considers the frequency (N) of methyl, alkyl or ester groups present in a specific methyl ester for the estimation of critical temperature. The critical pressure correlation considers the combined effects of molecular weight and functional groups on critical pressure.

3.2 Estimation of surface tension of fatty acids/methyl ester

The surface tensions of fatty acids/methyl esters are estimated using the property correlations available in the literature and are also modified wherever necessary to improve the predictions. The surface tension (in mN m−1) of fatty acids/methyl esters estimated using Macleod–Sugden,44 Gambill,45 Pitzer, Sastri and Rao41 correlations are included in Table 7.
Table 7 Correlations used for estimating surface tension of fatty acids and methyl esters
Author(s) Method Correlations
Macleod–Sugden Group contribution σ1/4 = [P](ρlρv) (4)
Gambill Group contribution image file: c6ra17948g-t7.tif (5)
Pitzer Corresponding states image file: c6ra17948g-t8.tif (6)
Modified Pitzer Corresponding states image file: c6ra17948g-t9.tif (7)
Sastri and Rao Corresponding states image file: c6ra17948g-t10.tif (8)
Modified Sastri and Rao Corresponding states image file: c6ra17948g-t11.tif (9)


Macleod–Sugden and Gambill correlations involve the molecular structure contribution parameter parachor [P] concerning the structure of fatty acids/methyl esters which are estimated based on an additive scheme suggested by Windholz and Green.46 Gambill correlation is a slight modified form of Macleod–Sugden correlation involving an additional parameter in terms of the ratio of reduced temperature and reduced normal boiling point along with density value estimated at normal boiling point. The vapor density (ρv) in Macleod–Sugden correlation can be neglected for temperatures lower than the normal boiling point. The density of methyl ester (ρlb) in Gambill correlation is at normal boiling point and is estimated using Benson method.46 The acentric factor in the Pitzer correlation which is a measure of non-sphericity of the molecule is estimated using Constantinou–Gani correlation41 expressed as:

 
image file: c6ra17948g-t6.tif(10)
where ω1, ω2 are group contribution parameters based on the availability of alkyl or acid groups in the structure,31 N, M denote number of 1st and 2nd order groups respectively. The constant W assumes a value 1 if both 1st and 2nd order groups are involved and 0 for the 1st order groups.

The Sastri and Rao correlation is based on the corresponding states principle wherein the parameter parachor is replaced by critical pressure, critical temperature and the normal boiling point. For methyl esters, the constants K, x, y, z and m assume the values of 0.158, 0.50, −1.50, 1.85 and 1.22 respectively.41 A comparison of the estimated surface tension values of fatty acids using the correlations discussed above with that of measured data are provided in Table 8. It is observed that the Pitzer correlation provide closer predictions compared to estimations using Gambill and Macleod–Sugden correlations. Further, the value of exponential constant term viz. (1 − Tr) in Pitzer correlation is modified from 1.222 to 1.204 to improve the predictions. The modified value is arrived at after observing the constant variation corresponding to minimum deviation with temperature for the test samples as shown in Fig. 2.

Table 8 Comparison of predicted and measured surface tension of fatty acids
Fatty acids Measured Chumpitaz et al.47 Modified Pitzer Pitzer Sastir–Rao Macleod–Sugden
C12:0 25.64 27.38 27.05 21.56 41.47
C14:0 27.15 27.67 27.35 24.15 44.74
C16:0 27.57 28.13 27.81 24.64 48.34
C18:1 29.29 27.91 27.61 25.11 33.91


image file: c6ra17948g-f2.tif
Fig. 2 Variation in the exponential constant with temperature.

A comparison of estimated surface tension of methyl esters using correlations provided in Table 7 and the measured data48 is shown in Fig. 3. It is observed that Sastri and Rao method provides superior predictions particularly for larger molecular weight esters compared to other two correlations. In the present work, the constant ‘K’ in Sastri–Rao correlation is replaced by 0.154 in place of 0.158 for better accuracy of the predictions (with an error range of 0.6 to −3.7 percent), as shown in Fig. 3.


image file: c6ra17948g-f3.tif
Fig. 3 Comparison of estimated and measured surface tension of methyl esters.

3.3 Estimation of surface tension of vegetable oils

The primary constituents of vegetable oils are triacyl-glycerols which varies from 95 to 98%, while the other constituents like fatty alcohols, wax esters, hydro-carbons, tocopherols, tocotrienols, phenolic compounds, volatiles, pigments, minor glyceridic compounds, phospholipids and triterpenic acids are present in traces (2 to 5%).49 A triglyceride, also called triacylglycerol (TAG), is a chemical compound formed from one molecule of glycerol and three fatty acids. The proposed model for estimating the surface tension of vegetable oils is based on the assumption that the vegetable oils include only fatty acids which is justified by the fact that they are the major constituents. Similar assumption is made for estimating the density50 and viscosity51 of vegetable oils wherein the predictions compared well with measurements signifying the fact that the effect of glycerol on these properties is negligible. The surface tension of a liquid mixture is not a simple function of the surface tension of the pure components because in a mixture, the composition of the surface is not necessarily the same as the bulk.2 Hence, the mass-averaged predictor equations used for estimating properties like density, viscosity and calorific value cannot be applied for estimating the surface tension of liquid mixtures.

The surface tension of vegetable oil in eqn (7) is estimated based on their fatty acid composition using a weighted mass fraction average2 expressed as:

 
image file: c6ra17948g-t12.tif(11)
where wi is the weight factor and yi is the mass fraction for component i. The weight factor wi is estimated based on Allen et al.2 given as:
 
wi = i + c (12)
where m is the slope of the linear weight-function line and c is the constant of the linear weight-function line. The values of m and c for the fatty acids are provided in Table 9. It is observed that the predictions using modified Pitzer correlation provide a close agreement with the measured surface tension of karanja oil as shown in Fig. 4 with a maximum prediction error of 7%. It may be noted that though the error variation between the modified Pitzer and Pitzer correlation is not significant at the same temperature (353 K), the modified correlation was tuned to provide better results for the vegetable oil with variation in temperature.

Table 9 Variations of correlation constants in eqn (12) with temperature
Temperature (K) Fatty acids
m c
303 0.0128 0.5523
313 0.0129 0.5567
333 0.0131 0.5696
353 0.0134 0.5827


image file: c6ra17948g-f4.tif
Fig. 4 Measured and predicted surface tension of karanja oil.

3.4 Estimation of surface tension of biodiesel

The surface tension of biodiesel is estimated based on their methyl ester composition using a weighted mass fraction average2 expressed by:
 
image file: c6ra17948g-t13.tif(13)
where wi is the weight factor and yi is the mass fraction for component i. The weight factor wi is given by:
 
wi = i + c (14)
where m is the slope of the linear weight-function line and c is the constant of the linear weight-function line. The estimated values of m and c for methyl esters at different temperatures are given in Table 10.
Table 10 Variations of correlation constants in eqn (14) with temperature
Temperature (K) Methyl esters
m c
303 0.0143 0.5623
313 0.0141 0.5764
333 0.0133 0.6207
353 0.0126 0.6595


4. Results and discussion

The measured and predicted surface tension values of karanja, palmolein and coconut oils in the temperature range from ambient, 306 K to 353 K is provided in Fig. 5–7. The maximum temperature considered in the present work is a typical temperature during the fuel injection process.22 It is observed that the predictions compared well with the measured data for the entire temperature range. The surface tension of vegetable oils decreases linearly with an increase in temperature as expected and the trends are captured well in the predictions. At ambient temperature, the surface tension of vegetable oils is significantly higher than that of diesel fuel but there are no differences in surface tension values among the three vegetable oils. At a higher temperature at 353 K, the surface tension of coconut oil is significantly lower and is comparable to that of diesel fuel.
image file: c6ra17948g-f5.tif
Fig. 5 Surface tension of karanja oil at various temperatures.

image file: c6ra17948g-f6.tif
Fig. 6 Surface tension of palmolein oil at various temperatures.

image file: c6ra17948g-f7.tif
Fig. 7 Surface tension of coconut oil at various temperatures.

However, at lower temperatures (306 K) palmolein exhibits 20% increase in surface tension with respect to fossil diesel. Thus, when utilized in engines may result in higher smoke emissions during cold start operations.5 From the measured and predicted surface tension values of karanja, palmolein and coconut biodiesels shown in Fig. 8, 9 and 10 respectively, it is observed that the proposed methodology works well for predicting the temperature dependent surface tension of biodiesel fuels. Table 11 provides the deviation of the predicted results with the measured values for both vegetable oils and biodiesel fuels which are within 7%. The current approach for estimating surface tension of vegetable oil and biodiesel is composition based and thus could be applicable to any vegetable oil or biodiesel whose composition details are known.


image file: c6ra17948g-f8.tif
Fig. 8 Surface tension of karanja biodiesel at various temperatures.

image file: c6ra17948g-f9.tif
Fig. 9 Surface tension of palmolein biodiesel at various temperatures.

image file: c6ra17948g-f10.tif
Fig. 10 Surface tension of coconut biodiesel at various temperatures.
Table 11 Error deviation with measured and estimated surface tension
Oils Deviation (%) Biodiesels Deviation (%)
Karanja −1.9 to 3.5 Karanja −3.4 to 0.3
Palmolein −0.1 to 3.5 Palmolein −6.7 to −1.8
Coconut −5.0 to −1.4 Coconut −1.0 to −0.4


The applicability of the proposed method to capture the surface tension variations with temperature for other biodiesel samples is also examined using rapeseed and soybean biodiesel whose results are shown in Fig. 11 and 12 respectively. These two biodiesel fuel samples viz. soybean and rapeseed are procured from Germany with an intention to study how the weather, soil and geographic locations affect the composition and surface tension of biodiesel fuels. Their composition results presented in Table 3 reveal that both the fuels have dominance of unsaturated methyl ester contents. However, rapeseed primarily has mono-unsaturated methyl ester, while soybean has mostly di-unsaturated esters. It is observed that the model predictions are within 1.2 and 4.1% error for rapeseed and soybean respectively.


image file: c6ra17948g-f11.tif
Fig. 11 Surface tension of rapeseed biodiesel at various temperatures.

image file: c6ra17948g-f12.tif
Fig. 12 Surface tension of soybean biodiesel at various temperatures.

The measured and predicted (eqn (9)) surface tension of five biodiesel fuels considered in the present work is provided in Table 12. The prediction error lies within 5 percent at a temperature of 313 K. Further, based on literature data provided by Allen et al.,2 the surface tension of five different biodiesel samples are estimated based on their composition and are compared with measurements in Table 13, wherein, the maximum prediction error is within 1.5 percent except for peanut biodiesel which is due to a 10 percent untraceable composition. It should be highlighted here that one of the shortcomings of the present approach is that any untraceable composition data would lead to poor predictions and the error margin increase with an increase in untraceable composition.

Table 12 Measured and predicted surface tension (mN m−1@313 K) of biodiesel fuels in the present work
FAMEs Karanja Palmolein Coconut Soybean Rapeseed
Measured 28.62 27.02 26.9 29.60 29.39
Predicted 28.97 28.48 27.2 29.57 29.56
Error (%) 01.20 05.30 0.85 0.07 00.58


Table 13 Measured and predicted surface tension (mN m−1@313 K) of biodiesel fuels based on literature data
FAMEs Allen et al.2
Peanut Soybean Canola Palm Coconut
Measured 28.79 28.2 27.88 28.5 26.11
Current model 26.71 28.57 27.44 28.65 26.39
Error (%) 7.22 1.34 01.55 00.55 01.08
Allen model 28.99 29.0 29.07 28.71 27.44
Error (%) 0.69 3.01 4.27 0.74 1.33


4.1 Effects of transesterification and compositional variations

The effect of transesterification process on the measured surface tension of the test samples is provided in Fig. 13. The conversion of vegetable oil to biodiesel by transesterification reduces surface tension by around 12%. The lower surface tension of biodiesel compared to their vegetable oil counterpart is primarily due to their lower molecular weight owing to the removal of glycerol in the transesterification process. Thus, the shortcomings with vegetable oil properties could be addressed through the transesterification process.
image file: c6ra17948g-f13.tif
Fig. 13 Effect of transesterification process on the surface tension of the tested fuels.

To examine the effects of biodiesel composition on surface tension, the variations of surface tension with degree of unsaturation (DU), long chain saturated factor (LCSF) and molecular weights are examined. For the purpose, degree of unsaturation (DU) is calculated based on Benjumea et al.37

 
image file: c6ra17948g-t14.tif(15)
where ‘xi’ is the mass fraction of fatty acid methyl ester, ‘n’ is the carbon number and ‘i’ is number of double bond.

The long chain saturated factor (LCSF) is calculated based on an empirical correlation available in ref. 38, wherein a higher weightage has been considered for long chain esters.

 
LCSF = 0.1 × (C16:0) + 0.5 × (C18:0) + 1 × (C20:0) + 1.5 × (C22:0) + 2 × (C24:0) (16)

Fig. 14 shows a comparison of measured surface tension values of different biodiesel vis-a-vis diesel fuel. It is observed that among the tested biodiesel fuels, the surface tension of coconut biodiesel is the lowest primarily due to its lower molecular weight and a lower degree of unsaturation (refer, Table 4). To further examine this fact the variations of biodiesel surface tension with varying DU, LCSF and molecular weights of fifteen biodiesel sample taken from literature along with the tested samples are plotted in Fig. 15. It is observed that the surface tension of biodiesel varies linearly with molecular weight. A reasonably good correlation (R2 = 0.61) exist between the surface tension and molecular weight of biodiesel fuels. However, the surface tension of biodiesel fuels do not correlate well with their long chain saturated factor (refer Fig. 15a and b).


image file: c6ra17948g-f14.tif
Fig. 14 Variations of measured surface tension of biodiesel and diesel.

image file: c6ra17948g-f15.tif
Fig. 15 Effects of compositional characteristics on surface tension.

It may be noted that the average chain length of biodiesel is typically of the same order between 17 to 18 with an exception of value of 13 for coconut biodiesel.52 It can be inferred that biodiesel with higher molecular weight/unsaturation content, results in higher surface tension. Similar results are observed in the current investigation in case of coconut biodiesel, which is found to give the lowest surface tension value among other samples.

It is known from the literature that the biodiesel fuels with a higher surface tension produces a larger Sauter mean diameter (SMD) primarily due to resistance to droplet break up process which would lead to poor mixing characteristics.22,27 Adequate atomization enhances mixing and promotes complete combustion in a direct injection diesel engine and therefore is an important factor in engine emission and efficiency characterization.53 Fuels with higher density and surface tension adversely affect the atomization process.22 To address this problem, biodiesel from any vegetable oilsource can be used in the form of blends by mixing it with diesel, methanol or with a lower molecular weight biodiesel like coconut. The better miscibility of biodiesel with diesel in any proportion, with up to 10% methanol54 or with other biodiesel by bio-mix55 makes it a simple and viable option to reduce the higher surface tension. Fig. 16 shows a comparison of measured surface tensions of three biodiesel fuel blends (20% biodiesel + 80% diesel represented as B20, 90% biodiesel + 10% methanol represented as B90M10). The higher surface tension of biodiesel compared to diesel could be reduced significantly by using it in the blended form with diesel or methanol or bio-mix. As observed in Fig. 16, neat karanja (K100) has 17% higher surface tension than diesel fuel, nevertheless the surface tension of diesel blended karanja (K20) and methanol blended karanja (K90M10) has been reduced to 5% and 8% respectively.


image file: c6ra17948g-f16.tif
Fig. 16 Effects of blending diesel and methanol with biodiesel on its surface tension.

Further, there are no significant differences in the measured surface tension values among the different biodiesel blends, signifying the fact that the variability in biodiesel surface tension values due to changes in its composition could be addressed by using it in the blended form. The variations in compositions of a same biodiesel fuel due to differences in their origin or in the production process could also result in variations in their surface tension. To examine these effects, three karanja fuel samples are procured from a commercial biodiesel supplier in the state of Tamilnadu at different time intervals. The measured composition data for these samples show significant differences (refer Table 14) which could be due to variability in the plant oil sources or it could be due to differences in their fuel production process.

Table 14 Measured composition, surface tension and predicted surface tension (mN m−1@313 K) of three karanja samples
Composition properties Karanja-A Karanja-B Karanja-C
Methyl laurate (C12:0) 9.8
Methyl myristate (C14:0) 4.8
Methyl palmitate (C16:0) 9.7 12.8 12.9
Methyl stearate (C18:0) 6.3 1.6
Methyl arachidate (C20:0) 2.8
Methyl behenate (C22:0) 1.5
Methyl lignocerate (C24:0) 8.0
Methyl oleate (C18:1) 52.5 53.5 64.2
Methyl linoleate (C18:2) 16.9 17.1 22.7
Total 98 99 99
DU 0.88 0.87 1.10
Measured ST@313 K 28.79 28.62 30.26
Predicted ST@313 K 29.44 28.97 29.43
Relative error (%) 2.25 1.22 2.76


The measured surface tension data for three different karanja samples of varying compositions presented in Table 14 clearly suggest the influence of variations in composition on their surface tension values as also shown in Fig. 17. The surface tension of karanja-C sample is significantly higher than the other two samples primarily due to its higher degree of unsaturation. Also, note that the predictions using the proposed model for these biodiesel samples are found to be well within ±3 percent. Thus the model is robust to capture well the biodiesel compositional variations on their surface tension.


image file: c6ra17948g-f17.tif
Fig. 17 Measured composition and surface tension for three karanja biodiesel samples.

5. Conclusions

A fairly general methodology for estimating the surface tension of vegetable oils and biodiesel fuels from a priori knowledge of their fatty acid composition is elucidated. The important conclusions drawn from the present work are as follows:

(i) The surface tension of any vegetable oil/biodiesel could be estimated over a wide range of temperatures based on their fatty acid/methyl ester composition.

(ii) The surface tension of vegetable oil/biodiesel decrease linearly with an increase in temperature.

(iii) The surface tension of vegetable oils are significantly higher than fossil diesel and hence causes poor atomization characteristics.

(iv) Apart from preheating the oil, the conversion of vegetable oil to biodiesel by transesterification reduces surface tension by around 12%.

(v) The lower surface tension of biodiesel compared to their vegetable oil counterpart is primarily due to their lower molecular weight owing to the removal of glycerol in the transesterification process.

(vi) The surface tension of biodiesel fuels increase with an increase in degree of unsaturation and molecular weight.

(vii) The correlation between surface tension of biodiesel fuels and their long chain saturated factor is rather poor.

(viii) The higher surface tension of biodiesel compared to diesel could be reduced significantly by using it in the blended form with diesel or methanol or bio-mix.

Appendix

Nomenclature and abbreviations

cConstant of the linear weight-function line
DUDegree of unsaturation
MMolecular weight (g mol−1)
MNumber of first and second order groups
NFrequency of occurrence of a particular group
mSlope of the linear weight-function line
nliqLiquid phase molar densities
nvapVapor phase molar densities
PTemperature-independent parameter, “parachor”
PAbsolute pressure (kPa)
STSurface tension (mN m−1)
TAbsolute temperature (K)
TrReduced temperature (K)
TbrReduced temperature at normal boiling point (K)
tb1, tb2Group temperature contribution parameters
TbNormal boiling temperature (K)
TnbNormal boiling point
xiTopological index value of pure component
XmMean topological index value of the mixture
uiWeight factor for component
yiMass fraction of component
wiWeight factor
WConstant (set to 0 for first and 1 for second-order)
zCarbon number of double bonds
ΔT, ΔPGroup contribution parameter
σSurface tension (mN m−1)
[small script l]Density (g mL−1)
[small script l]LbLiquid density at normal boiling point (mol mL−1)
σmMean surface tension of the mixture (mN m−1)
ω1, ω2Group contribution parameters based on the availability of alkyl or acid groups in the structure
ωAcentric factor
ρl, ρvDensities of liquid and vapor phases of fatty acids

Annexure A

The measurements of all the physical quantities are subjected to error. Hence, an uncertainty analysis has been carried out in the present work following the procedure suggested by Holman.40 The corresponding error according to normal distribution estimated based on 95% confidence interval is given as:
 
Error = ±1.96 × σ (A.1)
Table 15 Uncertainty in biodiesel compositional measurement
FAME Uncertainty (%)
C10:0 1
C12:0 2.3
C16:0 1.5
C18:0 1
C18:1 2
C18:2 3
C18:3 2


The methodology adopted for the surface tension prediction based on the fundamental properties is shown in Fig. 18.


image file: c6ra17948g-f18.tif
Fig. 18 Surface tension prediction algorithm based on the molecular structure and fatty acid composition.

Acknowledgements

The authors acknowledge the Department of Science and Technology, India and Indo-German Center for Sustainability for providing necessary funding (MEE/13-14/313/IITM/PRAM) to carry out the research work and National Center for Combustion Research and Development, Government of India for providing us the necessary facilities to carry out the surface tension measurements. The authors wish to thank Avishek Ranjan for his useful input in preparing the manuscript and OWI-Aachen for providing rapeseed and soybean biodiesel samples.

References

  1. S. K. Hoekman and C. Robbins, Fuel Process. Technol., 2012, 96, 237–249 CrossRef CAS.
  2. C. A. W. Allen, K. C. Watts and R. G. Ackman, J. Am. Oil Chem. Soc., 1999, 76, 317–323 CrossRef CAS.
  3. J. Blin, C. Brunschwig, A. Chapuis, O. Changotade, S. S. Sidibe, E. S. Noumi and P. Girard, Renewable Sustainable Energy Rev., 2013, 22, 580–597 CrossRef CAS.
  4. R. Altin, S. Cetinkaya and H. S. Yucesu, Energy Convers. Manage., 2001, 42, 529–538 CrossRef CAS.
  5. A. S. Ramadhas, S. Jayaraj and C. Muraleedharan, Renewable Energy, 2004, 29, 727–742 CrossRef CAS.
  6. T. W. Ryan III, L. G. Dodge and T. J. Callahan, J. Am. Oil Chem. Soc., 1984, 61, 1610–1619 CrossRef.
  7. B. Esteban, J. R. Riba, G. Baquero, R. Puig and A. Rius, Fuel, 2012, 102, 231–238 CrossRef CAS.
  8. E. A. Melo-Espinosa, Y. Sánchez-Borrotoa, M. Errastia, R. Piloto-Rodrígueza, R. Sierensb, J. Roger-Ribac and A. Christopher-Hansend, Energy Procedia, 2014, 57, 886–895 CrossRef CAS.
  9. ASTM D6751-15ce1 Standard Specification for Biodiesel Fuel Blend Stock (B100) for Middle Distillate Fuels.
  10. L. D. Clements, Proc. of the 3rd Liquid Fuel Conference, ASAE, Nashville, 15–17, 1996, pp. 44–53 Search PubMed.
  11. M. A. Wakil, M. A. Kalam, H. H. Masjuki, I. M. R. Fattah and B. M. Masum, RSC Adv., 2014, 4, 56984–569910 RSC.
  12. A. M. Ruhul, M. A. Kalam, H. H. Masjuki, A. Alabdulkarem, A. E. Atabani, I. M. R. Fattahd and M. J. Abedin, RSC Adv., 2016, 6, 24584–24595 RSC.
  13. Y. H. Teoh, H. H. Masjuki, M. A. Kalam, M. A. Amalina and H. G. How, RSC Adv., 2014, 4, 50739–50751 RSC.
  14. H. K. Rashedul, H. H. Masjuki, M. A. Kalam, A. M. Ashraful, M. M. Rashed, I. Sanchita and T. Shaon, RSC Adv., 2014, 4, 64791–64797 RSC.
  15. A. Sanjid, H. H. Masjuki, M. A. Kalam, S. M. AshrafurRahman, M. J. Abedin and I. M. R. Fattah, RSC Adv., 2015, 5, 13246–13255 RSC.
  16. E. Cecrle, C. Depcik, A. Duncan, J. Guo, M. Mangus, E. Peltier, S. Stagg-Williams and Y. Zhong, Energy Fuels, 2012, 26, 2331–2341 CrossRef CAS.
  17. S. Pinzi, P. Rounce, J. M. Herreros, A. Tsolakis and M. P. Dorado, Fuel, 2013, 104, 170–182 CrossRef CAS.
  18. J. P. Szybist, J. Song, M. Alam and A. L. Boehman, Fuel Process. Technol., 2007, 88, 679–691 CrossRef CAS.
  19. C. D. Rakopoulos, K. A. Antonopoulos, D. C. Rakopoulos, D. T. Hountalas and E. G. Giakoumis, Energy Convers. Manage., 2006, 47, 3272–3287 CrossRef CAS.
  20. M. S. Graboski and R. L. McCormick, Prog. Energy Combust. Sci., 1998, 24(2), 125–164 CrossRef CAS.
  21. S. Y. No, Atomization Sprays, 2011, 21(1), 87–105 CrossRef CAS.
  22. C. E. Ejim, B. A. Fleck and A. Amirfazli, Fuel, 2007, 86(10–11), 1534–1544 CrossRef CAS.
  23. L. F. Ramírez-Verduzco, Renewable Sustainable Energy Rev., 2015, 41, 202–216 CrossRef.
  24. X. Wang, Z. Huang, O. A. Kuti, W. Zhang and K. Nishida, Int. J. Heat Fluid Flow, 2010, 31(4), 659–666 CrossRef CAS.
  25. W. Yuan, A. C. Hansen and Q. Zhang, International Journal of Vehicle Design, 2007, 45, 12–32 CrossRef.
  26. Q. Shu, J. Wang, B. Peng, D. Wang and G. Wang, Fuel, 2008, 87, 3586–3590 CrossRef CAS.
  27. W. Yuan, A. C. Hansen and Q. Zang, Transactions of the ASAE, 2003, 46, 1487–1493 CrossRef.
  28. S. V. D. Freitas, M. B. Oliveira, A. J. Queimada, M. J. Pratas, A. S. Lima and J. A. P. Coutinho, Energy Fuels, 2011, 25, 4811–4817 CrossRef CAS.
  29. A. B. Chhetri and K. C. Watts, Fuel, 2013, 104, 704–710 CrossRef CAS.
  30. S. Phankosol, K. Sudaprasert, S. Lilitchan, K. Aryusuk and K. Krisnangkura, Fuel, 2014, 126, 162–168 CrossRef CAS.
  31. S. Sumathi, S. P. Chai and A. R. Mohamed, Renewable Sustainable Energy Rev., 2008, 12, 2404–2421 CrossRef CAS.
  32. A. Karmakar, S. Karmakar and S. Mukherjee, Bioresour. Technol., 2010, 101, 7201–7210 CrossRef CAS PubMed.
  33. F. Ma and M. A. Hanna, Bioresour. Technol., 1999, 70(1), 1–15 CrossRef CAS.
  34. M. Canakci and J. V. Gerpen, Transactions of the ASAE, 2001, 44(6), 1429–1436 CrossRef CAS.
  35. S. V. Ghadge and H. Raheman, Biomass Bioenergy, 2005, 28(6), 601–605 CrossRef CAS.
  36. F. Ma, L. D. Clements and M. Hanna, Transactions of the ASAE, 1998, 41(5), 1261–1264 CrossRef CAS.
  37. P. Benjumea, J. R. Agudelo and A. F. Agudelo, Energy Fuels, 2011, 25, 77–85 CrossRef CAS.
  38. M. J. Ramos, C. M. Fernandez, A. Casas, L. Rodriguez and A. Perez, Bioresour. Technol., 2009, 100(1), 261–268 CrossRef CAS PubMed.
  39. EN 14214 Automotive Fuels: Fatty Acid Methyl Esters (FAME) for Diesel Engines: Requirements and Test Methods.
  40. J. P. Holman, Experimental Methods for Engineers, McGraw-Hill, New York, 7th edn, 2007 Search PubMed.
  41. B. E. Poling, J. M. Prausnitz and J. P. O'Connel, The Properties of Gases and Liquids, McGraw Hill, New York, 5th edn, 2001 Search PubMed.
  42. K. Anand, R. P. Sharma and P. S. Mehta, Appl. Therm. Eng., 2011, 31, 235–242 CrossRef CAS.
  43. N. P. Chopey, Handbook of Chemical Engineering Calculations, McGraw-Hill, New York, 2nd edn, 1994 Search PubMed.
  44. D. B. Macleod, Trans. Faraday Soc., 1923, 19, 38–42 RSC.
  45. W. R. Gambill, Chem. Eng., 1959, 66, 123 CAS.
  46. M. Windholz and D. W. Green, Perry's Chemical Engineering Handbook, McGraw Hill, New York, 6th edn, 1984 Search PubMed.
  47. L. D. A. Chumpitaz, L. F. Coutinho and A. J. A. Meirelles, J. Am. Oil Chem. Soc., 1999, 76(3), 379–382 CrossRef CAS.
  48. D. Swern, Bailey's Industrial Oils and Fats Products, John Wiley and Sons, New York, 4th edn, 1979 Search PubMed.
  49. A. Cert, W. Moreda and M. C. Pérez-Camino, J. Chromatogr. A, 2000, 881, 131–148 CrossRef CAS PubMed.
  50. K. Anand, A. Ranjan and P. S. Mehta, Energy Fuels, 2010, 24, 3262–3266 CrossRef CAS.
  51. K. Anand, A. Ranjan and P. S. Mehta, Energy Fuels, 2010, 24, 664–672 CrossRef CAS.
  52. E. G. Giakoumis, Renewable Energy, 2013, 50, 858–878 CrossRef CAS.
  53. A. H. Lefebvre, Atomization and sprays, Hemisphere Publishing Corporation, New York, 1989 Search PubMed.
  54. K. Anand, R. P. Sharma and P. S. Mehta, Biomass Bioenergy, 2011, 35(1), 533–541 CrossRef CAS.
  55. P. S. Mehta and J. Thangaraja, SAE Tech. Pap., 2014-01-2724, 2014,  DOI:10.4271/2014-01-2724.

This journal is © The Royal Society of Chemistry 2016
Click here to see how this site uses Cookies. View our privacy policy here.