DOI:
10.1039/C6RA17864B
(Paper)
RSC Adv., 2016,
6, 113997-114004
Feature extraction from resolution perspective for gas chromatography-mass spectrometry datasets†
Received
13th July 2016
, Accepted 25th November 2016
First published on 1st December 2016
Abstract
Automatic feature extraction from large-scale datasets is one of the major challenges when analyzing complex samples with gas chromatography-mass spectrometry (GC-MS). The classic processing pipeline basically consists of noise filtering, baseline correction, peak detection, alignment, normalization and identification. The long pipeline makes the extracted features inconsistent with different methods and values of parameters. In this study, MS-Assisted Resolution of Signals (MARS) has been proposed to extract features automatically from resolution perspective for large-scale GC-MS datasets. Firstly, it divides complex data into small segments and searches the target zone by moving sub-window factor analysis (MSWFA). Then, improved iterative target transformation factor analysis (ITTFA) has been developed to extract features of the compound from complex datasets. MARS was systematically tested on a simulated dataset (5 samples), peppermint dataset (2 samples), red wine dataset (24 samples) and human plasma dataset (131 samples). The results show that MARS can extract features accurately, automatically, objectively and swiftly from these complex datasets at 2–3 minutes/chromatogram speed. The extracted features of overlapped peaks are comparable to the features resolved by MCR-ALS or PARAFAC2, and significantly better than XCMS. Furthermore, PLS-DA models of the human plasma dataset indicated that features extracted automatically by MARS are comparable or better than features extracted manually by experts with a GC-MS workstation. It has been implemented and open-sourced at https://github.com/zmzhang/MARS.
1. Introduction
Advanced chromatographic techniques coupled with multichannel detectors have emerged as powerful techniques suitable for separation, quantification and identification in toxicology studies,1 drug discoveries,2 disease diagnosis,3 and food and nutrition sciences.4 Hyphenated chromatographic experiments produce an enormous amount of data. Reliable chemometric methods are needed for high-throughput dataset analysis. GC-MS was used as a robust analytical tool in large-scale sample analysis, due to high separation efficiency, sensitive detection and good reproducibility to resolve the complex mixtures. However, it is not a trivial task to analyze large-scale GC-MS dataset of complex samples. Firstly, chromatographic signals are mixed with random noise and baseline.5 Furthermore, retention time shifts and large variability of concentration occur in different samples.6 The most serious one is co-elution problem, which is also inevitable when analyzing complex samples.
Lots of packages and softwares have been developed to solve aforementioned problems, including XCMS,7,8 MZmine,9,10 MetSign,11,12 OpenMS,13 MET-XAlign,14 MET-COFEA15 and so on. Most of them have a long preprocessing pipeline including noise filtering, baseline correction,16,17 peak detection,18,19 alignment,20–22 identification23–25 and normalization.26 At each step of preprocessing pipeline, methods may differ from each other in their principles, parameter settings and performance. In noise filtering, a filtering parameter is used for adjusting signal-to-noise ratio (SNR). The results of peak detection are based on one or more of the parameters, including SNR, intensity threshold, slopes of peaks, local maximum, shape ratio, ridge lines, model-based criterion and peak width.27 The m/z and retention time (RT) windows are important parameters for aligning retention time shifts.21,28 Moreover, the accumulated influence from each step may make the final results worse.
Multivariate curve resolution (MCR) methods have been used extensively to resolve overlapped peaks, such as heuristic evolving latent projections (HELP),29,30 window factor analysis (WFA)31,32 and iterative transformation target factor analysis (ITTFA).33,34 However, these methods are cumbersome and time-consuming for multi-dataset. One way of solving this drawback is to resolve several chromatographic runs together. The augmented version of MCR-ALS34–36 makes it possible to handle three-way data by rearranging data from several samples into a matrix. Another approach is the arrangement of the different samples as a three-dimensional array, and Parallel Factor Analysis2 (PARAFAC2)37–39 belongs to this category. MCR-ALS and PARAFAC2 succeed in resolving overlapped peaks of local range of chromatograms, but can't resolve all features automatically in one step.
With this background, MARS combines novel methods for searching the target zone by moving sub-window factor analysis (MSWFA) and an improved resolution method based ITTFA for features extraction. It can extract features directly from raw dataset without preprocessing such as baseline correction and peak alignment, which eliminates the interference from preprocessing and guarantees that all final features are more stable and objective. Each chemical component is represented only once in features table according to mass spectrum. Therefore, MARS can extract features of compounds automatically from large-scale samples with the given mass spectrum and retention time pairs.
2. Method and theory
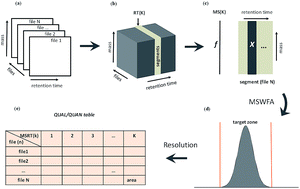
In this study, MARS has been developed based on resolution techniques in chemometrics. Importantly, several novel techniques have been improved and combined together. The architecture of MARS is shown in Fig. 1. Each step of MARS will be elucidated in the following sections, including extracting MSRT pair (mass spectrum, retention time), searching target zone, initial estimation and resolution.
 |
| Fig. 1 A workflow of the MARS method. | |
2.1 Extracting MSRT pairs from reference samples
Each compound has its mass spectrum and retention time with given experimental conditions, and we call them mass spectrum and retention time pairs. To obtain MSRTs in dataset, one can choose a reference chromatogram, and obtain the MSRTs corresponding to particular compounds. For chromatographic peak of pure compound, mass spectrum at the apex position and its retention time can be chosen as its MSRT. For overlapped chromatographic peak, it should be resolved to obtain pure mass spectrum of each compound. HELP is recommended for resolution of overlapped peaks in reference chromatogram. MS refers to the solved mass spectrum and RT also refers to the position of resolved peak apex.
2.2 Searching target zone by MSWFA
Hundreds of chromatographic peaks can be detected by GC-MS for complex samples. Automatically locating the target zone in these complex GC-MS dataset with a given MSRT pair is critical for the performance of MARS. MSWFA has been proposed to verify and locate a component in chromatogram with given MSRT pair. RT of MSRT pair is used to initialize scan range in chromatogram and MS is used to scan for target zone with a moving window along retention time. The window size can be set as 3–5 scans (0.06–0.1 s). Procedure for locating target zone consists of the following steps:
(1) Slice a sub-window matrix (X) from chromatogram and a MS as a vector (f) from MSRT pair.
(2) Obtain loading orthogonal basis E = (e1,e2,…,em) by singular value decomposition above sub-windows. The pure spectra (S) of compound co-exist in both region can be expressed by following equation:
(3) Construct target equation and deduce the criteria of minimum optimization.
|
a = ETs = ETfs = ETffTs = ETffTEa
| (3) |
Obtain maximum eigenvalue of matrix ETffTE. If it is over a specified threshold, 1 is recorded and if not, 0 is recorded. The a is eigenvector of ETffTE corresponding to maximum eigenvalue.
(4) Move to next sub-window and repeat (2)–(4).
Finally, a vector is obtained, consisting of value 1 and 0. The region representing 1 is detected as target zone. When none of 1 is present in vector, it means certain compound related to input MS is absent and area of 0 is saved in quantitative table. The width of target zone is related to moving window and cutoff of threshold, which are discussed in Results and discussion sections.
2.3 Initial estimation of chromatographic features
After identifying target zone, determination of number compounds and initial concentration estimation are needed for resolution. In this study, subspace comparison method (SCM) is applied for determination of number compounds. For a matrix of overlapped peaks, their principle vectors can be obtained by two different ways, singular value decomposition (SVD) and purest variables method (PVM).40 Spatial distinction function (SDF) is calculated to indicate linear relation between two types of vectors. The number of chemical rank in target zone is the number of principle vector when SDF reaches the lowest value. SCM is applicable for dataset with highly similar spectra and large random noises.
Initial concentration estimation of MARS is simpler than other MCR technologies, such as MCR-ALS and PARAFAC2, because MARS needs initial concentration estimation of only one component. A vector containing value 0 and only one value 1 is set as initial concentration estimation. The position close to peak apex is chosen as the position of the only value 1. This good initial estimation can accelerate convergence of iteration and make resolved chromatographic features more robust.
2.4 Extracting chromatographic features with resolution
ITTFA is a classic method for resolving chromatographic features from overlapped target zone. The number of components and initial concentration estimation can be calculated or estimated in previous section. During resolution, constraints such as non-negativity and unimodality have been used for solving ambiguity problem during iteration. For pure target zones, chromatographic features can be extracted without interference from noise, baseline and retention time drifting. For overlapped target zones, features can be extracted directly. Finally, polynomial fitting is applied for adjusting the intensity of each extracted feature to match the original data.Ck is a columnwise orthonormal vector (iteration concentration profile). T is score matrix of SVD from input matrix (X). The superscript T is transpose of matrix. ε is the terminal constant. Polynomial fitting is applied to obtain scale constant (k) for adjusting intensity of each feature. In order to obtain the scale constant, mass ions have been divided into three classes, such as common ion, selective ion and noise ion. Selective ion can be used to adjust intensity of extracted feature through polynomial fitting:
Vi ∈ VI, if PA > 2% max (PA), corrcoef ≥ 0.9; |
Vi ∈ VII, if PA > 2% max (PA), corrcoef < 0.9; |
Vi ∈ VIII, if PA ≤ 2% max (PA). |
Where VI, VII and VIII are selective ion, common ion and noise ion respectively. i refers to the order of m/z. PA represents area of peak at m/z. corrcoef represents correlation coefficient between resolved concentration profile and each ion chromatogram of input X. VI is used for polynomial fitting for scale constant (k). At the end of this step, a table can be generated by calculating peak height or area from each extracted feature to represent concentration of component. As an example from dataset I, distribution of all ions is shown in Fig. 2(a). Results of three kinds of ion are shown in Fig. 2(b).
 |
| Fig. 2 Performance of common ions, selective ions and noise ions under resolution. mz = 136, 112, 69 are noise ion, selective ion and common ion, respectively. | |
3. Datasets
In this study, four datasets were chosen carefully for the development, evaluation, and validation of MARS.
3.1 Peppermint samples (dataset I)
Two peppermint samples were collected from herbal plant. After GC-MS analysis, in total six peaks representing different compounds were extracted from two data profiles. It was found that menthol and L-menthone co-eluted with each other. Dataset I was used to demonstrate the adjustment of intensity of extracting features by polynomial fitting.
3.2 Human plasma samples (dataset II)
Human blood plasma samples were obtained from two group of people: 70 male infertility patients (MI), including 26 erectile dysfunction patients (ED, age range: 19–43) and 44 semen abnormalities patients (SA, age range: 23–43), and 61 age-matched fertile men defined as healthy controls (HC). All clinical experiments were performed at the Xiangya Hospital of Central South University (Changsha, China) under the approval of Xiangya Institutional Human Subjects Committee and informed consents were obtained from each participating subject. The details of sample collection, sample pretreatment and GC-MS analysis can be found in literature published by Zhou et al.41 Dataset II was used for evaluating the performance of MARS in large-scale and complex metabolomic dataset with noise, baseline, retention time shifts and overlapped peaks.
3.3 Red wine samples (dataset III)
This dataset is part of GC-MS chromatogram of red wine. It contains 24 samples, including two analytes: acetic-acid hexyl ester and 3-hydroxy-2-butanone. The details of GC-MS experiment can refer to J. M. Amigo et al.38 This dataset enabled us to evaluate the performance of MARS in overlapped peaks by comparison with resolution methods.
3.4 Simulated dataset (dataset IV)
Five overlapped simulated profiles were designed for comparison. The details of five simulated profiles are shown in ESI, Table S2.† Dataset IV was used to demonstrate the performance of MARS, MCR-ALS, PARAFAC2 and XCMS in terms of extraction quantitative information of overlapped peaks.
4. Results and discussion
4.1 Results
In MARS, quantitative analysis is achieved by peak area of extracted features from raw dataset directly. Qualitative analysis is achieved by comparing resolved mass spectrum against spectra in NIST library. It is found that the accuracy is largely dependent upon the quality of extracted features, including pure mass spectra and chromatographic profiles. The robust and accurate extracted features benefit from constrains such as scale constant, non-negativity and unimodality, which are applied to significantly reduce range of possible solutions. To evaluate overall performance of MARS, features of dataset II, III and IV have been extracted. The result, shown in ESI (Table S1†), demonstrated that MARS is capable of extract features automatically and swiftly from large-scale GC-MS dataset with given MSRT pairs.
Insensitive to parameters. Scan range of segments, terminal condition of iteration (ε), sub-window size and cutoff value of eigenvalues are critical to the performance of MARS. Scan range of segments is specified by visual inspection (usually slightly large than maximum peak width). Commonly, ε is set to 10−6. In Fig. 3, an example from dataset II shows effects of sub-window size and cutoff value of eigenvalues. From Fig. 3, the region of component elution time increases slightly as W is increasing and eigenvalue threshold is decreasing. Therefore, MARS is insensitive to these two factors. The window of 5 points and a cutoff eigenvalue of 0.9 can generate satisfactory results in most cases, and these values have been successfully used to analyze 131 GC-MS chromatograms of human plasma samples automatically.
 |
| Fig. 3 Target zone with different windows (W) and eigenvalue thresholds. The same color bars represent the start and ending point of component elution time respectively. | |
Baseline drifting. Traditionally, baseline correction is always a critical step for improving analyzing results. In MARS, baseline correction is not necessary anymore, because baseline can be eliminated during iteration process of resolution. One peak ranging from 683 s to 694 s in dataset II is shown in Fig. 4 as an example. The baseline correction was done by the methodology proposed by Liang et al.42 From the result, our method has ability to extract baseline-free chromatogram of compound of interest. This advantage is especially significant for handling large dataset because of highly variation of baselines in different samples.
 |
| Fig. 4 An example of resolved chromatographic signal extracted from complex data with baseline. Baseline correction is implemented by 2D least-squares fitting. | |
Large shifts in elution time. For most studies involving multiple samples, peaks of the same compound in different samples need to synchronization via peak alignment. In our method, peak matching and peak alignment is not needed anymore because of advantage of resolution. In Fig. 5, two peak clusters from three samples of dataset II are shown for demonstrating this merit. One class peak is overlapped with other two peaks and the other one is standard component spiked into samples. Two pairs of MSRTs are arranged as input in Fig. 5(a1) and (a2). The retention time of reference sample decided scan range. The start and ending of elution component which have same mass spectrum related to input mass spectrum in Fig. 5(b1) and (b2). It is worth noting that MARS has large flexibility to processing GC-MS dataset when retention time drift, concentration variation and co-elution components occur between samples.
 |
| Fig. 5 The presentation of extracted features from both overlapped peaks and pure peaks with retention time shifts. (a1) and (a2) are MSRTs; (b1) and (b2) is raw TIC of three samples (blue, t1(2); purple, n21; green, y1; vertical blue line, range of segments); (c1) and (c2) are TIC signal of resolved peaks. | |
4.2 Performance on overlapped peaks
To discuss the importance of our method, we made comprehensive comparison between MARS, XCMS, MCR-ALS and PARAFAC2 in baseline correction, alignment, performance on overlapped peaks, segmentation, parameters and speed. From Table S3,† MARS shows performance in different aspects. To evaluate the performance of MARS in term of extracting features from overlapped peaks, two peak clusters (A and B) have been resolved by MARS, MCR-ALS and PARAFAC2. These two peak clusters are from dataset III and IV, respectively and total ion chromatograms (TIC) are available in ESI (Fig. S2†). MARS, MCR-ALS and PARAFAC2 extract TIC of all resolved chromatogram, while XCMS extracts representative selected ion chromatograms (SIC). Table 1 shows that features extracted by MARS is in accord with features resolved by MCR-ALS and PARAFAC2.
Table 1 Resolution results of MARS, MCR-ALS and PARAFAC2 for overlapped peaksa
Method |
R2 (peak cluster A) |
R2 (peak cluster B) |
Com1a |
Com2b |
Baseline |
Total |
Com1c |
Com2d |
Total |
R2: explained variance; a: acetic-acid hexyl ester; b: 3-hydroxy-2-butanone; c: cis-11,14-eicosadienoic acid methyl; d: methyl eicosenoate. The baseline of MCR-ALS is obtained from 2D least-squares fitting. |
MCR-ALS |
0.0310 |
0.2407 |
0.7060 |
0.9777 |
0.4995 |
0.3709 |
0.8704 |
PARAFAC2 |
0.0320 |
0.2493 |
0.7036 |
0.9850 |
0.5297 |
0.4008 |
0.9305 |
MARS |
0.0311 |
0.2513 |
— |
— |
0.5186 |
0.3993 |
0.9179 |
Moreover, MARS and PARAFAC2 extract features without baseline correction. From Fig. S3(a1) and (a2),† three resolution methods obtained the similar chromatographic profiles. For XCMS, common ion chromatograms are selected, which may lead to inaccurate result. Calibration curves between resolution peak areas and concentration ratio of two co-elution components are shown in Fig. 6. The correlation coefficient (r) between them has been calculated to evaluate the goodness of extracted peak area of each component. It was found that MARS, MCR-ALS and PARAFAC2 showed better performance than XCMS especially in term of extracting area of each component from overlapped peaks.
 |
| Fig. 6 Calibration curves of peak areas at different concentration ratios of simulated overlapped chromatograms. | |
4.3 PLS-DA models with automatically extracted features
131 chromatograms of dataset II have been processed automatically by MARS within 5 hours, a matrix has been generated with each row is a sample and each column is a compound. PLS-DA model was built to validate the reliability of extracted features. As shown in Fig. S5,† the PLS-DA score plots indicated HC was discriminated with SA, ED and MI. One can see from Table 2 that sensitivity, specificity and accuracy of models built on the automatically extracted features were comparable or better than PLS-DA model of published paper according to Zhou et al.41 These results indicated that features extracted automatically by MARS are comparable or better than features extracted manually by experts with GC-MS workstation. It means that MARS can accelerate the procedure in analyzing large-scale metabolomic dataset and provide more accurate and objective results.
Table 2 Ten-fold cross validation of PLS-DA model using features from MARS and experts with GC-MS workstationa
Method |
MI vs. HC (%) |
SA vs. HC (%) |
ED vs. HC (%) |
Se |
Sp |
Ac |
Se |
Sp |
Ac |
Se |
Sp |
Ac |
Se: sensitivity, Sp: specificity, Ac: accuracy. Manual: deconvolution by experts with Shimadzu GC-MS workstation. |
MARS |
87.14 |
80.33 |
88.16 |
84.09 |
83.61 |
89.40 |
80.77 |
95.08 |
95.33 |
Manual |
86.89 |
81.43 |
83.97 |
78.69 |
84.09 |
80.95 |
80.33 |
100 |
87.36 |
5. Conclusion
It is urgent to distill features from large scale GC-MS dataset quickly, accurately, automatically and objectively for further statistics analysis. Therefore, MARS has been developed in this study, which is an automatic features extraction tool from resolution perspective for processing large-scale GC-MS data. The traditional preprocessing pipeline is not required in our MARS toolbox, which simplifies the steps and makes the extracted features more reliable and robust. In MARS, the target zone can be located by MSWFA. An improve resolution method based ITTFA has been developed to extract quantitative information of both pure and overlapped peaks accurately and directly from complex GC-MS dataset. 4 datasets have been used to benchmark the performance of features extraction of MARS in both region of pure compound and region of overlapped peaks. Results show that MARS can not only extract the pure chromatogram of compound of interest accurately for the pure compound region but also has excellence performance in the region of overlapped peaks. PLS-DA models of human plasma dataset indicated that features extracted automatically by MARS are comparable or better than features extracted manually by experts with GC-MS workstation. The automated tool enables more accurate and objective analysis of complex samples with GC-MS. It is worthwhile to point out that several problems are needed to be addressed in further researches including distilling complete list of MSRTs without human intervention, resolution of components with highly similar mass spectrum and elution time and accelerating the extracting procedure with multicore computing. This method may be promising to apply in data-independent acquisition (DIA)43–46 dataset of LC-MS.
Acknowledgements
This work is financially supported by the National Natural Science Foundation of China (Grant no. 21175157, 21375151, 21675174 and 21305163), China Hunan Provincial science and technology department (Grant no. 2012FJ4139 and 14JJ3031), China Postdoctoral Science Foundation (No. 2014M552146) and National Instrumentation Program of China (No. 2011YQ03012407). The studies meet with the approval of the university's review board. We are grateful to all employees of this institute for their encouragement and support of this research.
References
- R. D. Beger, J. Sun and L. K. Schnackenberg, Toxicol. Appl. Pharmacol., 2010, 243, 154–166 CrossRef CAS PubMed.
- W. Sm and G. Jb, Curr. Opin. Mol. Ther., 2002, 4, 224–228 Search PubMed.
- R. Madsen, T. Lundstedt and J. Trygg, Anal. Chim. Acta, 2010, 659, 23–33 CrossRef CAS PubMed.
- A. Scalbert, L. Brennan, O. Fiehn, T. Hankemeier, B. S. Kristal, B. van Ommen, E. Pujos-Guillot, E. Verheij, D. Wishart and S. Wopereis, Metabolomics, 2009, 5, 435–458 CrossRef CAS PubMed.
- J. M. Amigo, T. Skov and R. Bro, Chem. Rev., 2010, 110, 4582–4605 CrossRef CAS PubMed.
- R. H. Jellema, S. Krishnan, M. M. W. B. Hendriks, B. Muilwijk and J. T. W. E. Vogels, Chemom. Intell. Lab. Syst., 2010, 104, 132–139 CrossRef CAS.
- C. A. Smith, E. J. Want, G. O'Maille, R. Abagyan and G. Siuzdak, Anal. Chem., 2006, 78, 779–787 CrossRef CAS PubMed.
- R. Tautenhahn, G. J. Patti, D. Rinehart and G. Siuzdak, Anal. Chem., 2012, 84, 5035–5039 CrossRef CAS PubMed.
- M. Katajamaa, J. Miettinen and M. Orešič, Bioinformatics, 2006, 22, 634–636 CrossRef CAS PubMed.
- T. Pluskal, S. Castillo, A. Villar-Briones and M. Orešič, BMC Bioinf., 2010, 11, 1–11 CrossRef PubMed.
- X. Wei, W. Sun, X. Shi, I. Koo, B. Wang, J. Zhang, X. Yin, Y. Tang, B. Bogdanov, S. Kim, Z. Zhou, C. McClain and X. Zhang, Anal. Chem., 2011, 83, 7668–7675 CrossRef CAS PubMed.
- X. Wei, X. Shi, S. Kim, L. Zhang, J. S. Patrick, J. Binkley, C. McClain and X. Zhang, Anal. Chem., 2012, 84, 7963–7971 CrossRef CAS PubMed.
- M. Sturm, A. Bertsch, C. Gröpl, A. Hildebrandt, R. Hussong, E. Lange, N. Pfeifer, O. Schulz-Trieglaff, A. Zerck, K. Reinert and O. Kohlbacher, BMC Bioinf., 2008, 9, 163 CrossRef PubMed.
- W. Zhang, Z. Lei, D. Huhman, L. W. Sumner and P. X. Zhao, Anal. Chem., 2015, 87, 9114–9119 CrossRef CAS PubMed.
- W. Zhang, J. Chang, Z. Lei, D. Huhman, L. W. Sumner and P. X. Zhao, Anal. Chem., 2014, 86, 6245–6253 CrossRef CAS PubMed.
- Z.-M. Zhang, S. Chen and Y.-Z. Liang, Analyst, 2010, 135, 1138–1146 RSC.
- Z. Li, D.-J. Zhan, J.-J. Wang, J. Huang, Q.-S. Xu, Z.-M. Zhang, Y.-B. Zheng, Y.-Z. Liang and H. Wang, Analyst, 2013, 138, 4483–4492 RSC.
- Z.-M. Zhang, X. Tong, Y. Peng, P. Ma, M.-J. Zhang, H.-M. Lu, X.-Q. Chen and Y.-Z. Liang, Analyst, 2015, 140, 7955–7964 RSC.
- P. Du, W. A. Kibbe and S. M. Lin, Bioinformatics, 2006, 22, 2059–2065 CrossRef CAS PubMed.
- Z.-M. Zhang, Y.-Z. Liang, H.-M. Lu, B.-B. Tan, X.-N. Xu and M. Ferro, J. Chromatogr. A, 2012, 1223, 93–106 CrossRef CAS PubMed.
- S. Peters, E. van Velzen and H.-G. Janssen, Anal. Bioanal. Chem., 2009, 394, 1273–1281 CrossRef CAS PubMed.
- P. H. C. Eilers, Anal. Chem., 2004, 76, 404–411 CrossRef CAS PubMed.
- S. E. Stein, J. Am. Soc. Mass Spectrom., 1999, 10, 770–781 CrossRef CAS.
- T. Kind, G. Wohlgemuth, D. Y. Lee, Y. Lu, M. Palazoglu, S. Shahbaz and O. Fiehn, Anal. Chem., 2009, 81, 10038–10048 CrossRef CAS PubMed.
- X. Domingo-Almenara, A. Perera, N. Ramírez, N. Cañellas, X. Correig and J. Brezmes, J. Chromatogr. A, 2015, 1409, 226–233 CrossRef CAS PubMed.
- W. M. B. Edmands, P. Ferrari and A. Scalbert, Anal. Chem., 2014, 86, 10925–10931 CrossRef CAS PubMed.
- C. Yang, Z. He and W. Yu, BMC Bioinf., 2009, 10, 4 CrossRef PubMed.
- J. Wandy, R. Daly, R. Breitling and S. Rogers, Bioinformatics, 2015, btv072 Search PubMed.
- O. M. Kvalheim and Y. Z. Liang, Anal. Chem., 1992, 64, 936–946 CrossRef CAS.
- Y. Z. Liang, O. M. Kvalheim, H. R. Keller, D. L. Massart, P. Kiechle and F. Erni, Anal. Chem., 1992, 64, 946–953 CrossRef CAS.
- E. R. Malinowski, J. Chemom., 1992, 6, 29–40 CrossRef CAS.
- E. R. Malinowski, J. Chemom., 1996, 10, 273–279 CrossRef CAS.
- B. G. M. Vandeginste, W. Derks and G. Kateman, Anal. Chim. Acta, 1985, 173, 253–264 CrossRef CAS.
- P. J. Gemperline, J. Chem. Inf. Comput. Sci., 1984, 24, 206–212 CrossRef CAS.
- A. de Juan and R. Tauler, Crit. Rev. Anal. Chem., 2006, 36, 163–176 CrossRef CAS.
- E. Peré-Trepat, S. Lacorte and R. Tauler, Anal. Chim. Acta, 2007, 595, 228–237 CrossRef PubMed.
- H. A. L. Kiers, J. M. F. ten Berge and R. Bro, J. Chemom., 1999, 13, 275–294 CrossRef CAS.
- J. M. Amigo, T. Skov, R. Bro, J. Coello and S. Maspoch, TrAC, Trends Anal. Chem., 2008, 27, 714–725 CrossRef CAS.
- J. M. Amigo, M. J. Popielarz, R. M. Callejón, M. L. Morales, A. M. Troncoso, M. A. Petersen and T. B. Toldam-Andersen, J. Chromatogr. A, 2010, 1217, 4422–4429 CrossRef CAS PubMed.
- W. Windig and D. A. Stephenson, Anal. Chem., 1992, 64, 2735–2742 CrossRef CAS.
- X. Zhou, Y. Wang, Y. Yun, Z. Xia, H. Lu, J. Luo and Y. Liang, Talanta, 2016, 147, 82–89 CrossRef CAS PubMed.
- Y.-Z. Liang, O. M. Kvalheim, A. Rahmani and R. G. Brereton, Chemom. Intell. Lab. Syst., 1993, 18, 265–279 CrossRef CAS.
- H. L. Röst, G. Rosenberger, P. Navarro, L. Gillet, S. M. Miladinović, O. T. Schubert, W. Wolski, B. C. Collins, J. Malmström, L. Malmström and R. Aebersold, Nat. Biotechnol., 2014, 32, 219–223 CrossRef PubMed.
- X. Zhu, Y. Chen and R. Subramanian, Anal. Chem., 2014, 86, 1202 CrossRef CAS PubMed.
- A. Doerr, Nat. Methods, 2015, 12, 35 CrossRef CAS.
- H. Tsugawa, T. Cajka, T. Kind, Y. Ma, B. Higgins, K. Ikeda, M. Kanazawa, J. VanderGheynst, O. Fiehn and M. Arita, Nat. Methods, 2015, 12, 523–526 CrossRef CAS PubMed.
Footnote |
† Electronic supplementary information (ESI) available. See DOI: 10.1039/c6ra17864b |
|
This journal is © The Royal Society of Chemistry 2016 |
Click here to see how this site uses Cookies. View our privacy policy here.