DOI:
10.1039/C6RA17792A
(Paper)
RSC Adv., 2016,
6, 91409-91419
Proper ultrasound treatment increases ethanol production from simultaneous saccharification and fermentation of sugarcane bagasse†
Received
12th July 2016
, Accepted 17th September 2016
First published on 19th September 2016
Abstract
This study presents the effect of ultrasound (24 kHz) on enzyme production, enzymatic hydrolysis and simultaneous saccharification and fermentation (SSF) of sugarcane bagasse (SCB) for ethanol production. Trichoderma reesei cells were cultivated with SCB to induce the required enzymes and were subjected to ultrasound to enhance the enzyme secretion. Intracellular and cell wall bound β-glucosidase released into the extracellular extract fulfilled the bioconversion of cellulose into glucose. The hydrolysis and SSF were also investigated after treatment with ultrasound at various amplitudes and times to analyse the impact of ultrasound on the enzyme structure and biomass morphology. Ultrasound showed an effect on the secondary structural configuration of enzyme and biomass destabilization. Under optimized conditions, an ultrasound treatment at 60% amplitude gave the maximum yield of 92% (92.62% for scale up) reducing sugar and 90% (91.14% for scale up) ethanol with a power consumption of 5.4 × 10³ and 3 × 10⁴ J g−1 (4.9 × 10² and 12.3 × 10² J g−1 for scale up), respectively. The contents of inhibitors present in the hydrolysate were well below the inhibitory levels which led to the high ethanol yield. Thus, ultrasound improved the sugars and ethanol yield by improving the biological mechanisms. The novelty of this work is the demonstration of improved secretion of a T. reesei multienzyme complex by ultrasound leading to an efficiently integrated hydrolysis process.
1. Introduction
In recent years, much attention has been focused on the efficient utilization of agro-industrial by-products to obtain value added bio-products, including biofuels and biochemicals.1,2 The conversion of agro-industrial residues in biofuel production could reduce the problem associated with their disposal and reliance on petroleum resources.1,2 Sugarcane bagasse (SCB) is an abundant agro-industrial residue which yields fermentable sugar polymers such as cellulose and hemicelluloses.3 The bioprocesses such as pretreatment, hydrolysis and fermentation are essential in lignocellulosic ethanol production.1,2 Pretreatment improves the accessibility of polysaccharides to enzymes, hydrolysis breaks the polysaccharides into monosaccharides, and microbial fermentation converts the fermentable sugars into ethanol.1,2 The pretreatment has been performed by physical, chemical or biological methods,4 whereas the hydrolysis of pretreated lignocellulosic materials has been carried out using either acids or enzymes.5,6 In general, pretreatment breaks the ether and ester bonds of lignin and the hydrolysis breaks the glycosidic linkages present in cellulose and hemicellulose fractions and produces sugar monomers.7 Enzymatic methods are always highlighted for its specificity but the cost of the process associated with the isolation of pure enzymes makes the process uneconomically viable.8 In an attempt to make a viable process, researchers have used directly or the extracts of Trichoderma sp. for biomass hydrolysis.9 Although the on-site production of cellulases is a good option for the integration of conventional ethanol production, the yield is still low compared to that of commercial product. The reason behind is that the use of the fungus which produces the β-glucosidase in low quantities leads to incomplete hydrolysis of cellulose.10 The addition of required β-glucosidase to the cellulase was reported as a suitable remedy for the subsequent hydrolysis of cellobiose into glucose.11 On the other hand, pentose hydrolysing enzymes and other hydrolases have been used to improve the hydrolysis yield.12 More recently, the ultrasound irradiation of 20 to several hundred kHz has been applied in various biofuel production processes such as destabilization of biomass, cellular growth, enhancement of enzyme secretion, improved enzymatic hydrolysis, and fermentation process.13–15 Ultrasound has a direct effect on the enzyme molecules, resulting in enhanced mass transfer in the heterogeneous processes by acoustic cavitation.16 Furthermore, the mechanical impact produced by implosive collapse of cavitation provides an important benefit of opening up the surface of solid substrates to the action of enzymes.17,18 However, the stability of enzymes towards ultrasound might be dependent on energy input and duration of the irradiation.14,19 Previously there have been reports on ultrasound induced pretreatment, hydrolysis and fermentation.20–22 Although the previous studies showed ultrasound enhanced biofuel production, the focus of those studies is concerned with the yield rather than the rationale.20–22 The interaction of ultrasound with biomass and enzymes have been broadly attributed to physical and chemical effects of cavitation, but the exact links between ultrasound and the biochemistry of biomass destabilization and structural modification of enzyme have not been reported yet.
The objective of this study is to provide an insight into ultrasound induced enzyme secretion, hydrolysis and fermentation. We have developed strategies assisted by ultrasound such as cellulase production using Trichoderma reesei, enzymatic hydrolysis and fermentation using Saccharomyces cerevisiae. The morphological changes of biomass were analysed by scanning electron microscopy (SEM), whereas the secondary structure of enzymes was analysed by circular dichroism spectroscopy. On the other hand, ultrasound induced enzyme releases, sugar releases and ethanol production were analysed elaborately with respect to the power of ultrasound and treatment time. The novelty of this study is the demonstration of ultrasound mediated enzyme production without commercial enzyme addition for lignocellulosic ethanol production.
2. Experimental
2.1 Ultrasonic equipment
The ultrasonic equipment was composed of ultrasonic processor, power controller, thermostatic water bath and mechanical stirrer (150 rpm fixed). Operating power and frequency of ultrasonic processor was 400 W and 24 kHz respectively with the amplitude adjustable to 20 (low power), 60 (medium power) and 100% (high power) and pulse range from 0 to 100% (Hielscher UP 400S, Germany). The sonotrode was made up of titanium probe and the length was 100 mm (sonotrode H22 and H40). The input energy was monitored by using calorimeter and the average input power was considered as an applied power (J s−1).
2.2 Raw material and pretreatment
Sugarcane (Saccharum officinarum) bagasse (SCB) obtained was air dried after rinsing with distilled water. The dried SCB was powdered and sieved to 0.27 mm particle size (ASTM standard test sieves). The SCB powder was added into 5 L beaker containing 3 L of 2% NaOH solution in the ratio of 20![[thin space (1/6-em)]](https://www.rsc.org/images/entities/char_2009.gif) :1 (mL g−1) and the mixture was subjected to continuous ultrasound irradiation for 20 min.22
:1 (mL g−1) and the mixture was subjected to continuous ultrasound irradiation for 20 min.22
2.3 Microorganisms and growth conditions
Trichoderma reesei (MTCC 164), used for cellulase production, was obtained from Microbial Type Culture Collection (MTCC), Chandigarh, India. The purified commercial baker's yeast S. cerevisiae was used for ethanol production. S. cerevisiae was maintained in YEPD growth medium containing (g L−1): yeast extract 3.0 g, peptone 10 g, dextrose 20 g, and agar 15.0 g. S. cerevisiae was grown in YEPD broth for 12 h on a rotary shaker at 150 rpm. The culture (5% v/v) was used as an inoculum for the fermentation of hydrolysate.
2.4 Cellulase production
The mineral salt medium was used for cellulase production which is composed of (g L−1): urea, 0.3; KH2PO4, 2; (NH4)2SO4, 1.4; MgSO4·7H2O, 0.3; peptone, 0.75; yeast extract, 0.25; CaCl2·2H2O, 0.4; and trace elements (g L−1): FeSO4·7H2O, 0.005; MnSO4·7H2O, 0.0016, ZnSO4·7H2O, 0.0014; and CoCl2, 0.002. The T. reesei culture (initial inoculum 0.1 × 10⁴ conidia per mL) was grown aerobically in an Erlenmeyer flask (250 mL) containing 100 mL mineral salt medium (pH 6) and 10 g of SCB as a carbon source. For comparative analysis, 2.5 g of pure cellulose was used as a substrate instead of SCB.23 Scale up studies were carried out for enzyme production in 7 L sonication beaker containing 4 L of media and inoculum as mentioned in flask experiments. In all experiments, programmed sonication was set as 30 seconds ultrasound irradiation for every 6 h of incubation under sterile condition. After 10 days of incubation at 150 rpm and 28 ± 1 °C, the suspended biomass (mycelium and undigested SCB) were removed by centrifugation at 10000 × g for 10 min. The crude enzymes were obtained by filtration through a 0.45 μm nitrocellulose membrane.10 A partial purification of cellulase and xylanase was performed by precipitation with (NH4)2SO4, molecular weight filtration (Sartorius, Vivacell 100) and then electrophoresis.24
2.5 Ultrasound assisted enzymatic hydrolysis
Ultrasound assisted enzymatic hydrolysis (UAEH) of SCB was carried out by cellulase from T. reesei. The pretreated SCB (5 g) was added into 250 mL Erlenmeyer flask containing 100 mL of distilled water (pH 4.8). Approximately, 1.4 mL of partially purified enzyme (109 FPU mL−1 FPase, 885 IU mL−1 of CMCase, 420 IU mL−1 of β-glucosidase and 6875 IU mL−1 of xylanase) was added into the reaction mixture and the flaks were subjected to ultrasound irradiation for every 30 min of incubation at 45 °C ± 1. The effect of important parameters such as amplitude (20, 60 and 100%) and sonication time (10, 20 and 30 seconds) on activity and structural properties of enzyme, and hydrolysis were investigated after 12 h of incubation. Enzymatic hydrolysis with commercial cellulase was carried out for comparative analysis. The pretreated SCB (5 g) was added into 250 mL Erlenmeyer flask containing 100 mL of 100 mM sodium citrate buffer (pH 4.8). A mixture of cellulase and β-glucosidase (Sisco Research Laboratory (SRL), India) was added with an approximate activity of 30 FPU g−1 dry biomass and 60 CBU g−1 dry biomass, respectively. The reaction mixture was incubated in a shaking incubator at 50 °C ± 1 and 200 rpm for 26 h.11 The hydrolysis at 4 L level was carried out in a 7 L sonication beaker containing media, substrate and enzyme. The composition and conditions maintained were as outlined in flask experiments, whereas the power of ultrasound (% amplitude) and treatment time (s) in hydrolysis process were maintained at optimum level. The conversion factors used for polysaccharides to hexose and pentose sugars were 1.111 and 1.136 g g−1, respectively.1 The sugar hydrolysate obtained from flask and scale up experiments were fermented in 250 mL Erlenmeyer flask and in a fermentor (Biostat Cplus, Sartorius) respectively with the addition of media components (g L−1); 5 g peptone, 3 g yeast extract, 0.025 g CaCl2, 0.025 g MgCl2 and 0.25 g KH2PO4. The initial pH of the medium was adjusted to 5.5 by adding 2 M HCl for flask experiments, whereas sterile 2 M HCl and 2 M NaOH were used in fermentor for maintaining pH at 5.5. The contents were inoculated with 12 h old seed culture of S. cerevisiae at 30 ± 1 °C and 150 rpm for 42 h under sterile condition. At the end of fermentation, microbial growth and ethanol production were measured and the theoretical factor 0.511 g g−1 was used for the conversion.1
2.6 Ultrasound assisted simultaneous saccharification and fermentation
Ultrasound assisted simultaneous saccharification and fermentation (UASSF) was carried out by incubating T. reesei cellulase along with S. cerevisiae. The pretreated SCB (5 g) was placed in 250 mL Erlenmeyer flask with the addition of 0.5 g peptone, 0.3 g yeast extract, 0.0025 g CaCl2, 0.0025 g MgCl2 and 0.025 g KH2PO4, and the volume was made to 100 mL using distilled water. Initial pH of the medium was adjusted to 5.0 by 2 M HCl and it was autoclaved separately at 121 °C for 15 min. The cellulase cocktail was added (1.4 mL) along with 6% (v/v) of 12 h old S. cerevisiae and incubated at 37 ± 1 °C for 42 h fermentation. To compare the effectiveness of the present study, commercial cellulase was used for hydrolysis. A mixture of commercial cellulase and β-glucosidase (Sisco Research Laboratory (SRL), India) was added with an approximate activity of 30 FPU g−1 and 60 CBU g−1 of dry biomass instead of enzyme extract from T. reesei.11 The medium was inoculated with 6% (v/v) of 12 h old seed culture of S. cerevisiae and incubated at 37 ± 1 °C for 42 h. To analyse the potential in large scale production, the scale up studies were performed in the same ultrasonicator at 4 L level. The substrate concentration, enzyme concentration and media composition were maintained as outlined in flask experiments. In all experiments, the contents were subjected to 30 seconds ultrasound irradiation for every 30 minutes of incubation under sterile condition. Samples withdrawn at regular time intervals were subjected to ethanol and cell count measurements and the conversion factor used for cellulose to ethanol was 0.568 g g−1.
2.7 Analytical methods
The morphological differences of SCB biomass by various treatments were examined using scanning electron microscopy images (SEM, JEOL Ltd, Tokyo, Japan). The crystalline nature of the SCB was analysed using a Rigaku RINT-TTR3 X-ray diffractometer (Rigaku Co., Tokyo, Japan). The nickel filtered Cu Kα radiation (λ = 0.1542 nm) was applied at 50 kV and 30 mA. Samples were scanned over the range of 2θ = 5–50° and the crystallinity index (CrI) were determined using eqn (1).25| |
 | (1) |
where, Icrystalline = intensity at 22° and Iamorphous = intensity at 18.8°.
To determine the changes in the functional groups of SCB at various treatments, Fourier-transform infrared spectroscopy (FTIR) analyser (Perkin-Elmer FTIR Spectrophotometer 2000 series) was used with detector range at 4 cm−1 resolution and 25 scan per sample. The pellets were prepared using 2 mg of dried SCB sample and 200 mg of KBr. The spectra were recorded between 4000 and 550 cm−1.
The amount of total reducing sugars was estimated by DNS (3,5-dinitrosalicylic acid) method.26 Hemicellulose, cellulose, lignin and ash contents were estimated by detergent extraction methods.27 Concentrations of glucose, xylose, arabinose, acetic acid and furfural were analysed by high performance liquid chromatography LC-10AD (Shimadzu) as outlined in NREL protocol.28 The ethanol content was analysed using gas chromatography (GC-2014 Shimadzu) as outlined in NREL protocol.28 Protein content was analysed using Lowry method.29
The enzyme extracts were used to determine filter paper (FPase), carboxymethyl cellulase (CMCase), β-glucosidase and xylanase activities.30 One unit of activity (U) is defined as the amount of one μmol of product formed per minute under standard assay conditions.
The effect of power of ultrasound on cellulase was analysed by structural characterization of endo-glucanase, cellobiohydrolase and β-glucosidase using circular dichroism (CD) spectroscopy. Purified individual proteins (0.1 mg protein per mL) were subjected to 30 seconds ultrasound irradiation for every 30 minutes of incubation. The time duration and % amplitude was set as described in enzyme production, hydrolysis and fermentation experiments, respectively. The SDS-PAGE was done as described previously,24 while the native PAGE was carried out by following the same protocol without the addition of SDS. Far-UV CD spectra were measured with spectropolarimeter (Jasco J-810, Japan) at 190–250 nm wavelength regions.31 The average values of three scans were used as a mean residue ellipticity [θ] (deg cm2 dmol−1) and the scans were analysed for secondary structure prediction using the K2D3 Algorithm.32
2.8 Statistical analysis
All experiments were performed in triplicate and the average values are reported. The average and standard deviation values were calculated using the respective functions (AVERAGE, STDEV) available in Microsoft Excel and the maximum difference among the three values was less than 5% of the mean. Statistical significances from the control experiment was evaluated using t-test comparisons at α level of 0.05 (P < 0.05).
3. Results and discussion
3.1 SCB composition before and after pretreatment
The composition of raw SCB (before pretreatment) was 36% cellulose, 27% hemicellulose, 17% lignin and 20% other components. After the pretreatment, the composition was 45% cellulose, 26% hemicellulose (16% xylan and 6% arabinan), 5% lignin and 24% other components. Taking into account the decrease in raw SCB biomass of about 20% after pretreatment, the pretreatment effectively reduced the hemicellulose by 21%, w/w of actual hemicellulose, and lignin by 75%, w/w of actual lignin.22
3.2 Ultrasound assisted enzyme production
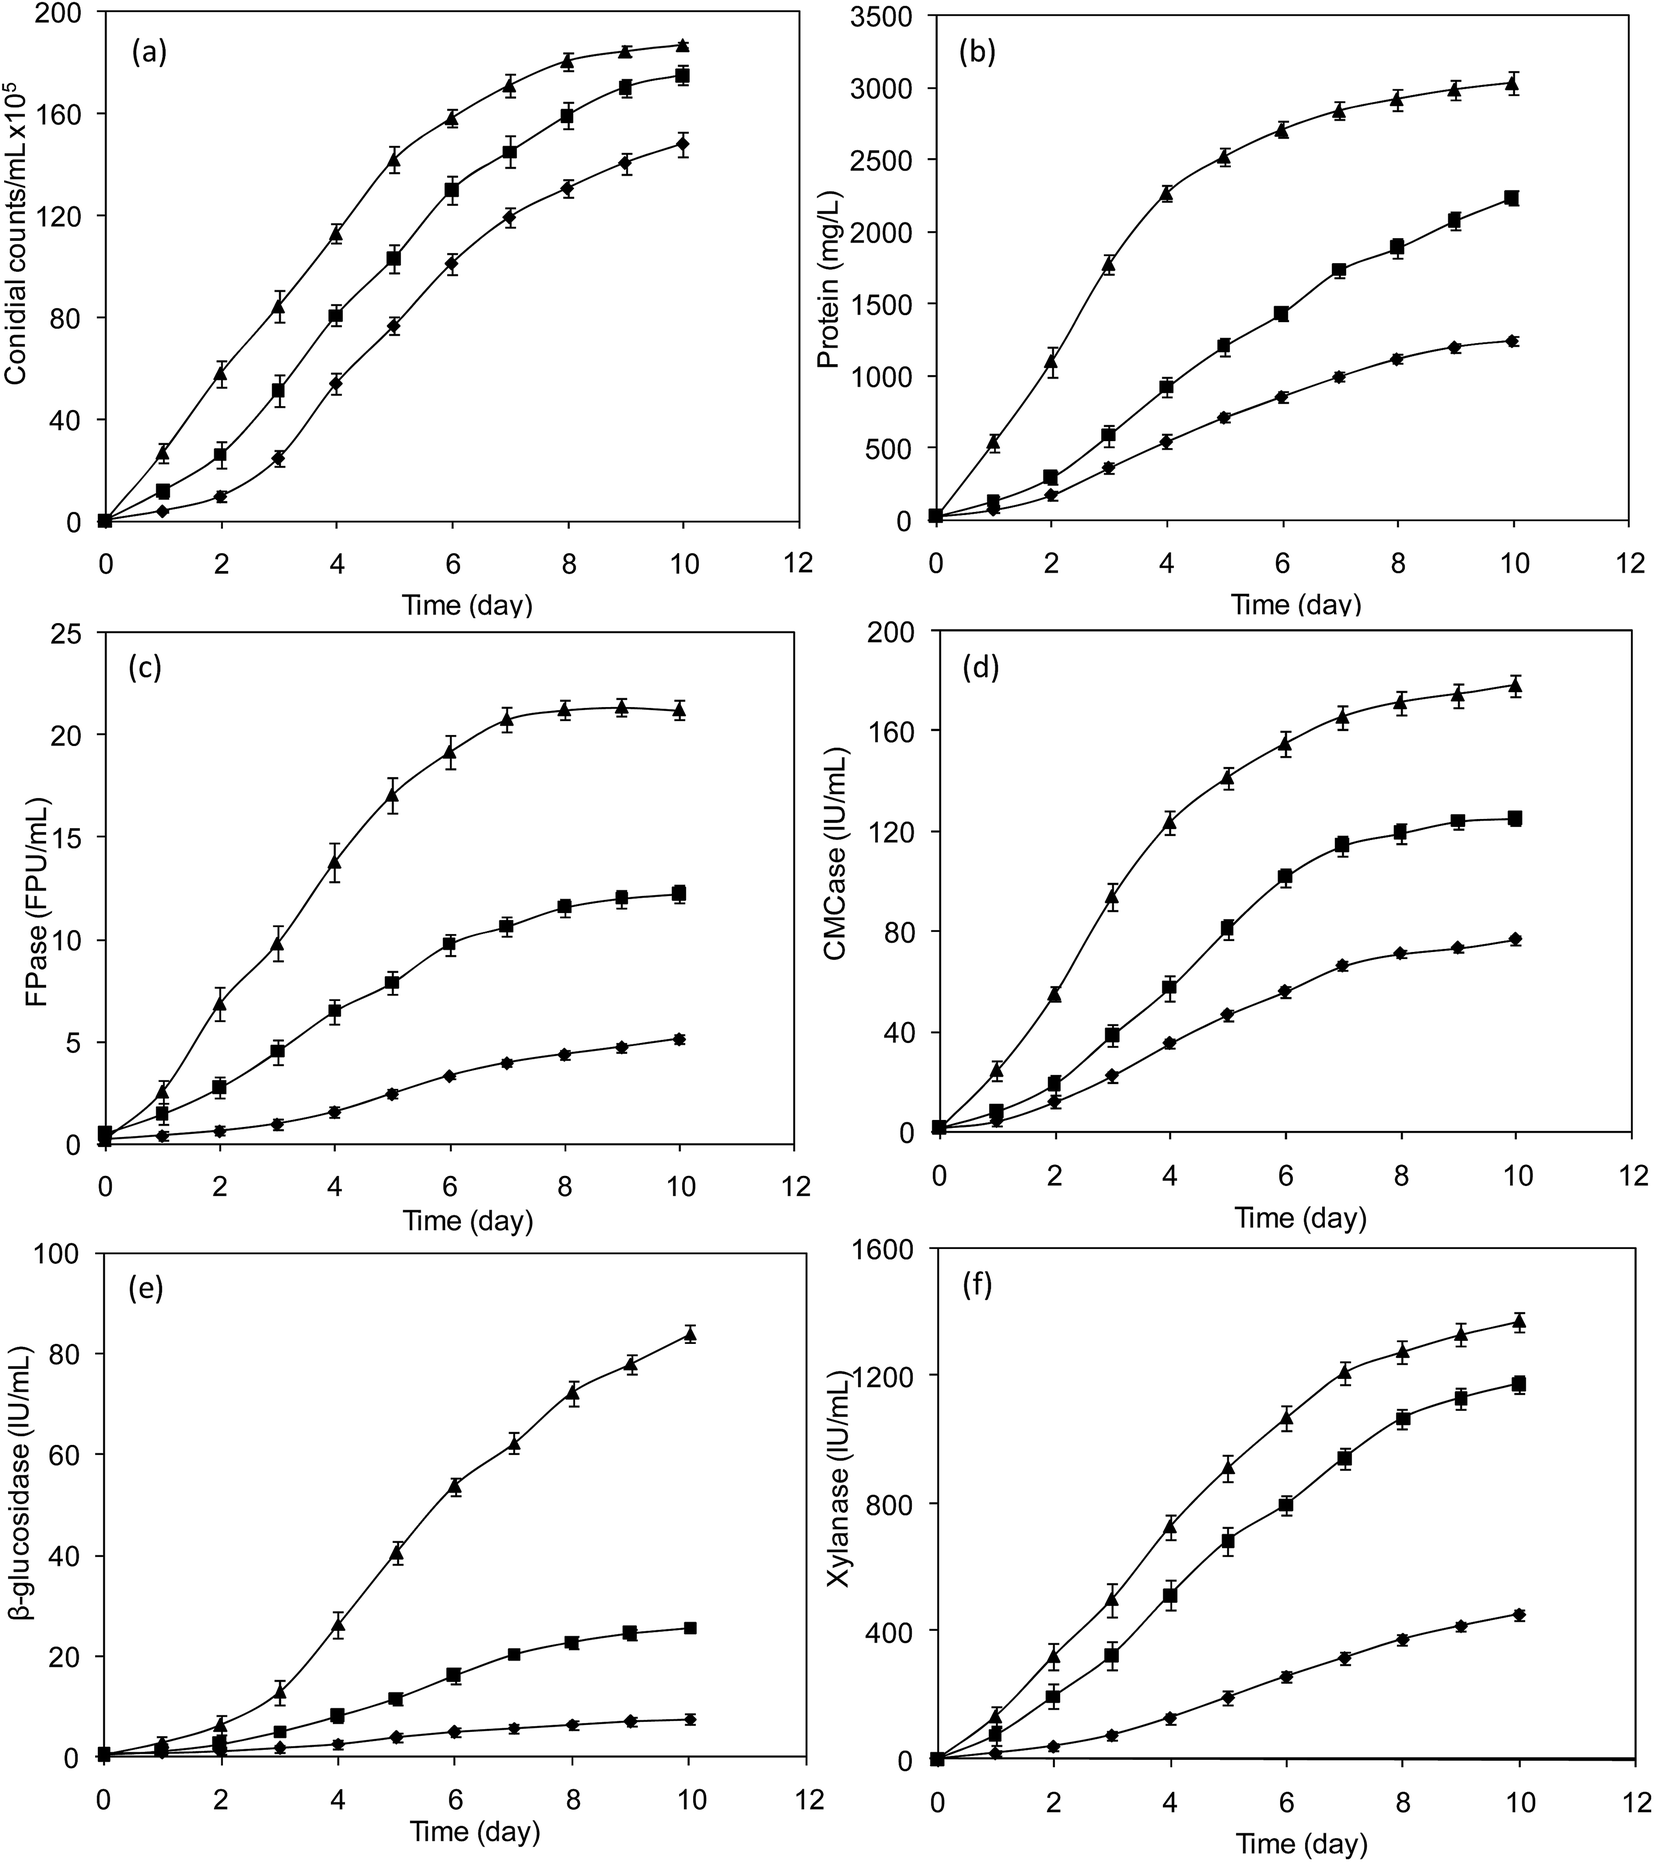
3.2.1 Improved growth rate. The ultrasound mediated collapse of bubbles produces turbulence and allows even faster transfer of nutrients, enzymes and bioproducts through cell wall.33,34 However, the heat and force may be intense and damage the cell wall itself. The intensity of ultrasound in biological applications must be analysed for harmful and beneficial effects of the cavitation. Low frequency ultrasound has been applied in many different contexts to enhance cell growth, allowing faster production of a wide array of enzymes and biomolecules.33,34 In the present study, the growth of T. reesei was increased with increase in incubation time and reached maximum of 148 × 105 conidial count per mL at 10 days of incubation. As can be seen in Fig. 1a, the conidia of T. reesei produced on SCB showed higher intensity (1.2 fold) of germination than the conidia generated on cellulose (control), which was particularly tangible in the culture grown under ultrasound treatment (1.3 fold). The application of ultrasound on T. reesei culture does not reduce the growth which means that the cell degradation has no significant influence on total conidial counts. Overall, ultrasound treatment increases the conidial numbers by enhancing the cellular fragmentation.
 |
| | Fig. 1 Effect of ultrasound on T. reesei growth (a), protein production (b), FPase activity (c), CMCase activity (d), β-glucosidase activity (e) and xylanase activity (f). Symbols; ▲-ultrasound assisted cultivation on SCB, ■-cultivation on SCB, ♦-cultivation on cellulose. Error bars represent standard errors; the results from the three experimental conditions were significantly different (p < 0.05). | |
3.2.2 Enhanced enzyme production. The in situ cellulase production was performed to improve the hydrolysability of T. reesei enzyme extract obtained from the substrate (SCB), which is used for saccharification and fermentation processes. The fungal cultivation on cellulose, SCB and SCB with ultrasound produced different concentrations of extracellular protein and enzyme activity according to the substrate and condition applied. As presented in Fig. 1b, the protein concentration was increased with increase in time and reached maximum concentration of 3 g L−1 in SCB treated with ultrasound, which is comparatively 1.4 fold higher than the production without ultrasound, and 2.5 fold higher than that of control (cellulose). The fungus T. reesei is known to produce multi-complex cellulases and xylanases, in the form of extracellular and intracellular protein. In this study, the enzyme production was measured in the form of FPase, CMCase and β-glucosidase, and xylanase activities (Fig. 1c–f). As can be seen in figures, the increase in incubation time increases the cellulase and xylanase production irrespective of substrate and the condition used. However, the ultrasound treatment produced maximum FPase, CMCase β-glucosidase and xylanase activities of 21 FPU mL−1, 178 U mL−1 and 84 U mL−1 and 1372 U mL−1, respectively. To analyse the productivity of enzymes at large scale, the scale up studies were performed. Interestingly, the growth rate of T. reesei was increased considerably from 187 × 105 to 192 × 105 CFU mL−1 in large scale production; however, the enzyme production was not much affected. In scale up studies, the enzyme production was 20.45 FPU mL−1 of FPase and 83.49 U mL−1 of β-glucosidase after 10 days. The results on scale up studies were quite reproducible with less than 5% deviation between flask and scale up experiments. It should be noted that the β-glucosidase produced by T. reesei with ultrasound treatment was much higher than that obtained under normal condition. During sonication, the occurrence of micro-streaming induced the rotation of organelles and circulation within vacuoles. Hence, microbial products synthesized are secreted effectively into the medium.9,19,20,35 Apart from enhancing extracellular-enzyme secretion through the fluid boundary layer around the cells, it is possible that the discharge of intracellular-enzymes into the medium by ultrasound mediated rupturing of cell wall. To find out whether the enzyme is intracellular or extracellular, SDS-PAGE of enzyme fraction from ultrasound assisted production was analysed. As shown in Fig. 2, T. reesei can secrete cellulases and xylanases, including five endo-glucanases (EC 3.2.1.4), two cellobiohydrolase (EC 3.2.1.74), two β-glucosidases (EC 3.2.1.21) and one xylanase (3.2.1.8) which act synergistically for the utilization of lignocellulosic substrate under normal condition. Extracellular fraction obtained from SCB culture (Fig. 2, Lane III) showed one endo-glucanase, one cellobiohydrolase, one β-glucosidase and one xylanase. The electrophoresis of intracellular extract (Fig. 2, Lane IV) showed one β-glucosidases activity. Most of the secreted enzymes molecular weights were determined and the values are comparable to the reported data.36–45 Moreover, to analyse the presence of cellulases in ultrasound assisted enzyme production, electrophoresis was carried out for the extracellular fraction. The results showed the presence of two endoglucanases, cellobiohydrolase, two β-glucosidases and one xylanase (Fig. 2, Lane II). The multiple enzymes, secreted in turn could apparently cooperate to enhance the hydrolysis of SCB.
 |
| | Fig. 2 SDS-PAGE analysis of cellulases secreted from T. reesei (Lane I: marker proteins, Lane II: supernatant from ultrasound assisted enzyme production, Lane III: extracellular protein fraction obtained from normal growth condition, Lane IV: intracellular protein fraction obtained from normal growth condition; molecular weight of protein sample: β-glucosidase I: 77 kDa, cellobiohydrolase I: 55 kDa, β-glucosidase II: 51 kDa, endoglucanase-I: 48 kDa, endoglucanase-IV: 35 kDa, xylanase: 23 kDa). | |
3.3 Ultrasound assisted enzymatic hydrolysis and fermentation
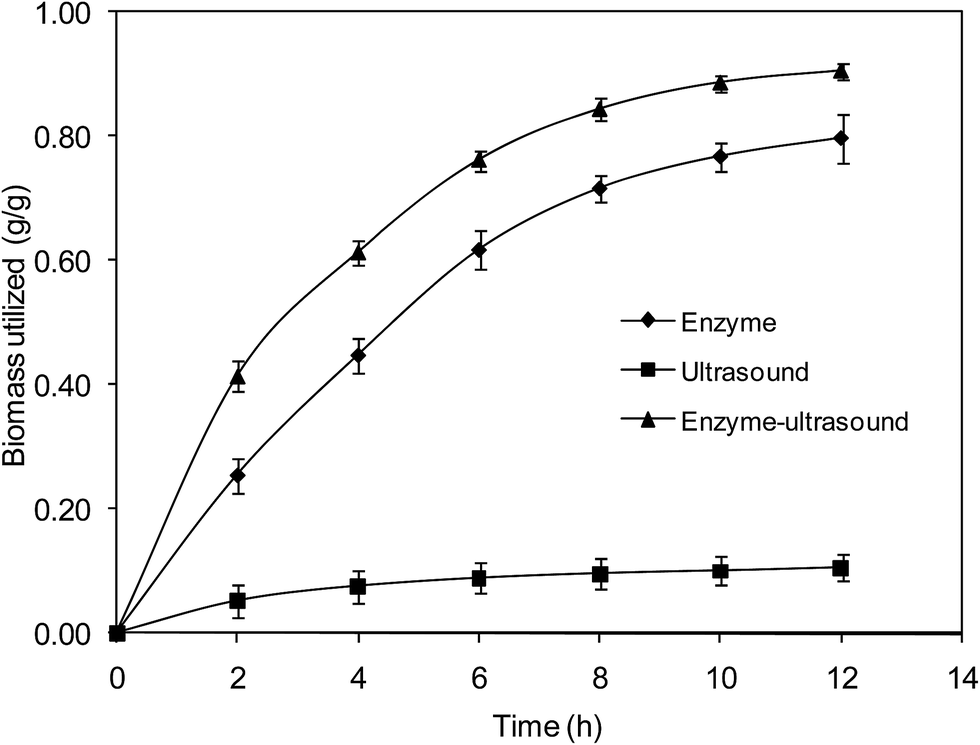
3.3.1 Destabilization of SCB. Biomass destabilization during hydrolysis process directly corresponds to the hydrolysis of polysaccharides. In many cases, redox enzymes have been used as co-enzyme to permeabilize the biomass. In this study, ultrasound has been used and their individual effect of ultrasound and enzyme on biomass was evaluated. The results on decrease in biomass quantity during enzyme treatment, ultrasound and ultrasound assisted enzymatic hydrolysis are shown in Fig. 3. The degradation of biomass was much higher in ultrasound assisted enzymatic hydrolysis compared to that of without-ultrasound, while most of the biomass was not utilized in ultrasound treatment alone. The SEM, XRD and FTIR were analysed for structural changes in SCB and the results showed that the ultrasound influenced significantly on modification of biomass (Fig. S1 and S2†).46,47
 |
| | Fig. 3 Effect of various hydrolysis conditions on biomass utilization for fermentable sugar production. Error bars represent standard errors; the results from the three experimental conditions were significantly different (p < 0.05). | |
3.3.2 Ultrasound on enzyme activity. Apart from the frequency of ultrasound, delivery of power is an essential parameter which influences the catalytic activity of cellulase. The effect of ultrasound power on FPase, CMCase, β-glucosidase and xylanase activities with respect to power of ultrasound and treatment time are shown in Table 1. All enzymes are stable under normal condition, whereas the ultrasound affects the activity. Increase in ultrasound power and time increases the stability of enzyme until mild power at 30 s, after which the activity was reduced considerably. Compared to β-glucosidase and xylanase, FPase and CMCase showed higher stability. Interestingly, the application of ultrasound increased the FPase and CMCase activity by 6 and 8%, respectively. This improvement is due to the spatial conformation of enzyme by oscillation of cavitation bubbles resulting in the increase of enzyme activity. Wang et al.48 observed 18.17% increased cellulase activity at 15 W, 24 kHz for 10 min whereas in the present study, FPase and CMCase activities were increased by 6 and 8% with ultrasound treatment of 24 kHz, 30 seconds, and 60% amplitude. On the other hand, β-glucosidase and xylanase show no improvement by ultrasound treatment. When the power of ultrasound exceeded 60% amplitude, the activity of cellulase decreased gradually with an increase in the ultrasonication time. The cavitation phenomenon during ultrasonication is responsible for the reduced cellulase activity. Ultrasound is reported to rupture the weak linkages such as hydrogen bonds or van der Waals interactions and induce the conformational modification in protein structure under extreme condition.18 Mild power and optimum irradiation time causes the stable cavitation. Additionally, ultrasound treatment for a long time increases the localized pressure and temperature leading to the generation of more free hydroxyl and hydrogen radicals. These free radicals interact with the protein structure causing its deactivation.18
Table 1 Effect of power of ultrasound on enzyme activitya
| Conditions |
Time (s) |
FPase |
CMCase |
β-Glucosidase |
Xylanase |
| FPU mL−1 |
FPU mg−1 |
IU mL−1 |
IU mg−1 |
IU mL−1 |
IU mg−1 |
IU mL−1 |
IU mg−1 |
| Values are mean of triplicates ± standard deviation. Values with different letters in each row [a (p > 0.1), b (0.05 < p ≤ 0.1), c (0.01 < p ≤ 0.05), d (0.01 < p ≤ 0.001), e (p ≤ 0.001)] represent the significant levels. |
| Control |
0 |
1.49 ± 0.05 |
7.5 ± 0.2 |
11.9 ± 1.2 |
59.7 ± 5.8 |
5.6 ± 0.3 |
28.1 ± 1.7 |
92.3 ± 1.5 |
461 ± 8 |
| Low power |
10 |
1.50 ± 0.04a |
7.5 ± 0.4a |
12.0 ± 0.7a |
60.2 ± 3.3a |
5.6 ± 0.4a |
27.9 ± 1.9a |
93.6 ± 2.6a |
468 ± 13a |
| Low power |
20 |
1.50 ± 0.04a |
7.5 ± 0.2a |
12.1 ± 0.7a |
60.7 ± 3.4a |
5.5 ± 0.4a |
27.7 ± 1.8a |
93.6 ± 2.6a |
468 ± 13a |
| Low power |
30 |
1.51 ± 0.09a |
7.5 ± 0.5a |
11.9 ± 1.0a |
59.7 ± 5.2a |
5.6 ± 0.3a |
27.8 ± 1.7a |
93.9 ± 3.0a |
470 ± 15a |
| Medium power |
10 |
1.50 ± 0.04a |
7.5 ± 0.2a |
12.0 ± 0.4a |
60.2 ± 1.8a |
5.6 ± 0.4a |
28.2 ± 1.9a |
93.4 ± 3.2a |
467 ± 16a |
| Medium power |
20 |
1.53 ± 0.03a |
7.6 ± 0.2a |
12.4 ± 0.4a |
62.0 ± 1.9a |
5.7 ± 0.4a |
28.6 ± 2.0a |
93.9 ± 3.4a |
470 ± 17a |
| Medium power |
30 |
1.57 ± 0.03b |
7.9 ± 0.1b |
12.8 ± 0.7a |
64.2 ± 3.3a |
5.7 ± 0.3a |
28.7 ± 1.6a |
94.4 ± 4.4a |
472 ± 22a |
| High power |
10 |
1.46 ± 0.03a |
7.3 ± 0.2a |
11.6 ± 0.9a |
57.9 ± 4.7a |
5.6 ± 0.5a |
27.8 ± 1.6a |
90.5 ± 2.8a |
453 ± 14a |
| High power |
20 |
1.44 ± 0.12a |
7.2 ± 0.7a |
11.4 ± 0.9a |
56.8 ± 4.6a |
5.4 ± 0.3a |
27.2 ± 1.4a |
89.2 ± 2.5a |
446 ± 13a |
| High power |
30 |
1.39 ± 0.04c |
6.9 ± 0.2c |
11.0 ± 1.0a |
54.9 ± 5.0a |
5.3 ± 0.1a |
26.3 ± 0.3a |
86.6 ± 2.0c |
433 ± 10c |
3.3.3 Secondary structural modification. The secondary structure of cellulase and xylanase enzymes was analysed by CD spectroscopy (Fig. S3†) and the structural analysis are presented in Table 2. The ellipticities were deviated with the application of ultrasound, which indicates a change in secondary structure of the enzyme. As shown in Fig. S3,† all four enzymes have a deep ellipticity whereas it was broadened with the application of ultrasound. Typical features of the CD spectrum for most of the enzymes are reduction of a positive peak at 192 nm, which denotes the slight extinction of β-sheet upon ultrasound treatment. As the power of ultrasound increases, the peak at 220 nm shifted towards positive wavelength, which suggests an increase in destabilization of α-helix structure (Fig. S3†). The contents of secondary structural components clearly shows reduction in α-helix and β-sheet at high power ultrasound compared to the control. However, the structural component was varied according to the power applied and enzyme used. At medium power ultrasound, the α-helix and β-sheet values were increased in endoglucanase, whereas the α-helix was increased and β-sheet values were decreased in xylanase, while the cellobiohydrolase and β-glucosidase do not show any significant changes (p > 0.05). Similarly, Borah et al.49 treated cellulase and cellobiase with ultrasound and reported the decrease in α-helix value from 32.7 to 19.1% and the increase in β-sheet value from 13.2 to 29.75% in cellulase, where cellobiase showed no remarkable variation (1.5% α-helix and 1% β-sheet) in native and ultrasound treated enzyme. The results clearly indicate the higher stability of cellobiohydrolase and β-glucosidase at medium ultrasound. On the other hand, the endoglucanase and xylanase show significant (p < 0.05) conformational changes upon medium power ultrasound treatment which directly influences the activity of enzyme (Table 1). The increase in β-sheet increases the active sites (β-barrel tunnels) for cellulose chains,50,51 while the decrease in α-helix can also increase the activity by exposing catalytic site.52 As a function of rearranging the secondary structure, the aggregation of protein has been reported even for cellulase enzyme complex.53 To analyse the aggregation of enzyme molecule, native electrophoresis was carried out and the results showed the formation of one single band in all cases suggesting the absence of aggregate formation (Fig. S4†). Unlike thermal denaturation, sonication process does not obliterate the active site of an enzyme and this has been clearly demonstrated for α-amylase and laccase.14,54 However, sonication-mediated deactivation of some enzymes, including alkaline protease and trypsin, was reported when high ultrasound power was used.14 This finding indicates that high power (100% amplitude) ultrasound highly reduces the α-helix and β-sheet by altering the enzyme structure leading to the reduction of enzyme activity.
Table 2 Effect of ultrasound power on secondary structure of endoglucanase, cellobiohydrolase, β-glucosidase and xylanasea
| Conditions |
Time (s) |
Endoglucanase |
Cellobiohydrolase |
β-Glucosidase |
Xylanase |
| α-Helix (%) |
β-Sheet (%) |
α-Helix (%) |
β-Sheet (%) |
α-Helix (%) |
β-Sheet (%) |
α-Helix (%) |
β-Sheet (%) |
| Values are mean of triplicates. Values with different letters in each row [a (p > 0.1), b (0.05 < p ≤ 0.1), c (0.01 < p ≤ 0.05), d (0.01 < p ≤ 0.001), e (p ≤ 0.001)] represent the significant levels. |
| Control |
0 |
31.1 ± 0.1 |
28.7 ± 0.0 |
38.3 ± 0.1 |
24.7 ± 0.1 |
52.8 ± 0.0 |
18.4 ± 0.0 |
42.0 ± 0.0 |
22.0 ± 0.0 |
| Low power |
10 |
32.4 ± 0.1e |
28.6 ± 0.1e |
38.4 ± 0.0a |
22.2 ± 0.0e |
52.9 ± 0.2a |
19.5 ± 0.1e |
42.1 ± 0.0a |
18.1 ± 0.0e |
| Low power |
20 |
33.6 ± 0.0e |
29.9 ± 0.0a |
39.6 ± 0.0e |
22.1 ± 0.0e |
52.7 ± 0.1a |
18.2 ± 0.0a |
43.2 ± 0.1e |
18.3 ± 0.0e |
| Low power |
30 |
31.2 ± 0.0a |
28.5 ± 0.1a |
39.7 ± 0.0e |
23.4 ± 0.0e |
51.6 ± 0.0a |
18.3 ± 0.0a |
44.5 ± 0.1e |
17.0 ± 0.2e |
| Medium power |
10 |
32.4 ± 0.2e |
28.7 ± 0.1a |
37.2 ± 0.2e |
23.5 ± 0.1e |
52.7 ± 0.0a |
19.5 ± 0.0e |
44.4 ± 0.0e |
16.8 ± 0.0e |
| Medium power |
20 |
32.3 ± 0.0e |
29.9 ± 0.2e |
38.4 ± 0.1a |
23.3 ± 0.1e |
52.8 ± 0.0a |
18.2 ± 0.0a |
44.3 ± 0.0a |
18.1 ± 0.0e |
| Medium power |
30 |
31.2 ± 0.0a |
28.6 ± 0.0a |
38.5 ± 0.1a |
23.4 ± 0.2e |
51.6 ± 0.1e |
18.1 ± 0.1a |
42.2 ± 0.0e |
18.2 ± 0.1e |
| High power |
10 |
32.4 ± 0.1e |
28.6 ± 0.1e |
37.2 ± 0.0e |
23.5 ± 0.0e |
46.9 ± 0.1e |
18.3 ± 0.0a |
43.3 ± 0.0a |
17.0 ± 0.0e |
| High power |
20 |
31.3 ± 0.1e |
24.7 ± 0.1e |
37.1 ± 0.0e |
22.0 ± 0.0e |
46.7 ± 0.1e |
16.8 ± 0.0e |
42.0 ± 0.1a |
15.7 ± 0.0e |
| High power |
30 |
30.0 ± 0.0a |
23.4 ± 0.0a |
36 ± 0.0e |
22.0 ± 0.0e |
45.5 ± 0.2e |
16.7 ± 0.0e |
42.1 ± 0.0e |
15.5 ± 0.0e |
3.3.4 Release of sugars and degradative products. To analyse the actual effect of ultrasound on enzymatic hydrolysis, ultrasound assisted enzymatic hydrolysis was performed. The concentrations of released glucose, xylose, arabinose and acetic acid in the liquid phase are shown in Table 3. The increase in power of ultrasound increases the sugar releases, which is due to the combined action of ultrasound and enzymes during hydrolysis. At higher power of ultrasound, the sugar releases were decreased due to the enzyme deactivation. The maximum glucose concentration observed for ultrasound assisted enzymatic hydrolysis is 23.5 g L−1 with the power consumption of 5.4 × 10³ J g−1, whereas the enzymatic hydrolysis (control) produced 19.7 g L−1, indicating that ultrasound improved the glucose production significantly (p < 0.05). Apart from glucose production, both enzymatic and ultrasound assisted enzymatic methods released xylose and arabinose, which is released from hemicelluloses by the action of hemicellulose hydrolysing enzymes including xylanase. To find an economically feasible process, the conversion of these hexose and pentose polymers into fermentable sugars is important. Therefore, the in situ production of enzyme favored both hexose and pentose releases. As the hydrolysis process is the most critical step in lignocellulosic ethanol production, it is important to measure the hydrolysability of biomass at large scale. The optimal conditions were extrapolated for scale up studies and the results are quite reproducible (Table 4). The maximum glucose concentration of 22.74 g L−1 was obtained which corresponds to the theoretical yield of 92.62% and the power requirement was 4.9 × 10² J g−1. On the other hand, the glucose yield for commercial enzymes and enzyme extract without ultrasound was 73.03 and 78.52%, respectively. Buaban et al.55 hydrolysed SCB using cellulase cocktail composed of Penicillium chrysogenum BCC4504 and Aspergillus flavus BCC7179 and they obtained xylose yield of 70.4% of theoretical yield. The improved xylose yield in the present study was due to the presence of xylanase at higher concentration.55 The enzymatic hydrolysis is known for specific production of sugar monomers, but the degradation of sugar is possible due to the formation of cavitation during pretreatment and ultrasound assisted hydrolysis. For this case, acetic acid and furfural formation were analysed and their maximum concentration observed were 399 mg L−1 and 109 mg L−1, respectively at medium power ultrasound. Acetic acid inhibits the microbial growth when its concentration is in the range of 4–10 g L−1, because it diffuses through the cell membrane and decreases intracellular pH causing adverse effects on the metabolism.56 The presence of furfural even at low concentration (3 g L−1) was reported to decrease the specific growth rate, as well as fermentation rate of S. cerevisiae.57 In the present study, the levels of inhibitors observed were much lower than the inhibitory levels, which confirm that the hydrolysate can be successfully used for the production of ethanol.58 Previously, various enzyme sources were used for hydrolysis studies and the results are presented in Table S1.†3,11,35,59–65 Kaar et al.59 used commercial cellulase enzyme with the intention of improving ethanol production. The maximum conversion of glucose was 41–67% at the concentration of 25 FPU g−1 and the corresponding ethanol production reported was 36–64% (Table S1†). Aswathy et al.11 determined the hydrolysability of water hyacinth with crude extract from T. reesei and Aspergillus niger. The availability of cellulases and β-glucosidase in hydrolysis medium improved the reducing sugar yield up to 71%.11 Recently, Gasparotto et al.65 used enzyme extract from T. reesei for ultrasound assisted hydrolysis of SCB and reported the sugar yield of 229 g kg−1 of biomass (Table S1†). The hydrolysis of dry bagasse by commercial cellulase (10 FPU g−1) and 30% (v/v) enzyme from Aspergillus oryzae P21C3 increased the glucose yield by 36%, and achieved 50.8% after 72 h incubation.3 The main drawback in hydrolysis using commercial cellulase is the lack of pentose sugar production. The findings in the present study indicate that the use of enzyme extracts from ultrasound mediated enzyme production is sufficient for the release of glucose monomer and the treatment with ultrasound improved saccharification effectively. The higher ethanol yield (88% of theoretical) in fermentation experiment confirms the compatibility of hydrolysate for fermentative ethanol production.
Table 3 Effect of enzymatic and ultrasound assisted enzymatic hydrolysis on hydrolysate composition
| Conditions |
Time (s) |
Ultrasound assisted enzymatic hydrolysis |
Fermentabilitya (%, g g−1) |
| Glucose (g L−1) |
Xylose (g L−1) |
Arabinose (g L−1) |
Acetic acid (mg L−1) |
Furfural (mg L−1) |
| Fermentability was determined without ultrasound which is calculated from the available glucose in hydrolysate. Values are mean of triplicates ± standard deviation. Values with different letters in each row [a (p > 0.1), b (0.05 < p ≤ 0.1), c (0.01 < p ≤ 0.05), d (0.01 < p ≤ 0.001), e (p ≤ 0.001)] represent the significant levels. |
| Control |
0 |
19.7 ± 0.4 |
7.3 ± 0.2 |
1.8 ± 0.1 |
375.7 ± 8.5 |
20.2 ± 6.0 |
87.5 ± 1.8 |
| Low power |
10 |
20.3 ± 0.4a |
7.4 ± 0.1a |
1.9 ± 0.2a |
387.0 ± 4.4a |
30.0 ± 2.2c |
88.3 ± 1.4a |
| Low power |
20 |
20.5 ± 0.4a |
7.4 ± 0.1a |
2.0 ± 0.1b |
393.7 ± 4.6a |
44.4 ± 3.2c |
89.8 ± 1.4a |
| Low power |
30 |
20.7 ± 0.4a |
7.5 ± 0.1a |
2.0 ± 0.1a |
388.7 ± 7.9a |
69.9 ± 3.8d |
89.8 ± 1.6a |
| Medium power |
10 |
21.1 ± 0.3b |
7.3 ± 0.1a |
2.1 ± 0.0d |
388.0 ± 5.5a |
48.5 ± 4.1c |
89.5 ± 3.9a |
| Medium power |
20 |
22.1 ± 0.3c |
7.6 ± 0.1a |
2.4 ± 0.3d |
386.7 ± 2.3a |
64.7 ± 2.8d |
89.6 ± 3.1a |
| Medium power |
30 |
23.5 ± 0.5d |
8.1 ± 0.2c |
2.8 ± 0.2e |
399.7 ± 5.5a |
109.3 ± 2.7e |
88.3 ± 4.6a |
| High power |
10 |
20.9 ± 0.4a |
7.5 ± 0.2a |
2.2 ± 0.3d |
377.0 ± 4.4a |
64.5 ± 3.8d |
85.2 ± 0.4a |
| High power |
20 |
18.8 ± 0.6a |
7.0 ± 0.3a |
1.8 ± 0.3a |
412.3 ± 6.9c |
94.5 ± 4.6e |
85.8 ± 2.8a |
| High power |
30 |
18.0 ± 0.6b |
6.7 ± 0.2c |
1.6 ± 0.1b |
427.3 ± 8.7c |
124.7 ± 3.8e |
87.2 ± 2.6a |
Table 4 Scale up studies on enzyme production, separate hydrolysis and fermentation and simultaneous saccharification and fermentation
| Process parameters |
Existing methoda |
Without ultrasound |
With ultrasound |
| Existing method indicates the use of cellulose in cellulase production and commercial cellulase in hydrolysis and fermentation. Results are obtained at 30 h of fermentation. Values are mean of triplicates. Values with different letters in each column [a (p > 0.1), b (0.05 < p ≤ 0.1), c (0.01 < p ≤ 0.05), d (0.01 < p ≤ 0.001), e (p ≤ 0.001)] represent the significant difference from existing method. |
| Enzyme production |
| FPase (FPU mL−1) |
5.46 ± 1.1 |
11.64 ± 1.9d |
20.45 ± 2.3e |
| CMCase (IU L−1) |
73.27 ± 4.0 |
128.12 ± 7.3e |
174.62 ± 9.6e |
| β-glucosidase (IU mL−1) |
7.42 ± 1.8 |
24.87 ± 1.2e |
83.49 ± 4.4e |
| Xylanase (IU mL−1) |
366 ± 19.7 |
1105 ± 54.4e |
1259 ± 59.8e |
| Growth rate (CFU mL−1) × 105 |
157.44 ± 8.6 |
178.38 ± 7.5c |
192.88 ± 9.3d |
|
| Separate hydrolysis and fermentation |
| Glucose (g L−1) |
17.93 ± 1.3 |
19.28 ± 1.8a |
22.74 ± 2.1c |
| Theoretical glucose yield (%) |
73.03 ± 5.1 |
78.52 ± 7.4a |
92.62 ± 8.4c |
| Productivity (g L−1 h−1) |
0.69 ± 0.05 |
0.74 ± 0.07a |
0.87 ± 0.1c |
| Yield per biomass (g g−1) |
0.36 ± 0.03 |
0.39 ± 0.04a |
0.45 ± 0.0b |
| Ethanol yield (%) |
92.8 ± 2.06 |
89.2 ± 4.53a |
91.05 ± 3.87a |
|
| Simultaneous saccharification and fermentationb |
| Ethanol (g L−1) |
8.00 ± 0.7 |
8.63 ± 0.9a |
11.44 ± 0.8d |
| Theoretical ethanol yield (%) |
63.73 ± 5.5 |
68.75 ± 7.2a |
91.14 ± 6.6d |
| Productivity (g L−1 h−1) |
0.27 ± 0.02 |
0.29 ± 0.03a |
0.38 ± 0.03d |
| Yield per biomass (g g−1) |
0.16 ± 0.01 |
0.17 ± 0.02a |
0.23 ± 0.02d |
| Growth rate (CFU mL−1) × 106 |
9.17 ± 0.43 |
8.81 ± 0.77a |
12.01 ± 1.1d |
3.4 Ultrasound assisted simultaneous saccharification and fermentation
3.4.1 Ultrasound on growth rate of yeast. The purpose of this research was to study the effect of ultrasound on combined hydrolysis and fermentation. In SSF experiments, the compatibility of ultrasound assisted hydrolysis conditions with growth of S. cerevisiae has to be determined to make the whole fermentation process effective. Microscopic observations were also performed for S. cerevisiae grown under ultrasound at different ultrasonic power. As shown in Fig. S5,† power of ultrasound determines the stability of cell wall. Microscopic studies revealed that the ultrasound punctured the cell at very high power (100% amplitude). Overall, the power of ultrasound at low and medium level does not rupture the cell, thus providing the positive effect of ultrasound on fermentation. S. cerevisiae growth during ultrasonic treatment with fermentation time were analysed and the results are shown in Fig. 4. The rate of cellular multiplication was increased exponentially with increase in treatment time as observed in normal SSF experiment. The maximum growth of 12.7 × 10⁶ CFU mL−1 was obtained at mild ultrasound treatment. It should be noted that the S. cerevisiae did not lose viability during the ultrasonication.
 |
| | Fig. 4 Effect of ultrasound on S. cerevisiae growth and ethanol production during simultaneous saccharification and fermentation. Error bars represent standard errors; experiments performed were significantly differed (p < 0.05). Abbreviations: SSF: simultaneous saccharification and fermentation; UASSF: ultrasound assisted simultaneous saccharification and fermentation. | |
3.4.2 Ultrasound on ethanol production. As the power of ultrasound influenced cellulase activity, the power of ultrasound is limited to medium level for 30 seconds in ultrasound assisted simultaneous saccharification and fermentation. The influence of ultrasound on ethanol production was analysed and the results are presented in Fig. 4. The increase in fermentation time increases the ethanol concentration in both UASSF and SSF experiments. However, the rate of fermentation was higher in UASSF than in SSF and most of the sugars were converted to ethanol at 30 h of fermentation with the maximum concentration of 11 g L−1. On the other hand, the SSF experiment without ultrasound showed only a gradual increase in ethanol concentration even at 36 h of fermentation and the maximum concentration obtained was 9 g L−1. In UASSF, the production of external cavity improved the accessibility of polysaccharides into enzyme active sites and also improved the cell membrane permeability which facilitated the substrate intake.Scale up studies were carried out with commercial enzyme (commercial cellulase and S. cerevisiae), SSF and UASSF experiments to analyse the potential of ultrasound in lignocellulosic ethanol production (Table 4). The ethanol concentration obtained in UASSF was 11.44 g L−1 with the power requirement of 12.3 × 10² J g−1 of biomass, whereas the commercial and SSF methods produced 8.0 and 8.63 g L−1 of ethanol, respectively at 30 h of fermentation. The productivity of ethanol and growth of S. cerevisiae were comparable to those of the flask experiments. As observed in T. reesei growth, S. cerevisiae showed higher growth in scale up studies compared to flask experiments. The use of cells in continuous system by feeding the biomass or by separating the cells from undigested biomass to facilitate the reuse of cells in another batch could be productive and inexpensive. The theoretical ethanol yield obtained in this study was 91.14%, which is compared with previously reported yield and the results are presented in Table S1.†21,55,66–71 Li et al.66 obtained similar yield when the corn stover was fermented using two-step process. In this two-step process, Escherichia coli and S. cerevisiae was used in step by step separately (Table S1†). The fermentation of SCB biomass using SSF process utilizing S. cerevisiae showed the ethanol yield of 18–28% of theoretical yield.69 Buaban et al.55 presented experimental results for conversion of SCB to ethanol utilizing cellulase extract from Penicillium crysosporium and Aspergillus flavus, and the strain Pichia stipitis was used for fermentation. The reported reducing sugar yield for SSF process was 52.90%. To convert released pentose sugars into ethanol, Park et al.67 used a mixed culture of S. cerevisiae and P. stipitis in SSF process and they obtained ethanol yield of 74% of theoretical yield. When using fed-batch SSF for the production of ethanol from corn stover, the reported maximum ethanol yield was 89.10%.70 Ofori-Boateng and Lee21 used UASSF for the fermentation of palm fronds to ethanol with continuous ultrasound treatment showing maximum ethanol yield of 57%. More recently, Singh et al.71 used UASSF for ethanol production from Parthenium hysterophorus and produced 15.62 g L−1 of ethanol. In the present study, 11.5 g L−1 of ethanol was produced due to the synergistic action of cellulase and xylanase enzymes. On the other hand, the utilization of pentose sugar using engineered strain for pentose sugar fermentation could facilitate the whole lignocellulose fermenting process. Moreover, a further increase in substrate concentration complemented with the required enzymes could make a lignocellulosic ethanol production process economically feasible.
4. Conclusion
The present study was performed to assess the potential of ultrasound in enzyme production, enzymatic hydrolysis and simultaneous saccharification and fermentation processes. Application of ultrasound at medium % amplitude and 30 seconds enhanced the enzyme production, hydrolysis and fermentation. At higher amplitude, the reduced cellulase activity and structural changes of enzyme were observed and it directly influences the yield of reducing sugar and ethanol. Under optimized conditions, the maximum reducing sugar and ethanol yield obtained were very high at 92–92.62% and 90–91.14%, respectively in both small and large scale experiments. The work presented in this study could give an important aspect on developing a potential lignocellulosic ethanol production process assisted by proper ultrasound treatment.
Acknowledgements
R. V. is thankful to the Graduate School and Faculty of Science, Chulalongkorn University (CU), for post-doctoral fellowship from Rachadaphiseksomphot Endowment Fund. A. I. acknowledges the research grants from CU on the Frontier Research Energy Cluster (CU-59-048-EN) and from Thailand Research Fund (IRG 578008).
References
- A. Demirbas, Energy Sources, 2005, 27, 327–337 CrossRef CAS.
- J. D. Wright, Chem. Eng. Prog., 1988, 84, 62–74 CAS.
- C. M. P. Braga, P. Delabona, S. Da Lima, S. D. J. Da, D. A. A. Paixao, J. G. Pradella and C. S. Da Farinas, Bioresour. Technol., 2014, 170, 316–324 CrossRef CAS PubMed.
- J. Soderstrom, L. Pilcher, M. Galbe and G. Zacchi, Biomass Bioenergy, 2003, 24, 475–486 CrossRef CAS.
- S. X. Chin, C. H. Chia, Z. Fang, S. Zakaria, X. K. Li and F. Zhang, Energy Fuels, 2014, 28, 2589–2597 CrossRef CAS.
- B. C. Bussamra, S. Freitas and A. C. da Costa, Bioresour. Technol., 2015, 187, 173–181 CrossRef CAS PubMed.
- J. Perez, J. Munoz-Dorado, T. de la Rubia and J. Martinez, Int. Microbiol., 2002, 5, 53–63 CrossRef CAS PubMed.
- A. K. Chandel, E. S. Chan, R. Rudravaram, M. L. Narasu, L. V. Rao and P. Ravindra, Biotechnol. Mol. Biol. Rev., 2007, 2, 014–032 Search PubMed.
- Q. Z. Zhang and W. M. Cai, Biomass Bioenergy, 2008, 32, 1130–1135 CrossRef CAS.
- R. K. Sukumaran, R. R. Singhania, G. M. Mathew and A. Pandey, Renewable Energy, 2009, 34, 421–424 CrossRef CAS.
- U. S. Aswathy, R. K. Sukumaran, G. L. Devi, K. P. Rajasree, R. R. Singhania and A. Pandey, Bioresour. Technol., 2010, 10, 925–930 CrossRef PubMed.
- R. Kumar and C. E. Wyman, Bioresour. Technol., 2009, 100, 4203–4213 CrossRef CAS PubMed.
- Z. V. Rachinskaya, E. I. Karasyova and D. I. Metelitza, Appl. Biochem. Microbiol., 2004, 40, 120–128 CrossRef CAS.
- C. Bosto, C. J. Silva, G. Gubitz and A. Cavaco-Paulo, Ultrason. Sonochem., 2007, 14, 355–362 CrossRef PubMed.
- E. Rokhina, P. Lens and J. Virkutyte, Trends Biotechnol., 2009, 27(5), 298–306 CrossRef CAS PubMed.
- F. I. Braginskaya, E. A. Zaitzeva, O. M. Zorina, O. M. Poltorak, E. S. Chukra and F. Dunn, Radiat. Environ. Biophys., 1990, 29, 47–56 CrossRef CAS PubMed.
- Y. Hoshino, T. Kawasaki and Y. Okahata, Biomacromolecules, 2006, 7, 682–685 CrossRef CAS PubMed.
- L. Gebicka and J. L. Gekicki, J. Enzyme Inhib., 1997, 12, 133–141 CrossRef CAS PubMed.
- Y. Xiao, Q. Wu, Y. Cai and X. Lin, Carbohydr. Res., 2005, 340, 2097–2103 CrossRef CAS PubMed.
- M. Yaldagard, S. A. Mortazavi and F. Tabatabaie, Korean J. Chem. Eng., 2008, 25, 517–523 CrossRef CAS.
- C. Ofori-Boateng and K. T. Lee, Fuel, 2014, 119, 285–291 CrossRef CAS.
- R. Velmurugan and K. Muthukumar, Bioresour. Technol., 2012, 112, 293–299 CrossRef CAS PubMed.
- D. S. Chahal, S. McGuire, H. Pikor and G. Noble, Biomass, 1982, 2, 127–137 CrossRef CAS.
- R. Velmurugan and K. Muthukumar, Biochem. Eng. J., 2012, 63, 1–9 CrossRef CAS.
- L. Segal, J. J. Creely, J. A. E. Martin and C. M. Conrad, Text. Res. J., 1959, 29, 786–794 CrossRef CAS.
- G. L. Miller, Ann. Chem., 1959, 31, 426–428 CrossRef CAS.
- H. K. Goering and P. J. Van soest, Agriculture Handbook, United States Department of Agriculture, U.S. Government Printing Office, Washington, DC, 1970, pp. 387–598 Search PubMed.
- A. Sluiter, B. Hames, R. Ruiz, C. Scarlata, J. Sluiter and D. Templeton, Technical Report NREL/TP-510-42623, Golden, CO, 2008 Search PubMed.
- O. H. Lowry, N. J. Rosebrough, A. L. Farr and R. J. Randall, J. Biol. Chem., 1951, 193, 265–275 CAS.
- T. K. Ghose, Pure Appl. Chem., 1987, 59, 257–268 CAS.
- J. Xiang, J. B. Fan, N. Chen, J. Chen and Y. Liang, Colloids Surf., B, 2006, 49, 175–180 CrossRef CAS PubMed.
- C. Louis-Jeune, M. A. Andrade-Navarro and C. Perez-Iratxeta, Proteins: Struct., Funct., Bioinf., 2012, 80, 374–381 CrossRef CAS PubMed.
- J. H. Yoon, E. Y. Roh, S. Shin, N. H. Jung, E. Y. Song, D. S. Lee, K. S. Han, J. S. Kim, B. J. Kim, H. W. Jeon and K. S. Yoon, Biotechnol. Lett., 2009, 31, 329–335 CrossRef CAS PubMed.
- Y. Kobayashi, D. Sakai, T. Iwashina, S. Iwabuchi and J. Mochida, Eur. Cells Mater., 2009, 17, 15–22 CAS.
- F. Yang, L. Li, Q. Li, W. Tan and W. X. Xian, Carbohydr. Polym., 2010, 81, 311–316 CrossRef CAS.
- R. L. Mach, Ph.D. thesis, Institute of Biochemistry and Technology, 1993.
- S. Shoemaker, V. Schweickart, M. Ladner, D. Gelfand, S. Kwok, K. Myambo and M. Innis, Bio/Technology, 1983, 1, 691–696 CrossRef CAS.
- S. Takashima, A. Nakamura, M. Hidaka, H. Masaki and T. Uozumi, J. Biochem., 1993, 125, 728–736 CrossRef.
- T. T. Teeri, P. Lehtovaara, S. Kauppinen, I. Salovuori and J. Knowles, Gene, 1987, 51, 43–52 CrossRef CAS PubMed.
- M. Penttilae, P. Lehtovaara, H. Nevalainen, R. Bhikhabhai and J. K. C. Knowles, Gene, 1986, 45, 253–263 CrossRef.
- M. Saloheimo, P. Lehtovaara, M. Penttilae, T. T. Teeri, J. Staahlberg, G. Johansson, G. Pettersson, M. Clayssens, P. Tomme and J. K. C. Knowles, Gene, 1988, 63, 11–21 CrossRef CAS PubMed.
- M. Saloheimo, T. Nakari-Setaelae, M. Tenkanen and M. Penttilae, Eur. J. Biochem., 1997, 249, 584–591 CAS.
- P. K. Foreman, D. Brown, L. Dankmeyer, R. Dean, S. Diener, N. S. Dunn-Coleman, F. Goedegebuur, T. D. Houfek, G. J. England, A. S. Kelley, H. J. Meerman, T. Mitchell, C. Mitchinson, H. A. Olivares, P. J. M. Teunissen, J. Yao and M. Ward, J. Biol. Chem., 2003, 278, 31988–31997 CrossRef PubMed.
- A. Saloheimo, B. Henrissat, A. M. Hoffren, O. Teleman and M. Penttilae, Mol. Microbiol., 1994, 13, 219–228 CrossRef CAS PubMed.
- J. He, B. Yu, K. Zhang, X. Ding and D. Chen, BMC Biotechnol., 2009, 9, 56 CrossRef PubMed.
- X. F. Sun, Z. Jing, P. Fowler, Y. Wu and M. Rajaratnam, Ind. Crops Prod., 2011, 33, 588–598 CrossRef CAS.
- G. Ramadoss and K. Muthukumar, Chem. Eng. J., 2015, 260, 178–187 CrossRef CAS.
- Z. Wang, X. Lin, P. Li, J. Zhang, S. Wang and H. Ma, Bioresour. Technol., 2012, 117, 222–227 CrossRef CAS PubMed.
- A. J. Borah, M. Agarwal, M. Poudyal, A. Goyal and V. S. Moholkar, Bioresour. Technol., 2016, 213, 342–349 CrossRef CAS PubMed.
- G. Davies and B. Henrissat, Structure, 1995, 3, 853–859 CrossRef CAS PubMed.
- J. Rouvinen, T. Bergfors, T. Teeri, J. K. C. Knowles and T. A. Jones, Science, 1990, 249, 380–386 CAS.
- J. L. Bras, A. Cartmell, A. L. Carvalho, G. Verze, E. A. Bayer, Y. Vazana, M. A. Correia, J. A. Prates, S. Ratnaparkhe, A. B. Boraston, M. J. Romao, C. M. Fontes and H. J. Gilbert, Proc. Natl. Acad. Sci. U. S. A., 2011, 108, 5237–5242 CrossRef CAS PubMed.
- P. W. Goodenough, D. C. Clark, A. J. Durrant, H. J. Gilbert, G. P. Hazlewood and G. Waksman, FEBS Lett., 1991, 282, 355–358 CrossRef CAS PubMed.
- S. Avivi and A. Gedanken, Ultrason. Sonochem., 2007, 14, 1–5 CrossRef CAS PubMed.
- B. Buaban, H. Inoue, S. Yano, S. Tanapongpipat, V. Ruanglek, V. Champreda, R. Pichyangkura, S. Rengpipat and L. Eurwilaichitr, J. Biosci. Bioeng., 2010, 110, 18–25 CrossRef CAS PubMed.
- A. Rodriguez-Chong, J. A. Romirez, G. Garrote and M. Vazquez, J. Food Eng., 2004, 61, 143–152 CrossRef.
- E. Palmqvist, J. S. Almeida and B. Hahen-Hagerdal, Biotechnol. Bioeng., 1999, 62, 447–454 CrossRef CAS PubMed.
- S. Larsson, E. Palmqvist, B. Hahn-Hagerdal, C. Tengborg, K. Stenberg, G. Zacchi and N. Nilvebrant, Enzyme Microb. Technol., 1999, 24, 151–159 CrossRef CAS.
- W. E. Kaar, C. V. Gutierrez and C. M. Kinoshita, Biomass Bioenergy, 1998, 14, 277–287 CrossRef CAS.
- R. A. Silverstein, Y. Chen, R. R. Sharma-Shivappa, M. D. Boyette and J. Osborne, Bioresour. Technol., 2007, 98, 3000–3011 CrossRef CAS PubMed.
- M. Jeya, Y. W. Zhang, I. W. Kim and J. K. Lee, Bioresour. Technol., 2009, 100, 5155–5161 CrossRef CAS PubMed.
- A. K. Chandel, O. V. Singh, M. L. Narasu and L. V. RaO, New Biotechnol., 2011, 28(6), 593–599 CrossRef CAS PubMed.
- W. H. Chen, B. L. Pen, C. T. Yu and W. S. Hwang, Bioresour. Technol., 2011, 102, 2916–2924 CrossRef CAS PubMed.
- M. Han, Y. Kin, B. Chung and G. W. Choi, Korean J. Chem. Eng., 2011, 28(1), 119–125 CrossRef CAS.
- J. M. Gasparotto, L. B. Werle, E. L. Foletto, R. C. Kuhn, S. L. Jahn and M. A. Mazutti, Appl. Biochem. Biotechnol., 2015, 175, 560–572 CrossRef CAS PubMed.
- X. Li, T. H. Kim and N. P. Nghiem, Bioresour. Technol., 2010, 101, 5910–5916 CrossRef CAS PubMed.
- J. Y. Park, R. Shiroma, M. I. Al-Haq, Y. Zhang, M. Lke, Y. Arai-Sanoh, A. Ida, M. Kondo and K. Tokuyasu, Bioresour. Technol., 2010, 101, 6805–6811 CrossRef CAS PubMed.
- D. Scordia, S. L. Cosentino and T. W. Jeffries, Bioresour. Technol., 2010, 101, 5358–5365 CrossRef CAS PubMed.
- B. Ewanick and R. Bura, Bioresour. Technol., 2011, 102, 2651–2658 CrossRef PubMed.
- C. T. Buruiana, C. Vizireanu, G. Garrote and J. C. Parajo, Energy Fuels, 2014, 28(2), 1158–1165 CrossRef CAS.
- S. Singh, M. Agarwal, S. Sharma, A. Goyal and V. S. Moholkar, Ultrason. Sonochem., 2015, 26, 249–256 CrossRef CAS PubMed.
Footnote |
| † Electronic supplementary information (ESI) available. See DOI: 10.1039/c6ra17792a |
|
| This journal is © The Royal Society of Chemistry 2016 |
Click here to see how this site uses Cookies. View our privacy policy here.