Direct bonding of liquid crystal polymer to glass

Arif Ul Alam, Yiheng Qin, Matiar M. R. Howlader* and M. Jamal Deen
Department of Electrical and Computer Engineering, McMaster University, 1280 Main Street West, Hamilton, ON L8S 4K1, Canada. E-mail: mrhowlader@ece.mcmaster.ca

Received 11th July 2016 , Accepted 4th November 2016

First published on 4th November 2016


Abstract

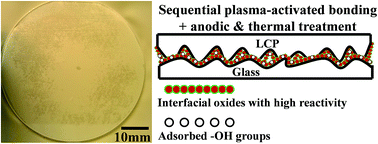
In this paper, a direct bonding technology for liquid crystal polymer (LCP) and glass is developed for the first time by using sequential plasma-activated bonding which is based on physical sputtering followed by the formation of chemically reactive surfaces. The sequential-plasma-activated surfaces of glass and LCP show high hydrophilicity with moderate roughness. The adhesion between the activated LCP and glass surfaces is governed by hydroxyl group-mediated interfacial Si–OH–C covalent bonds. The post-bonding anodic treatment increases the amount of interfacial oxides by generating more singly-bonded oxides on the glass surface. The post-bonding thermal treatment rearranges the plasma-induced reactive sites and improves the conformal contact between the LCP and glass. A high bonding strength of 6.3 MPa is obtained between the LCP and glass when both anodic and thermal treatments are used. This simple and low-temperature direct bonding process for LCP and glass provides insights for future bonding between polymers and thin glass films.

1 Introduction

The integration of flexible and rigid materials, such as polymer and glass, is needed for the fabrication of large-area, transparent electronics,1 microfluidics,2 displays,3 implantable devices,4 and MEMS.5 Among these applications, microfluidic-based biomedical sensing systems are expected to have a high impact in lab-on-a-chip for micro-total-analysis systems applications.2 These integrated systems require filtration, fluid mixing,6 flow control, and sensing components to detect targeted biological species.7–10 The integration of such functional components with rigid materials and deformable polymeric materials would be easier to fabricate11 with the potential of enhanced features and performance. Many polymers possess tunable electrical conductivity, mechanical flexibility for pneumatic actuations, cellular adsorption and solvent compatibility. Among polymers, thermoplastic polymer, such as liquid crystal polymer (LCP) has a low moisture absorption coefficient (∼0.02%), exceptional chemical resistance, high mechanical strength, and good anti-fouling characteristics.12–14 Also, LCP is durable, amenable to micromachining processes, resistant to permeation of small molecules and stiffer than elastomers. These advantages facilitate micromachining of LCP to fabricate strain and flow sensors, and their integration with glass platform, for example, to create a microfluidic sensing system.5 Among rigid materials, glass is preferred as an easy-to-process substrate because of its low cost, biocompatibility, ease of surface modification, and high transparency.14–17 Also, glass has low background fluorescence, low nonspecific adsorption and it is not gas permeable. Therefore, glass and LCP can be a suitable combination of materials for the development of microfluidic systems that combine their advantages. However, mismatches in their surface roughnesses, coefficients of thermal expansion, brittleness and deformability, and hydrophilicity and reactivity of surfaces pose significant challenges in their integration for microfluidic-based biomedical sensing systems.

Existing technologies for the integration of LCP and glass include laser-assisted bonding, thermal lamination, and adhesive bonding techniques.5,18,19 However, these approaches require high temperature, high pressure and chemicals that increase the process complexity and cost. For example, the thermal lamination of LCP on glass in ref. 5 required a temperature of 260–270 °C and a high mechanical pressure of several hundred kPa. In ref. 8, LCP was melted at 280 °C using a laser and was bonded to silicon, LCP, and glass over a small area.18 It should be noted that many polymers are not suitable for high-temperature bonding processes because of their low glass transition temperatures. Also, adhesive bonding of LCP to silicon using epoxy-based intermediate layers resulted in high moisture absorption at the bonded interface.19 Therefore, a low-temperature, large-area, adhesive-free, and easy-to-process technology for the direct bonding of LCP to glass is important for preserving the intrinsic material properties and for the fabrication of an integrated system at low cost.

In order to overcome the challenges in the existing bonding technologies of LCP and glass described above, we propose a low-temperature, direct bonding method known as sequential plasma-activated bonding (SPAB). SPAB offers spontaneous bonding through sequential combination of physically sputtered (using reactive ion etching plasma) and chemically unstable surfaces (using microwave neutral radicals). It does not require any wet chemicals, adhesives, external forces and annealing steps to achieve integration of dissimilar materials with large lattice mismatch.20–22 Furthermore, it is suitable for the direct bonding of polymers with low glass-transition temperatures and there is little or no moisture absorption at the bonded interface. These are essential criteria for the integration of emerging microfluidic components in micro-total-analysis systems applications, especially when dealing with biological species. However, the integration potentials of SPAB for soft and rigid materials have not yet been investigated.

In this research, we report on a direct bonding process for LCP and glass using a sequential plasma-activated bonding (SPAB) method. We then improved the bonding strength by using post-bonding anodic and/or thermal treatments. The maximum processing temperature used was 200 °C, which is below the glass transition temperature of LCP (240 °C). To analyze the bonding mechanisms, we examined the wetting properties and surface morphologies of as-received and plasma-activated surfaces, and assessed the effects of plasma activation, anodic treatment, and thermal treatment on the bonding strength. The thermal and anodic post-bonding treatments improved the bonding strength. This proof-of-concept study on the direct bonding of LCP to thick (500 μm) glass wafers provides insights for future bonding between polymers and thin glass films. Thin glass accommodates external bonding forces more easily that thicker ones, which results in better contact and adhesion to LCP.23 The proposed low-temperature bonding processes for LCP and glass show great potential in the development of systems, such as lab-on-a-chip.

2 Experimental procedures

2.1 Materials and methods

The proprietary LCP films (50 μm thick) used in this study were from Vecstar (CTX-100). Fig. 1 shows the chemical structure of CTX100, which is a block copolymer with repeated units of para-hydroxyl benzoic acid (PHB) and bi-oxide 6-naptholine acids (BON6).24 The two-inch glass wafers (500 μm thick) were from Schott US. The water contact angle measurements were conducted using a sessile drop method (drop shape analysis system DSA100, KRÜSS) with a 6 μL de-ionized water droplet. The average values were calculated from the measured contact angles every 2 seconds for 2 minutes. The surface roughness of LCP and glass was measured using a tapping mode atomic force microscope (AFM, Dimension Icon, Bruker) from which the root mean square surface roughness values were calculated. The defects at the substrate surfaces and bonding interfaces were characterized following the procedures presented in a previous report,25 using a scanning acoustic microscope (SAM, Sonoscans, GEN5™ C-SAMs) with a high frequency (230 MHz) transducer.
image file: c6ra17729h-f1.tif
Fig. 1 Schematic diagram of the chemical structure for Vecstar CTX100.

The bonded specimens were diced (Disco, DAD3240) into 10 mm × 10 mm pieces for tensile pulling tests. The bonding strength between LCP and glass was measured using a tensile pulling tester (Shimadzu, AG-X). The two sides of the bonded specimen were glued to the tensile jigs by Araldite® adhesives and the specimen was pulled apart at a speed of 1 mm min−1 until breaking. The real-time force data were recorded by the TRAPEZIUMX software. The chemical compositions at the bonding interface were characterized using X-ray photoelectron spectroscopy (XPS, JPS-9200, JEOL, Mg-α source, 10 keV, 15 mA). All specimens showed a charging effect due to the dielectric nature of the LCP and glass. Charge corrections were done using the carbon (C1s) peak. The attenuated total reflectance FTIR (FTIR-ATR) transmittance spectra were taken by a Bruker Platinum-ATR.

2.2 Bonding of LCP to glass

The SPAB process flow of LCP to glass is shown in Fig. 2 with a cross-sectional schematic for each step. The bonding process was carried out in a hybrid plasma bonder system (Fig. S1), which integrated the functionalities of plasma activation, reactive ion etching, anodic treatment, and thermal treatment.26 The processing started with the plasma activation of the LCP and glass surfaces by oxygen reactive ion etching (O2 RIE, 300 W, 60 s). After that, nitrogen microwave (N2 MW) plasma activation was carried at 2000 W with a background pressure of 100 Pa for 30 s. The plasma-activated surfaces of LCP and glass were then contacted under hand-applied pressure outside the vacuum chamber in a class 1000 clean room. The contacted specimen was cold-rolled under a pressure of 0.1 MPa to remove trapped air across the bonding interface. Further, an external pressure of 0.2 MPa was applied using the bonding head at 200 °C for 10 min (20 °C min−1 ramp rate). The bonded specimen at this stage is named as SPAB.
image file: c6ra17729h-f2.tif
Fig. 2 Process flow of Sequential Plasma Activated Bonding (SPAB) of LCP to glass.

After SPAB, three types of post-bonding treatments were performed to improve the bonding strength of LCP and glass.27–30 In the first approach, an anodic voltage of 1 kV was applied while maintaining an applied pressure of 0.2 MPa for 3 minutes (termed as SPAB + A). In this step, the glass was in contact with the cathode and the LCP was in contact with the anode. In the second approach, the bonded specimen was heated in air at 200 °C for 24 hours (termed as SPAB + H). In the third approach, the SPAB + A specimen was heated in air at 200 °C for 24 hours (termed as SPAB + A + H). The acronyms for different specimens, processes and results are shown in Tables 1 and 2.

Table 1 Pre-bonding characterization results
Acronym of specimen and process Description of acronym Contact angle [°] Surface roughness [nm]
LCP-AR As-received LCP 82 15
LCP-SPA Sequential plasma-activated LCP 4 20
Glass-AR As-received glass 30 0.5
Glass-SPA Sequential plasma-activated glass 4 5


Table 2 Bonding strength results before and after post-bonding treatments
Acronym of specimen and process Description of acronym Bonding strength [MPa]
SPAB Sequential plasma-activated bonding 4.1
SPAB + H Sequential plasma-activated bonding followed by thermal treatment 4.8
SPAB + A Sequential plasma-activated bonding followed by anodic treatment 5.5
SPAB + A + H Sequential plasma-activated bonding followed by anodic and thermal treatments 6.3


3 Results and discussion

3.1 Surface characterization of LCP and glass

3.1.1 Surface hydrophilicity. The hydrophilicity of the surfaces indicates surface energy, thus determining the quality of the bonding interface in direct bonding.31 The as-received LCP (LCP-AR) was highly hydrophobic with a contact angle of ∼82° (Table 1, Fig. S2). This behavior is attributed to the benzenes and naphthalene groups of LCP, which have low chemical affinity to hydroxyl groups.23 To increase the hydrophilicity, the LCP-AR was sequentially treated using O2 RIE and N2 MW plasma. The contact angle decreased to ∼4° as a result. The increased hydrophilicity of the sequential plasma-activated LCP (LCP-SPA) surface may be due to the plasma-induced dangling sites at the oxides and carbonyl groups on the LCP surface.32,33 The contact angle of the as-received glass (glass-AR), on the other hand, was 30° due to its surface oxides (Table 1, Fig. S2). The contact angle of the sequential plasma-activated glass surface (glass-SPA), however, was identical to that of the LCP-SPA (∼4°).
3.1.2 Surface roughness. In addition to surface hydrophilicity, the roughnesses of contact surfaces determine their intimate contact.17 The measured root-mean-square (RMS) roughnesses of the LCP-AR and LCP-SPA surfaces were 15 nm and 20 nm respectively (Table 1, Fig. 3(a) and (b)). The roughness of LCP-SPA increased to a higher value due to the etching process and/or ion bombardment during the plasma activation. Unlike O2 RIE, the N2 MW plasma contains neutral radicals that create chemically-reactive surfaces.26 On the other hand, the RMS roughnesses of the glass-AR and glass-SPA surfaces were 0.5 nm and 5 nm respectively (Table 1, Fig. 3(c) and (d)). Although a high surface roughness is unfavorable for direct bonding, the technology developed in this study minimizes the effects.
image file: c6ra17729h-f3.tif
Fig. 3 AFM images of the LCP and glass surfaces before and after sequential plasma activation. (a) LCP-AR; (b) LCP-SPA; (c) glass-AR; (d) glass-SPA.

3.2 Characterization of the bonding interface between LCP and glass

3.2.1 Bonding strength and imaging of bonding interfaces. The optical image of a bonded LCP–glass specimen in Fig. 4(a) reveals void-free bonded areas (circled areas) as well as areas with voids and defects (outside the circles). The specimen with interfacial voids (Fig. 4(b)) showed a low bonding strength, and the LCP was completely separated from glass. The voids might be caused by the non-uniform distribution of the bonding pressure and the large quantity of chemically reactive oxides that formed during low temperature oxygen-plasma activated bonding.34 Also, the high surface roughness and smaller thickness of the LCP with respect to the glass wafer might trap air at the bonding interface that forms voids. These voids can be avoided by using bonding heads that can apply uniform pressure over the entire contacting area of LCP–glass wafer. Roll-to-roll bonding technique may be used over the area to achieve void free bonding of LCP with thin glass film.23
image file: c6ra17729h-f4.tif
Fig. 4 (a) Optical image of the top-view of a bonded LCP–glass specimen. Circled areas show less interfacial voids than other areas; (b) a poorly bonded specimen with complete separation of the LCP from glass; (c) a strongly bonded specimen with bulk fractures of glass on LCP.

We excluded the effect of voids on the bonding outcome by measuring the bonding strength only from the void-free bonded area. Table 2 and Fig. S3 show the comparison of bonding strengths between bonded LCP–glass specimens that underwent different post-bonding treatments (i.e., SPAB + H, SPAB + A, SPAB + A + H). The SPAB + A + H specimen showed the highest bonding strength of 6.3 MPa. For this specimen, bulk fractures of glass were observed on LCP after the tensile pulling test, indicating mechanically robust interface (Fig. 4(c)).

The quality of the bonded interface between LCP and glass was also analyzed using SAM. The observed non-uniform surface topography of LCP (Fig. 5(a)) indicates its high surface roughness, which supports the AFM observation (Fig. 3). Fig. 5(a) also shows an imprint of a microfluidic channel (left side of the image) that was fabricated in the glass substrate by using a dicing saw before surface activation and bonding. The open-ended microfluidic channel was sealed between the LCP and glass, which can be used for microfluidic applications. In Fig. 5(b), the area in the solid circle represents the void-free bonding interface between LCP and glass. However, the area in the dashed circle represents the bonding interface with voids and defects. In this figure, the diced channel is not white in color (trapped by air) because water entered to the channel during SAM observation. Fig. 5(c) shows the glass substrate near the bonding interface. The white area represents the void-free bonded area and the area in the dashed circle is a defective bonded area.


image file: c6ra17729h-f5.tif
Fig. 5 SAM images with the focal plane at: (a) bottom of LCP; (b) LCP–glass bonding interface; (c) top of glass.
3.2.2 Elemental analysis of debonded LCP/glass interface using XPS. To gain insights into the role of the chemical species in the bonding mechanisms, we performed XPS analyses (as shown in Fig. 6) of the distribution of elements on the debonded surfaces (after tensile pulling test) and the as-received material surfaces. Fig. 6(a) shows the wide-scan XPS spectra of the LCP-AR and glass-AR surfaces, as well as the debonded LCP-SPAB and glass-SPAB surfaces. The LCP-AR spectra consist of a major C1s peak at 284 eV and an O1s peak at 535 eV. The LCP-SPAB spectra show peaks at similar binding energies but the O1s peak has a higher intensity. For glass-AR, the spectra consist of a major peak of O1s at 535 eV and three minor peaks of C1s, Si2p and Si2s at 284, 99 and 150 eV respectively. For glass-SPAB, the intensity of the Si peaks is lower than that in glass-AR, but the intensity of the C1s peak is higher. The narrow spectra of the dominant O1s and C1s peaks in glass and LCP respectively (Fig. 6(b) and (c)) are studied for quantitative analysis of chemical elements.
image file: c6ra17729h-f6.tif
Fig. 6 (a) The wide-scan XPS spectra of LCP and glass in as-received conditions and after debonding. (b) The O1s narrow-scan spectra and peak-fitting of the as-received and debonded glass surfaces. (c) The C1s narrow-scan spectra and peak-fitting of the as-received and debonded LCP surfaces. The peak of C–C/C–H, C–O, and O–C[double bond, length as m-dash]O is labeled as 1, 2, and 3, respectively.

The O1s narrow scan spectrum of glass-AR (Fig. 6(b(i))) shows a C–O peak and a O–C[double bond, length as m-dash]O peak at ∼533 eV and ∼531 eV, respectively. The C1s spectrum of LCP-AR (Fig. 6(c)(i)) shows a benzene-structured C–C/C–H peak at ∼284 eV (labeled as 1), a C–O peak at ∼286 eV (labeled as 2) that is 1–2 eV larger than the C–C peak, and a O–C[double bond, length as m-dash]O peak at ∼288 eV (labeled as 3).23 The curve fitting of the narrow scan spectra was performed using Gauss–Lorentz (70–30%) method.35 We deconvolved the curves into C–O and C[double bond, length as m-dash]O peaks due to their role in covalent bonding between glass and LCP, as discussed later in Section 3.3. The deconvolved curves show broadening characteristics which may be due to the formation of carbon-oxy-nitride (CNO) functional species through the attachment of nitrogen from MW radicals plasma treatment with the aromatic polymer chain of LCP.24,26,36 Further investigation is needed in order to identify the role of nitrogen radicals in the LCP/glass bonding.

After sequential plasma activation and post-bonding heating, the surfaces of glass-SPAB and glass-SPAB + H showed a decrease in the area of the O–C[double bond, length as m-dash]O peak and an increase in the area of the C–O peak (Fig. 6(b(ii–iii)) and S4). Also, the overall area of the O1s peak was increased. The increase in the area of the C–O peak indicates a larger amount of singly bonded oxides, created by the sequential plasma activation.37,38 These C–O groups are highly reactive and they accelerate the bonding between the contacting surfaces. In addition, glass-SPAB + A and glass-SPAB + A + H specimens increase the area of the O–C[double bond, length as m-dash]O peak, as shown in Fig. 6(b(iv–v)) and S4.

The deconvolution results of the C1s spectrum of the debonded LCP surfaces are shown in Fig. 6(c). The overall area of the C1s peak in LCP-SPAB, LCP-SPAB + H, LCP-SPAB + A, and LCP-SPAB + A + H is larger than that in LCP-AR (Fig. 6(c(ii–v))). Also, the area of the C–C/C–H peak decreases for LCP-SPAB and LCP-SPAB + H, which corresponds to the larger amount of oxides on the glass surface. However, the C–O peak disappears when bonded LCP and glass are anodically treated (LCP-SPAB + A and LCP-SPAB + A + H), as shown in Fig. 6(c(iv–v)) and S4. This phenomenon corresponds to the increase of the amount of O–C[double bond, length as m-dash]O bonds on the glass surface, shown in Fig. 6(b(iv–v)).

3.3 Mechanisms of the SPAB of LCP to glass

In general, a strong bond between two contacted hydrophilic surfaces is easier using surfaces with lower roughness and higher chemical reactivity.17 The bonding strength can be further enhanced by applying thermal treatment, mechanical pressure, and/or electric-field-induced electrostatic force to the bonding interface.26 Fig. 7 and S5 show the schematic diagrams for explaining the bonding mechanisms between LCP and glass. The effects of surface activation, anodic treatment, and thermal treatment are discussed in the following subsections.
image file: c6ra17729h-f7.tif
Fig. 7 The mechanisms of SPAB of LCP to glass. (a) Schematic of the contacting surfaces between LCP and glass after SPAB. (b–e) The variation of the percentages of interfacial chemical bonds in different conditions: (b) after SPAB; (c) after SPAB and anodic treatment; (d) after SPAB and thermal treatment; (e) after SPAB and both anodic and thermal treatments.
3.3.1 Role of sequential plasma activation. In the first step of the activation, O2 RIE removed native oxides and contaminants from the LCP and glass surfaces, and generated new oxide layers (ESI Fig. S5(a)–(c)). In the second step, the N2 MW plasma treatment resulted in reactive surfaces on the LCP and glass (Fig. S5(d) and (e)). The significant enhancement of the surface energy of LCP and glass in the sequential plasma activation was confirmed by the contact angle measurements (Table 1). The sequentially-activated surfaces were contacted in the clean room atmosphere. When the activated surfaces were exposed to ambient air, water molecules in the air were adsorbed onto the reactive surfaces and formed surface –OH groups (Fig. S5(d)). These –OH groups initiated the adhesion between the LCP and glass by forming covalent bonds, such as Si–OH–C (Fig. 7(b)). According to the AFM measurements, the RMS surface roughness of LCP (15–20 nm) is much higher than the value (<1 nm) required in the direct bonding of rigid substrates.17 However, the mechanical flexibility of LCP ensured its conformal contact on glass and the formation of Si–OH–C bonds across the bonding interface. These covalent bonds resulted in a bonding strength of 4.1 MPa (Table 2).
3.3.2 Role of anodic treatment. To improve the bonding strength, an anodic voltage of 1 kV was applied between the LCP and glass with a mechanical pressure of 0.2 MPa for 3 minutes (SPAB + A). As shown in Fig. 7(c), the anodic treatment increased the percentage of the C–O species (associated to interfacial bonds) from 22% (SPAB) to 50% (SPAB + A) on the glass side, and the C–C species from 22% (SPAB) to 78% (SPAB + A) on the LCP side. The increase of the bonding strength to 5.5 MPa (Table 2) may be explained by the anodic bonding mechanism,39 which consists of the interactions between the oxygen in glass and the carbon in LCP. On the LCP side, both C–O and O–C[double bond, length as m-dash]O are strongly polarized (since oxygen is more negative) during the anodic treatment. Under a strong electric field, these polar groups re-orient, with oxygen pointing into the LCP and carbon towards the surface. Therefore, less oxygen-containing groups were detected by XPS on the LCP side (Fig. 7(c)). On the glass side, oxygen in glass migrates towards the LCP–glass interface, diffuses into the LCP,26,40 and then reacts with the C–C species and forms C–O species. The larger increase of the amount of C–O species than that of the O–C[double bond, length as m-dash]O species (Fig. 7(b) and (c)) may be due to the requirement of higher energies to form O–C[double bond, length as m-dash]O species.41 It may also be attributed to anisotropy of the dipoles in the respective groups of the polymer chain but requires further studies. The oxygen–carbon interactions contribute to the enhancement of the bonding strength through re-orientation of C–O/C[double bond, length as m-dash]O groups, diffusion of O, reaction of O with C in LCP that form new C–O/C[double bond, length as m-dash]O groups.
3.3.3 Role of thermal treatment. Another approach to enhance the bonding strength between LCP and glass is to rearrange the interfacial chemical bonds and improve the interfacial contact using thermal treatment. For the rearrangement of interfacial chemical bonds, heating increased the percentage of C–C species from 22% (SPAB) to 66% (SPAB + H) (Fig. 7(b) and (d)) on the LCP side. This increase may be due to the thermal reduction of C–O and O–C[double bond, length as m-dash]O to C–C.42,43 After reduction, oxygen can diffuse into the bulk of LCP.23 On the glass side, the percentages of C–O and O–C[double bond, length as m-dash]O were different from that on the LCP side because these peaks were taken from O1s peak (glass side) rather than C1s (LCP side). These differences may be attributed to the different chemical state intensities of the C1s and O1s peaks.44 Also, a thin layer of residual LCP (a few nm) may remain on the glass surface after debonding, which is evident from the C1s peak in the wide-scan XPS spectra of glass-SPAB (Fig. 6(a)). The reduction of C–O and O–C[double bond, length as m-dash]O may also occur on the glass side. However, the released oxygen may be difficult to diffuse due to the oxygen-rich/saturate glass substrate.45,46 This phenomenon may be responsible for the similar percentages of C–O and O–C[double bond, length as m-dash]O on the glass side before and after thermal treatment. For the improvement of interfacial contact, the soft LCP undergoes conformal deformation on rigid glass when the bonded specimen anneals at 200 °C (close to but below LCP's glass transition temperature of 240 °C). Therefore, the increase of the bonding strength from 4.1 MPa (SPAB) to 4.8 MPa (SPAB + H) may be attributed to both the heat-induced rearrangement of surface species and the improved contact between the two surfaces.47,48

While the bonding strength was not significantly improved by using thermal treatment alone (SPAB + H), sequential application of the anodic and thermal treatments to the SPAB specimen (SPAB + A + H) resulted in a high bonding strength of 6.3 MPa (Table 2). The combined effect of the electrostatic force and the rearrangement of surface species increased the percentage of C–C from 22% (SPAB) to 90% (SPAB + A + H), but decreased the percentage of the oxygen species (C–O and O–C[double bond, length as m-dash]O) on the LCP side (Fig. 7(e)). The increase of C–C/C–H bonds in the XPS analysis was also confirmed by using the attenuated total reflectance FTIR (FTIR-ATR) absorbance spectra of debonded LCP surfaces in SPAB, SPAB + H, SPAB + A and SPAB + A + H compared with LCP-AR surface as shown in Fig. 8. The full range FTIR spectra (i.e., 500–4000 cm−1) for all the specimens are shown in the ESI Fig. S6. The C–C and C–H stretching vibration peaks appeared in two different IR frequency regions, 1200 cm−1 and 2800–3000 cm−1, respectively.49 The C–C stretching peaks at 1200 cm−1 were weak to compare for all the specimens. Therefore, we considered the C–H stretching peaks only. All the curves were normalized with respect to the highest peak intensity in each spectra. While no C–H stretching peaks were found on the LCP-AR surface, these peaks appeared on the debonded LCP surface of SPAB. Also the intensity of these peaks of the debonded LCP surfaces in SPAB + H, SPAB + A, and SPAB + A + H was increased. The increase in the intensity in the region with wavenumber greater than 3000 cm−1 could be due to larger amplitude of O–H stretching vibrations related to the combined effects of SPAB, heating and anodic treatment.26,49 Therefore, the increased amount of C–H species in the debonded LCP surfaces using FTIR-ATR supports the increased amount of C–C/C–H species as shown in the bonding mechanisms in Fig. 7. The rearranged interfacial dangling sites and improved interfacial contact might provide more interfacial Si–OH–C bonds and increase the bonding strength.


image file: c6ra17729h-f8.tif
Fig. 8 The attenuated total reflectance FTIR (FTIR-ATR) absorbance spectra of debonded LCP surfaces in SPAB, SPAB + H, SPAB + A and SPAB + A + H with respect to that of as received LCP surface (LCP-AR). The C–H stretching peaks are in the range of 2800–3000 cm−1.

The direct bonding processes developed for LCP and glass in this study indicate that the bonding strength can be tuned by heating and anodic treatments. These result in rearrangement of interfacial bonds of C–O and C[double bond, length as m-dash]O. Further tailoring of the LCP–glass bonding can be accomplished by using thin glass wafers/films. Their higher mechanical bendability and flexibility ensure a better accommodation of higher applied bonding pressure,23 which may provide a higher bonding strength and void-free interface. Therefore, LCP may also be strongly bonded to thin glass substrates for flexible devices/systems applications.

4 Conclusions

In this study, LCP and glass substrates are directly bonded using a sequential plasma activated bonding (SPAB) process. The sequential plasma-activated surfaces of glass and LCP are bonded with the assistance of Si–OH–C covalent bonds at their contacting interface. The bonding strengths were further improved by heating and anodic treatments. The electrostatic force helps the interactions between the oxygen in glass and the carbon in LCP that in turn increase the amount of interfacial oxides with dangling sites. The thermal treatment rearranges the interfacial oxides and improves the conformal contact between LCP and glass. By utilizing both post-bonding treatment steps, a high bonding strength of 6.3 MPa is realized. This low-temperature direct bonding process is easy-to-implement, and can be employed in the fabrication of robust and flexible devices.

Acknowledgements

This research is supported by Discovery Grants from the Natural Science and Engineering Research Council of Canada, an infrastructure grant from the Canada Foundation for Innovation, an Ontario Research Fund for Research Excellence Funding Grant, a FedDev of Southern Ontario grant, the Canada Research Chair program, NSERC ResEau strategic network and the NCE IC-IMPACTS.

References

  1. H. Kang, S. Jung, S. Jeong, G. Kim and K. Lee, Nat. Commun., 2015, 6, 6503 CrossRef CAS PubMed.
  2. P. N. Nge, C. I. Rogers and A. T. Woolley, Chem. Rev., 2013, 113, 2550–2583 CrossRef CAS PubMed.
  3. A. Weber, S. Deutschbein, A. Plichta and A. Habeck, SID Int. Symp. Dig. Tech. Pap., 2002, 33, 53 CrossRef CAS.
  4. A. J. T. Teo, A. Mishra, I. Park, Y.-J. Kim, W.-T. Park and Y.-J. Yoon, ACS Biomater. Sci. Eng., 2016, 2, 454–472 CrossRef CAS.
  5. X. Wang, J. Engel and C. Liu, J. Micromech. Microeng., 2003, 13, 628–633 CrossRef CAS.
  6. Encyclopedia of Microfluidics and Nanofluidics, ed. D. Li, Springer New York, New York, NY, 2015 Search PubMed.
  7. K. B. Mogensen and J. P. Kutter, Electrophoresis, 2009, 30, S92–S100 CrossRef PubMed.
  8. M. Trojanowicz, Anal. Chim. Acta, 2009, 653, 36–58 CrossRef CAS PubMed.
  9. I. Abdulhalim, Liq. Cryst. Today, 2011, 20, 44–60 CrossRef CAS.
  10. S. Prakash, M. Pinti and B. Bhushan, Philos. Trans. R. Soc., A, 2012, 370, 2269–2303 CrossRef CAS PubMed.
  11. S. J. Woltman, G. D. Jay and G. P. Crawford, Nat. Mater., 2007, 6, 929–938 CrossRef CAS PubMed.
  12. G.-T. Hwang, D. Im, S. E. Lee, J. Lee, M. Koo, S. Y. Park, S. Kim, K. Yang, S. J. Kim and K. Lee, et al., ACS Nano, 2013, 7, 4545–4553 CrossRef CAS PubMed.
  13. Y. Qin, M. M. R. Howlader, M. J. Deen, Y. M. Haddara and P. R. Selvaganapathy, Sens. Actuators, B, 2014, 202, 758–778 CrossRef CAS.
  14. Y. Qin, M. Howlader and M. Deen, Photonics, 2015, 2, 1164–1201 CrossRef.
  15. P. Zuo, X. Li, D. C. Dominguez and B.-C. Ye, Lab Chip, 2013, 13, 3921–3928 RSC.
  16. A. G. Brolo, Nat. Photonics, 2012, 6, 709–713 CrossRef CAS.
  17. A. U. Alam, M. M. R. Howlader and M. J. Deen, J. Micromech. Microeng., 2014, 24, 035010 CrossRef.
  18. X. Jiang, C. Wang and W. Liu, IEEE Trans. Compon., Packag., Manuf. Technol., 2015, 5, 583–591 CrossRef CAS.
  19. A. G. P. Kottapalli, M. Asadnia, J. M. Miao, G. Barbastathis and M. S. Triantafyllou, Smart Mater. Struct., 2012, 21, 115030 CrossRef.
  20. M. M. R. Howlader, S. Suehara and T. Suga, Sens. Actuators, A, 2006, 127, 31–36 CrossRef CAS.
  21. M. M. R. Howlader, S. Suehara, H. Takagi, T. H. Kim, R. Maeda and T. Suga, IEEE Trans. Adv. Packag., 2006, 29, 448–456 CrossRef.
  22. M. M. R. Howlader, F. Zhang and M. J. Kim, J. Microelectromech. Syst., 2011, 20, 17–20 CrossRef.
  23. M. M. R. Howlader, M. Iwashita, K. Nanbu, K. Saijo and T. Suga, IEEE Trans. Adv. Packag., 2005, 28, 495–502 CrossRef CAS.
  24. T. Y. Hin, C. Liu and P. P. Conway, Surf. Coat. Technol., 2009, 203, 3741–3749 CrossRef CAS.
  25. M. M. R. Howlader, A. U. Alam, R. P. Sharma and M. J. Deen, Phys. Chem. Chem. Phys., 2015, 17, 10135–10145 RSC.
  26. M. M. R. Howlader, M. G. Kibria, F. Zhang and M. J. Kim, Talanta, 2010, 82, 508–515 CrossRef CAS PubMed.
  27. K. N. Chen, A. Fan, C. S. Tan, R. Reif and C. Y. Wen, Appl. Phys. Lett., 2002, 81, 3774 CrossRef CAS.
  28. C. S. Tan, A. Fan, K. N. Chen and R. Reif, Appl. Phys. Lett., 2003, 82, 2649 CrossRef CAS.
  29. X. Zhu, G. Liu, Y. Guo and Y. Tian, Microsyst. Technol., 2006, 13, 403–407 CrossRef.
  30. C.-T. Ko and K.-N. Chen, Microelectron. Reliab., 2010, 50, 481–488 CrossRef CAS.
  31. M. M. R. Howlader, G. Kagami, S. H. Lee, J. G. Wang, M. J. Kim and A. Yamauchi, J. Microelectromech. Syst., 2010, 19, 840–848 CrossRef CAS.
  32. W. Wang, L. Xu, F. Liu, X. Li and L. Xing, J. Mater. Chem. A, 2013, 1, 776–782 CAS.
  33. S. P. Pujari, L. Scheres, A. Marcelis and H. Zuilhof, Angew. Chem., Int. Ed., 2014, 53, 6322–6356 CrossRef CAS PubMed.
  34. X. X. Zhang and J.-P. Raskin, J. Microelectromech. Syst., 2005, 14, 368–382 CrossRef CAS.
  35. JEOL, Handbook of X-ray Photoelectron Spectroscopy, Japan, 1991 Search PubMed.
  36. M. G. Kibria, F. Zhang, T. H. Lee, M. J. Kim and M. M. R. Howlader, Nanotechnology, 2010, 21, 134011 CrossRef CAS PubMed.
  37. K. C. Yung, H. Liem, H. S. Choy and T. M. Yue, J. Mater. Sci.: Mater. Electron., 2010, 21, 954–962 CrossRef CAS.
  38. K. S. Siow, L. Britcher, S. Kumar and H. J. Griesser, Plasma Processes Polym., 2006, 3, 392–418 CrossRef CAS.
  39. S. V. Aradhya, S. V. Garimella and T. S. Fisher, J. Electrochem. Soc., 2008, 155, K161 CrossRef CAS.
  40. C. Tudryn, S. Schweizer, R. Hopkins, L. Hobbs and A. J. Garratt-Reed, J. Electrochem. Soc., 2005, 152, E131–E134 CrossRef CAS.
  41. R. T. Sanderson, Chemical Bonds and Bond Energy, Academic Press Inc, New York, 2nd edn, 1976 Search PubMed.
  42. J. D. Renteria, S. Ramirez, H. Malekpour, B. Alonso, A. Centeno, A. Zurutuza, A. I. Cocemasov, D. L. Nika and A. A. Balandin, Adv. Funct. Mater., 2015, 25, 4664–4672 CrossRef CAS.
  43. F. Liu, S. Song, D. Xue and H. Zhang, Adv. Mater., 2012, 24, 1089–1094 CrossRef CAS PubMed.
  44. S. Yumitori, J. Mater. Sci., 2000, 35, 139–146 CrossRef CAS.
  45. R. H. Doremus, J. Electrochem. Soc., 1996, 143, 1992 CrossRef CAS.
  46. S. Takeda, J. Non-Cryst. Solids, 2006, 352, 3910–3913 CrossRef CAS.
  47. R. L. Pfeffer, in The Physics and Chemistry of SiO2 and the Si-SiO2 Interface, Springer, US, Boston, MA, 1988, pp. 169–176 Search PubMed.
  48. U. M. Gösele, H. Stenzel, M. Reiche, T. Martini, H. Steinkirchner and Q.-Y. Tong, Solid State Phenom., 1996, 47–48, 33–44 CrossRef.
  49. G. Socrates, Infrared and Raman Characteristic Group Frequencies: Tables and Charts, John Wiley & Sons, Inc., New York, 3rd edn, 2004 Search PubMed.

Footnote

Electronic supplementary information (ESI) available. See DOI: 10.1039/c6ra17729h

This journal is © The Royal Society of Chemistry 2016