Tuning Ni nanoparticles and the acid sites of silica-alumina for liquefaction and hydrodeoxygenation of lignin to cyclic alkanes

Jiechen Kong, Bolong Li and Chen Zhao*
Shanghai Key Laboratory of Green Chemistry and Chemical Processes, School of Chemistry and Molecular Engineering, East China Normal University, Shanghai 200062, China. E-mail: czhao@chem.ecnu.edu.cn

Received 1st July 2016 , Accepted 21st July 2016

First published on 22nd July 2016


Abstract

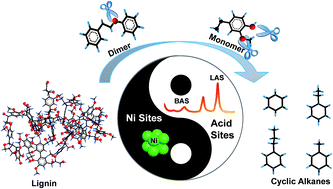
A facile and effective method for the one-pot hydrodeoxygenation of enzymatic lignin to C6–C9 cycloalkanes is reported in liquid dodecane with 100 C% selectivity (approaching 50 wt% yield). The method enables 80 wt% lignin conversion by using Ni catalyst-supported amorphous silica-alumina (ASA) at 300 °C in the presence of 6 MPa H2. The crucial factors to achieve direct lignin hydrodeoxygenation are the suitable balance in solvent selection and the design of active sites in the solvent liquid phase. The activity of Ni nanoparticles in dodecane leads to higher efficiency in the deconstruction of external C–O bonds in lignin. The consumption of lignin shifts the equilibrium of lignin solubility and weakens the impact of the relatively poor lignin solubility in dodecane for lignin depolymerization. The key element in controlling the activity of Ni-based catalysts is the specific external surface areas of diverse supports as well as the sizes of metallic Ni sites. This is probably because of the high external surface areas that can provide good contact opportunities for Ni sites in the lignin macromolecule. The efficient contact of active sites in the polymer reactant is the most important factor for such solid–solid reactions. The size and distribution of active Ni sites as well as the specific surface areas of Ni/ASA as modified by the different deposition precipitation times, reduction temperatures, and Ce additives can greatly affect the ability of a metal to attack the external C–O bonds of lignin. Furthermore, the acidity of the support (especially Brönsted acid sites) as modified by the Si/Al ratio of ASA significantly enhances the capabilities and alters the electronic structures of Ni nanoparticles for cleavage of the C–O linkages of lignin. This suggests that the synergy of acid and metal sites can be subtly tailored to strengthen the catalytic performance of Ni metallic sites. In addition, the presence of acidic sites catalyzes the dehydration of cyclic alcohols intermediates and facilitates the hydrodeoxygenation of the derived phenolic fragments to cyclic alkanes.


Introduction

As fossil fuel reserves are becoming depleted, biomass1 is becoming a promising sustainable feedstock for producing valuable fuels and chemicals. Lignin is the second most abundant lignocellulose biomass resource and has inherent aromatic-rings in its bio-polymer, and the C9 propyl-phenol units in such structures are randomly connected to aromatic C–O bonds.2 However, efficient catalytic depolymerization of lignin still needs urgent breakthroughs due to its complex bio-polymer structures and insolubility in common solvents.

In the past few years, diverse approaches such as hydrolysis,3 solvolysis,4 oxidation,5 and reduction6 have been used to break down the C–O bond linkages of lignin to realize its deconstruction. Noble metals (Ru,7 Rh,8 Pd,9 and Pt10) are usually employed for reduction. For example, Ru/activated carbon (AC) produced around 50% phenolic monomers (mainly 4-n-propylguaiacol and 4-n-propylsyringol) and 20% phenolic dimers from lignin depolymerization in methanol solvent at 523 K with 3 MPa H2.11 In addition, the combined catalysts Pt/AC and H3PO4 were used to deconstruct of lignin12 and afforded some phenolic monomers and dimer fragments. In the second step, these fragments were hydro-deoxygenated to cyclic alkanes with 42% C8–C9 alkanes and 10% C14–C18 alkanes.

Whereas Ru and Pt catalysts have shown high activities in cleaving the C–O bonds of lignin, their high price limits their application. The basic Ni metal has also demonstrated high activities in scission of C–O bonds of lignin-derived phenolic monomers and dimers. Researchers have focused on the use of inexpensive transition metals including Ni,13 Cu,14 Fe,15 and MoC1−x (ref. 16) to depolymerize lignin in liquid phase. The Ni catalysts17–20 showed high lignin conversion at 200–300 °C with 3–6 MPa H2. Apart from a series of Ni-based catalysts, Li et al. introduced an ethanolysis and hydrogenolysis method to treat lignin in ethanol solvent over a-MoC1−x/AC at 280 °C and produced a mixture consisting of C6–C10 esters, alcohols, arenes, phenols, and benzyl alcohols.16

Hydrogenolysis is a promising way to cleave the C–O bond linkages of lignin, but it consumes large amounts of high-pressurized H2. Rinaldi et al. used 2-propanol as an H donor to convert bio-oil and lignin into arenes in absence of extra hydrogen.21 In addition, the Cu catalyst catalyzed the liquefaction of lignin in the super-critical methanol without hydrogen.14 In the context of hydrolysis of lignin, Stahl22 et al. described a two-stage method beginning with oxidation of the Cα ketone position. The oxidized lignin was then hydrolyzed by formic acid to phenolic compounds with a yield over 60 wt% under mild conditions at 110 °C. In comparison to hydrogenolysis, hydrolysis, and solvolysis, oxidation is an efficient way to realize lignin depolymerization.5

In general, current strategies are more focused on screening efficient catalysts and catalytic systems for lignin utilization. However, less attention has been focused to understanding more intrinsic factors for lignin deconstruction. With respect to heterogeneous catalysts, the support properties can greatly influence the performance of loaded metal nanoparticles—especially synergic effect that the acid sites exhibit for the metallic nanoparticles. Herein, we describe the influence of solvents, supports and metallic sites on Ni catalysts towards lignin depolymerization and further hydrodeoxygenation. The size and distribution of Ni sites are modified by different deposition precipitation times, reduction temperatures, and Ce additives, and the acidity of the silica-alumina carrier (especially for Brönsted acid sites) is modified by changing the Si/Al ratio. In addition, the synergic effects of Ni nanoparticle sizes and acidic sites of the silica-alumina towards lignin depolymerization will be discussed.

Results

Characterization of the selected enzymatic lignin

The lignin used was a solid brown powder obtained from the enzyme-catalyzed hydrolysis of cellulose from a corncob. Gel permeation chromatography demonstrated that the soluble fraction of lignin had an Mn value of 3061 with Mw/Mn = 1.04 (Fig. 1a). This suggests that the selected lignin contains at least 16 structural units on the assumption of molecular weight of structural unit C9H7.3O2.8(OCH3)1.0 being 191 g mol−1. SEM (Fig. 1b) shows lignin with an irregular size distribution and morphology ranging from 2 to 10 μm. Klason analysis (using concentrated H2SO4 to dissolve the cellulose in the corncob raw material) showed that the lignin content was 80 wt%. Moreover, the components of ash, residual sugar, and water in the raw material were 12 wt%, 3 wt%, and 5 wt%, respectively (Table 1). The organic elemental analysis result showed that the C, H, N, and O contributed to 62.4 wt%, 5.34 wt%, 0.45 wt%, and 31.8 wt%, suggesting that the formula of lignin in the C9 unit was C9H7.3O2.8(OCH3)1.0. This assumed that each C9 unit structure contained one –OCH3 group. Based on such an assumption of the lignin formula, the theoretical yields of C9H18, CH4, and H2O were estimated to be 66 wt%, 8.4 wt%, and 32 wt% (Table 1).
image file: c6ra16977e-f1.tif
Fig. 1 Characterization of lignin by (a) GPC profile, (b) SEM image, (c) infrared spectrum, and (d) 1H-NMR spectrum using DMSO as solvent.
Table 1 Typical composition, organic elemental analysis, the element composition and theoretical yield of lignin
Component Content (wt%) Element Content (wt%)
Lignin 80 C 62.4
Ash 12 H 5.34
Residual sugar 3 N 0.45
Water 5 O 31.8

C9 structure formula Theoretical yields (wt%)
C9H7.3O2.8(OCH3)1.0 C9H18 66
CH4 8.4
H2O 32


The FTIR spectrum of the enzymatic lignin is shown at Fig. 1c, and Table S1 lists the locations of the related observed bands and the corresponding organic functional groups. The broad absorbance band at 3408 cm−1 originated from the O–H stretching in lignin. The C–H stretching in methyl and methylene appeared at 3006, 2937, 2848 cm−1 with a banding band at 1461 cm−1. A series band at 1600, 1512, 1423 cm−1 was assigned to the skeletal vibrations in the aromatic rings. Due to the influence of the side chains, some characteristic band may emerge in the aromatic IR spectra. A shape absorbance appearing at 835 cm−1 corresponding to the C–H out of plane deformation in syringyl rings, while the C–H in plane deformation in guaiacyl rings appeared at 1126 cm−1. Creighton et al. classified three types of lignin via degradation of a wide variety of plant materials23 yielding vanillin (G type), vanillin and syringaldehyde (GS type), and 4-hydroxy-benzaldehyde, vanillin, and syringaldehyde (HGS type). Faix et al.24 further confirmed this important information by studying the FTIR spectra of numerous types of lignin. The consistency between the spectra of the selected lignin and HGS featured peaks in 1065–1175 cm−1 and 835 cm−1 region suggested that the enzymatic corncob lignin belonged to the HGS type.

The 1H NMR spectrum of lignin is shown in Fig. 1d, and the assignments of the corresponding signals are listed in Table S2. The low signal in the spectrum (relative to baseline noise) is probably attributed to the poor solubility of the macromolecular lignin in DMSO. There were sharp signals at δ = 3.7 and δ = 2.5 ppm, and these were assigned to the methoxy protons in aromatic and aliphatic chains, respectively. A broad signal appearing at δ = 6.6–7.5 ppm (containing unimodals at 7.2, 6.8, and 6.6 ppm) was identified as protons in the aromatic rings corresponding to phenyl, guaiacyl, and syringyl structures, respectively. This is consistent with the FTIR result, and confirmed again that the enzymatic lignin is a HGS type. The α-H signal in β–β and α-O-4 connection units appeared at δ = 5.3 ppm while the α-H signal in the β-O-4 linkage occurred at δ = 6.3 ppm.25 This suggests that the units (4-hydroxy-benzaldehyde, vanillin, and syringaldehyde) condense with each other in the α-O-4 and β-O-4 linkages.

Hydrodeoxygenation of lignin with diverse oxides supported Ni catalysts

Lignin is a three-dimensional bio-polymer and dissolves poorly in many solvents. The solvent effect including apolar solvents (dodecane, benzene, toluene, tetrahydrofuran, and naphthane) and polar solvents (ethylene glycol, ethanol, and 1,4-dioxane) was investigated with Ni/ASA at 250 °C in the presence of 4.0 MPa H2 (Table S3). The results showed that although lignin had a better dispersion in polar solvents such as ethylene glycol, ethanol, and 1,4-dioxane (Fig. S1), lignin depolymerization in apolar solvents (benzene, toluene, and dodecane) performed much better than those in polar solvents. For example, in dodecane, benzene, and toluene solvents, the phenol yields were 18.0 wt%, 12.3 wt%, and 10.3 wt% over Ni/ASA. The lignin depolymerization was only 6.3 wt% and 9.5 wt% in ethanol and 1,4-dioxane. In addition, it should be noted that only dodecane offered a large fraction of hydrogenation including cyclohexanes/alkanes (yield: 13.0%) and aromatics/olefins (yield: 0.4%). In other solvents (benzene, toluene, tetrahydrofuran, naphthane, ethanol, and 1,4-dioxane) 100% selectivity for phenols was noted. The better results in the apolar solvents are probably attributed to the good stability of the Ni species. This prevents the formation of nickel oxides and Ni leaching at selected conditions.26 Dodecane is thus selected as the appropriate solvent for achieving the highest lignin depolymerization yield with Ni/ASA.

The selection of supports with different properties can greatly change the performance of Ni sites, and thus the effect of the support was studied towards lignin conversion and product distributions. The Ni catalysts on different oxides supports were prepared by the deposition–precipitation method. The selected supports ranged from ZrO2, SiO2, ZnO, TiO2, MgO, Al2O3, and ASA. The properties of those catalysts including specific surface areas and sizes of the Ni nanoclusters as well as Brönsted and Lewis acid concentrations were characterized and complied in Table 2.

Table 2 Depolymerization of lignin with Ni based catalyst in dodecanea
Cat. SBET (m2 g−1) Acid conc. (mmol g−1) dNi-XRD (nm) Conv.c (%) Liquid yieldd (%) Rate (glig gcat−1 h−1) Liquid product selectivity (%)
BAS LAS Cyclo-alkanes Aromatics Oxygenatesb
a Condition: enzymatic corncob lignin (4 g), 30 wt% Ni based catalyst (2 g), 80 mL dodecane, 250 °C, 4 MPa H2, 160 min, stirring at 700 rpm.b Oxygenates mainly contain substituted phenols, cyclo-alcohols, as well as some minor ketone, alcohol, and ester products.c Conversion value refers to the weight loss of solid lignin before and after reaction.d Liquid yield is calculated by the method of area normalization using undecane as internal standard.e Amorphous silicon and aluminium contains 10 wt% alumina.
None Coke 2 0.02 100
Ni/ZrO2 27 0 0.023 18.8 41 5 0.30 1 3 97
Ni/SiO2 32 39.4 36 5 0.32 5 1 94
Ni/ZnO 47 0 0 23.1 40 7 0.28 8 1 91
Ni/TiO2 62 0 0 21.6 39 8 0.30 7 2 91
Ni/MgO 99 0 0 17.5 37 10 0.29 8 4 88
Ni/Al2O3 75 0 0.199 12.2 43 11 0.27 14 1 84
Ni/ASAe 292 0.107 0.246 11.3 78 18 0.58 72 2 26


The catalysts activities were evaluated at 250 °C in the presence of 4 MPa H2. Generally, the higher surface areas are beneficial to disperse Ni nanocluster such as Ni/ASA (SBET = 292 m2 g−1, dXRD = 11 nm), but two exceptions, i.e., Ni on ZrO2 and Al2O3 have relatively low surface area (27 and 75 m2 g−1). Here, relatively small Ni particle sizes (18 and 12 nm) were observed relative to other Ni/oxide catalysts. It may be attributed to the Lewis acid on the surface of Al2O3 and ZrO2, which helps anchor and stabilize Ni nanoclusters on the surface of the oxides.28

In the blank test with lignin and solvent, merely 2% liquid yield was reached due to the thermolysis of lignin (Table 2). Despite of the different diameters of Ni nanoclusters on oxide catalysts ranging from 11 to 39 nm, similar lignin conversions (determined by the weight loss of solid lignin before and after reaction) were obtained near 36–43 wt%. These results suggested that the solid conversion did not totally depend on the particle size of the Ni nanoclusters. It is noteworthy that Ni/ASA leads to the highest lignin conversion at 78%, and has a rate of 0.58 glig gcat−1 h−1. We also observed that the detected liquid yields (5–18%) were lower than the conversion data (36–78%) implying that depolymerization of enzymatic lignin to the liquid compounds proceeds with cascade multi-steps and the rate-determining step may be the cleavage of the heavier fragments such as phenolic oligomers (cannot be detected by GC) to smaller secondary and monomeric compounds with the Ni/oxides catalysts. It was interesting to see that the liquid yield was increased linearly with the increasing trends of specific surface areas of Ni/oxides. That is, the increased trend of liquid yield (5, 5, 7, 10, 11, and 18%) over Ni/ZrO2, Ni/SiO2, Ni/ZnO, Ni/MgO, Ni/Al2O3 and Ni/ASA catalysts corresponded to the increased surface areas, i.e., 27, 32, 47, 62, 99, 75, and 292 m2 g−1 sequentially (Table 2). This indicated that high surface areas of supports facilitate phenolic oligomers cleavage to smaller molecules probably due to the better adsorption and more accessible contact sites towards heavier compounds.

Apart from the yields of liquid products, there was a strong dependence of the liquid product selectivity towards support properties. The selectivity to phenolic oxygenates over Ni-based catalysts (Ni/ZrO2, Ni/SiO2, Ni/ZnO, Ni/MgO, and Ni/Al2O3) was near 100% (Table 2); however, the major products over Ni/ASA catalyst were cycloalkanes (72% selectivity) and phenolic compounds (26% selectivity). We reported that phenols can be converted to cycloalkanes via hydrogenation to cyclic alcohols followed by dehydration to cyclohexenes and a final hydrogenation to cycloalkanes.20 Therefore, the highly enhanced selectivity toward cycloalkanes rather than phenols is due to the specific Brönsted acid sites (BAS) on Ni/ASA (BAS: 0.107 mmol g−1) (Table 2 and Fig. S2). This catalyzes the crucial dehydration reaction in overall phenols hydrodeoxygenation process. We concluded that the high surface area, the small Ni size, as well as the BAS on the Ni/ASA are key factors for achieving the high activity and selectivity of lignin conversion.

The lignin-generated liquid products obtained over Ni/ASA in dodecane contained a mixture of C3 to C17 hydrocarbons (see Table 3). Cycloalkanes were the major products of lignin conversion with 71.5% selectivity at 250 °C and 4 MPa H2, and then 99.8% selectivity at 300 °C and 6 MPa H2, respectively. The remaining parts were oxygenated aliphatics, oxygenated aromatics, aromatics, and oxygenated cycloalkanes. Some smaller C3–C6 linear alkanes were formed from cellulose and hemicellulose hydrodeoxygenation. As shown in Table 3, the yields of lignin-derived oxygenated aromatics and cycloalkanes decreased from 3.02% to 0% and from 2.62% to 0.11% with rising temperatures (250 °C to 300 °C) and H2 pressures (4 to 6 MPa) implying that high temperatures and H2 pressures accelerate the hydrodeoxygenation. Meanwhile the liquid yields were also increased with temperatures and H2 pressures, suggesting high temperatures and H2 pressures were beneficial for depolymerization of lignin and oligomers.

Table 3 Data for depolymerization of lignin with Ni/ASA at different conditionsa
Reaction condition 250 °C, 4 MPa H2 300 °C, 6 MPa H2
a Condition: enzymatic corncob lignin (4 g), 30 wt% Ni based catalyst (2 g), 80 mL dodecane, 160 min, stirring at 700 rpm.
Lignin conversion (%) 52.9 73.5
Liquid yield on GC (%) 22.8 46.2
Selectivity to CHs (%) 71.5 99.8
Liquid product yield (%)    
Oxygenated aliphatics 0.9 0
Aliphatic hydrocarbons 0.7 2.3
Oxygenated aromatics 3.0 0
Arenes 0.2 0
Oxygenated cycloalkanes 2.6 0.1
Cycloalkanes 15.4 43.8


The optimized data for lignin-generated liquid product distributions is presented in Fig. S3, showing that the major components were C6 (11.8%), C7 (9.5%), C8 (44%) and C9 (11.1%) which are similar to the hydrocarbon composition in gasoline. In addition, the major component in gas phase was CH4 at 98% fraction (see Fig. S3). CH4 was derived from the removal of the –OCH3 group that was abundant in the lignin structural unit (Table 1). The second largest fraction was CO2 (2501 ppm). This was formed by decarbonylation or decarboxylation of acids or ester functional groups in the crude lignin structure. The remaining C2H6, C3H8, and C4H8 components (total concentrations: 0.6%) may be derived from the deep C–C bond cleavage in lignin, intermediates, and products.

Understanding the individual steps during overall lignin HDO by kinetic studies on benzyl 2-phenyl ether, guaiacol, and lignin conversion

To understand the cleavage modes of C–O bonds in lignin, the dimeric (β-O-4, benzyl 2-phenylethyl ether, designated as BPE) and monomeric (guaiacol) model compounds from lignin were selected in order to investigate the intrinsic mechanistic pathways. The kinetics of hydrodeoxygenation of BPE was studied at 300 °C in the batch mode as a function of time (Fig. 2a). The co-presence of C8 phenyl-ethanol and C6 phenol over Ni/ASA suggests that the C–O bond can be cleaved at position a (Caromatic–O) or b (Caliphatic–O) of BPE at a high temperature (Fig. 2b). The cleavage products via C6 benzene and C8 ethyl benzene were further hydrogenated over Ni/ASA catalyst to form cyclohexane and ethyl cyclohexane. The subsequent reaction for phenyl-ethanol hydrodeoxygenation followed with sequential dehydration and hydrogenation to ethyl-cyclohexane. With respect to phenyl-ethanol, it was first dehydrated to styrene, and then gradually hydrogenated to ethyl cyclohexane. Meanwhile the C–C coupling compounds were also observed at a yield of 7.2% among phenolic intermediates via the alkylation route. The rate of cleavage of the β-O-4 linkage was 20.6 g g−1 h−1, and smaller cyclic alkanes were formed after the C–O bonds were broken down.
image file: c6ra16977e-f2.tif
Fig. 2 (a) Kinetics of phenolic dimer conversion to cycloalkanes over Ni/ASA. (b) Reaction steps in benzyl 2-phenylethyl ether conversion over Ni/ASA. Conditions: benzyl 2-phenylethyl ether (2.0 g), Ni/ASA catalyst (30.1 wt%, 0.05 g), dodecane (80 mL), 300 °C, 6 MPa H2, 160 min, stirring at 700 rpm.

In the second step, the reaction pathways were explored by examining guaiacol hydrodeoxygenation over Ni/ASA at 300 °C (Fig. 3a). The results demonstrated that guaiacol can be converted to phenol, anisole, and 2-methoxycyclohexanone via hydrogenolysis or hydrogenation routes. This suggests that Ni/ASA could break down the C–O bond of guaiacol at the position a (Caromatic–O) or b (Caliphatic–O). In addition, hydrogenation was shown to be an optional pathway for guaiacol at selected conditions (Fig. 3b). Phenol can be further converted to cyclohexane via sequential coupled hydrogenation, dehydration, hydrogenation route. Similar routes dominate further hydrodeoxygenation of anisole and 2-methoxycyclohexanone to cyclohexane via hydrogenation, hydrogenolysis and dehydration paths analogous to the route for phenol hydrodeoxygenation under identical conditions. The rate of guaiacol hydrodeoxygenation to target cycloalkanes (27.8 g g−1 h−1) was slightly faster than that of the C–O bond cleavage of dimeric phenolic compounds (20.6 g g−1 h−1).


image file: c6ra16977e-f3.tif
Fig. 3 (a) Kinetics of phenolic monomer conversion to cycloalkanes over Ni/ASA, (b) reaction steps in guaiacol hydrodeoxygenation to cycloalkanes on Ni/ASA. Conditions: guaiacol (5.0 g), Ni/ASA catalyst (30.1 wt%, 0.2 g), dodecane (80 mL), 300 °C, 6 MPa H2, stirring at 700 rpm.

The kinetics of crude lignin depolymerization over Ni/ASA were conducted under the same condition, in which cyclic alkanes were the dominant product throughout the lignin conversion (Fig. 4a). The kinetics curve shows that in the initial time cycloalkanes were the primary products (>65% selectivity) during lignin conversion, while forming small amounts of phenolic and alcohols (<35% selectivity).


image file: c6ra16977e-f4.tif
Fig. 4 (a) Kinetics of lignin conversion with Ni/ASA in the apolar solvent. (b) The brief illumination of multi-steps in one-pot hydrodeoxygenation of lignin to cycloalkanes. Conditions: lignin (2.0 g), Ni/ASA catalyst (30.1 wt%, 1.0 g), dodecane (80 mL), 300 °C, 6 MPa H2, stirring at 700 rpm.

Combining these results allows us to depict the overall reaction pathway for one-step conversion of cellulolytic enzyme lignin to cycloalkanes (Fig. 4b). Under the selected conditions, lignin is dissolved in apolar solvent dodecane in equilibrium (k1, not determined), which shifts as lignin consumes gradually. Subsequently, the Ni nanoclusters supported on external surface of ASA cleave the exposed C–O–C linkages of the lignin macromolecule to form phenolic oligomers (k2, designated as the rate of lignin conversion). The multi-steps of C–O cleavage on phenolic oligomers follow (k3, designated as the rate of liquid yield formation from lignin). The sequential hydrodeoxygenation of phenolic dimers and trimers produces guaiacol and syringol derivatives (k4). Followed by multi-steps of hydrodeoxygenation, guaiacol and syringol derivatives are converted to target cycloalkanes (k5). Meanwhile, the hydrogenolysis of Ph–OCH3 group produces the dominant CH4 in the gas phase. Based on the kinetics of lignin (k2, k3) as well as of typical phenolic monomer (k5) and dimer conversion (k4), it can be roughly estimated that the individual reaction rates follow the order (unit: g g−1 h−1): k5 (27.8) > k4 (20.6) ≫ k2 (0.58) > k3 (0.13), suggesting that the rate-determining step is the cleavage of phenolic oligomers. Therefore, the primary products from lignin conversion over Ni/ASA in dodecane are cyclic alkanes, because the secondary and subsequent hydrodeoxygenation steps are much faster than rates of lignin depolymerization and phenolic oligomers depolymerization.

Optimization of the metal sites of the Ni/ASA catalyst for enzymatic lignin depolymerization and influence of deposition-precipitation time of Ni/ASA

Realizing that Ni nanoclusters with an ASA support can dramatically influence the lignin transformation, the synthesis of Ni/ASA catalyst was subsequently optimized to achieve better catalytic performance including the alteration of Ni sites and ASA support. The Ni/ASA catalyst was synthesized by the deposition-precipitation (DP) method using urea as a hydrolysis agent at 90 °C. First, the DP time was altered from 2, 4, 6, 8, 10, 12, 14, 16, 20, to 26 h to evaluate the lignin conversion at 250 °C in the presence of 4 MPa H2. X-ray diffraction (XRD) and inductively coupled plasma (ICP) were used to monitor changes in contents and compositions of the catalyst. The XRD powder patterns (Fig. S4) showed the characteristic peaks of reduced metallic nickel (PDF 45-1027) at 45° and 51° suggesting that the particle sizes of nickel gradually increased from 11, 12, 13 to 19 nm as a function of DP time calculated by Debye–Scherrer formula (Fig. 5a). On the other hand, the ICP data demonstrated that the Ni loadings of Ni/ASA increased with the DP time extension as well (from 7.2%, 14.7% to 62.3% correspondingly). This is because longer DP times favor Ni(OH)2 precipitation at 90 °C by releasing the hydroxide ions.27 Therefore, the extended treatment times lead to higher contents as well as larger sizes of Ni nanoparticles.
image file: c6ra16977e-f5.tif
Fig. 5 (a) Relationship of Ni loading and Ni particle size of Ni/ASA towards DP time, and (b) the liquid yields from lignin conversion as a function of different DP times. General conditions: lignin (2.0 g), Ni/ASA catalyst (1.0 g), 250 °C, 4 MPa H2, dodecane (80 mL), 160 min, stirring at 700 rpm.

Fig. 5b showed the changes of lignin conversion and the liquid hydrocarbon towards the variations of deposition-precipitation time of Ni/ASA. From a DP time of 2 h to 8 h, the liquid yields from lignin conversion increased from 2.1% to 15.8%. It further reached the maximum liquid yield at 18.0% with DP time of 10 h. As DP time increased to 26 h, the liquid yield decreased from 18% to 4.4%. Taken together, these results allow us to conclude that the higher concentrations of Ni active sites (with the increases of Ni contents) at certain size range benefit for liquid formation; however, further increases in Ni concentrations lower the liquid yield due to the growth of Ni particle sizes.

Influence of calcination temperatures of Ni/ASA

Besides the influence of DP time to tailor the Ni nanoparticles, different calcination temperatures also alter the Ni particle size. The XRD patterns of Ni/ASA calcined at 460 °C, 550 °C, 650 °C, and 750 °C are shown in Fig. 6a. It was obvious that the XRD reflection intensities at 44° increased while the full width at half-maximum decreased accordingly. This indicates that the Ni crystal sizes grew upon increasing the reduction temperature from 460 °C to 750 °C. A gradual increase in crystal size of Ni (111) (from 11 nm to 18 nm) was observed based on Debye–Scherrer calculations. The TEM images also showed that the average particle size of Ni/ASA increased from 6.5 ± 2.1 nm, 9.5 ± 2.2 nm, 10.5 ± 3.5 nm, and 27.3 ± 11.1 nm with increased reduction temperatures (Fig. 6b). The evaluation of these samples with increased Ni crystal sizes (Fig. 6c) demonstrated that the lignin conversion and liquid yields decreased from 80% to 70%, and 44% to 24%, respectively (Fig. 7a). If we plot the values of conversion and liquid yields as a function of particle sizes with increasing reduction temperatures as determined by TEM (Fig. 7b), a linear decrease is seen suggesting that the crystal size of Ni significantly influences the depolymerization of lignin as well as the subsequent transformation of phenolic oligomers and monomers.
image file: c6ra16977e-f6.tif
Fig. 6 (a) XRD patterns of Ni/ASA catalysts with different reduction temperatures. (b) The TEM images of Ni/ASA catalyst with different reduction temperatures. (c) Influence of Ni/ASA reduction temperature towards the particle size.

image file: c6ra16977e-f7.tif
Fig. 7 (a) Influence of Ni/ASA reduction temperature towards the lignin conversion and the liquid yield. (b) The relation between the particle size and the lignin conversion, the liquid yield. General conditions: lignin (2.0 g), Ni/ASA catalyst (30.1 wt%, 1.0 g), 300 °C, 6 MPa H2, dodecane (80 mL), 160 min, stirring at 700 rpm.

Influence of cerium additives of Ni/ASA

The dispersion of Ni nanoparticles can be modified by adding different contents of Ce during the DP synthesis. The XRD patterns demonstrated that the crystal size of Ni particles followed the order: dNi/ASA-0.1% CedNi/ASA-0.3% CedNi/ASA-0.5% Ce < dNi/ASA-1% CedNi/ASA-0% Ce < dNi/ASA-2% Ce < dNi/ASA-0% Ce (Fig. 8). These results suggest that with the addition of small amounts of Ce (<0.5%), the particle size of Ni gradually decreased to 12 nm. The continuous addition of Ce led to the sharp growth of Ni nanoparticles (up to 18 nm with 3% Ce) as estimated from XRD patterns. These Ni catalysts containing Ce were known to have high oxygen storage capacity and can disperse the active metal efficiently and inhibit sintering. They also removed carbon from metallic surfaces.29 The main role played by cerium is generation of anionic vacancies for participation of reactive oxygen species. This can be tuned in the presence of other elements in the lattice.30 The rate enhancement with addition of cerium has also been seen with other Ce–Ni catalysed dry reforming31 and CO hydrogenation reactions.32 This makes Ni nanoparticles more dispersive on Ni/ASA-0.1Ce, Ni/ASA-0.3Ce, and Ni/ASA-0.5Ce.
image file: c6ra16977e-f8.tif
Fig. 8 (a) XRD patterns of Ni/ASA catalyst with different Ce additives. (b) Influence of Ce additive contents towards the particle size.

In agreement with this, the best results for lignin conversion to liquid fractions were as obtained at Ni/ASA-0.3Ce with yields of 23% (Fig. 9a). This is consistent with the changes in particle sizes and dispersions of Ni nanoparticles, as evidenced by the presence of a linear correlation between higher yields of the liquid fraction and smaller Ni particle sizes, as determined by XRD patterns (Fig. 9b). These results imply that the smaller particle sizes and better dispersions of metal particles favor lignin depolymerization and further oligomer hydrodeoxygenation.


image file: c6ra16977e-f9.tif
Fig. 9 (a) Influence of Ce additive contents towards the lignin derived liquid yields. (b) The relation between the particle size and the liquid yield. General conditions: lignin (2.0 g), Ni/ASA catalyst (30.1 wt%, 1.0 g), 250 °C, 4 MPa H2, dodecane (80 mL), 160 min, stirring at 700 rpm.

Impact of acidic sites of ASA towards enzymatic lignin hydrodeoxygenation

The acidity of Ni/ASA can be changed by changing SiO2/Al2O3 ratios (95/5, 90/10, 80/20, and 45/55) of the supported metal. The acid sites of Ni/ASA were examined by IR spectroscopy of adsorbed pyridine, while the metal sites were determined and characterized by ICP, XRD and TEM measurements. The surface information is obtained via N2 adsorption–desorption. The physicochemical data on the metallic and acidic properties of four different Ni/ASA catalysts are compiled in Table 4. The ICP results showed that these four samples had comparable Ni loading at around 30 wt% (Table 4). The N2 adsorption/desorption isotherms of the four Ni/ASA samples exhibited a characteristic type IV isotherms and the H3-type hysteresis loop (Fig. S6a). Meanwhile, the main pore types of Ni/ASA were mesopores with pore volumes of 0.29–0.65 cm3 g−1 and many micropores (volume volumes of 0.03–0.05 cm3 g−1; Table 4). As the SiO2/Al2O3 ratio decreased from 95/5 to 45/55, there was a decrease in the specific BET surface area from 312 m2 g−1 to 261 m2 g−1 and a decrease in the mesopore surface areas from 226 m2 g−1 to 148 m2 g−1. The pore volume decreased from 0.69 cm3 g−1 to 0.34 cm3 g−1.
Table 4 The physicochemical properties of Ni/ASA catalysts with different Al2O3 contents
SiO2/Al2O3 ratio SBETa (m2 g−1) Vporea (cm3 g−1) Ni loadingb (%) dNic (nm) Acid conc.d (mmol g−1)
Micro Meso Micro Meso LAS BAS
a Determined by N2 sorption.b Analysed by ICP.c Calculated by XRD patterns.d Analysed by IR spectra of adsorbed pyridine.
95–5 86 226 0.04 0.65 30.6 11.1 0.160 0.061
90–10 79 213 0.04 0.57 30.1 11.3 0.246 0.108
80–20 53 200 0.03 0.49 31.0 11.9 0.341 0.053
45–55 113 148 0.05 0.29 31.2 13.4 0.404 0.007


The ratio of Si to Al alters the acid concentrations of Brønsted and Lewis sites. By plotting the Al2O3 content of ASA versus their Brønsted, Lewis and total acid sites (Fig. 10a), it was noted the Lewis and total acid sites were continuously increasing by increasing Al2O3 content but this relationship did not hold for the highest Brønsted acid sites. As Al concentrations increased from 95/5 to 45/55, the Lewis acid sites and total acid sites both increased from 0.160 to 0.404 mmol g−1 and from 0.221 to 0.411 mmol g−1, respectively (Fig. S6b). Of note, the Brønsted acidic sites on Ni/ASA-90/10 (0.108 mmol g−1) were better than other Ni samples (Table 4, Fig. S6b).


image file: c6ra16977e-f10.tif
Fig. 10 The relationship between Al2O3 contents to (a) acid density, and (b) particle size.

The XRD powder patterns of the four ASA samples (Fig. S6c) suggested that they had almost identical Ni crystal sizes at around 11 nm, while the more acidic Ni/ASA (45/55) showed a Ni size at 13 nm. The larger Ni size compared to other samples is probably due to the smaller mesoporous area of this ASA-45/55 carrier. This was explained by Burattin et al. that the interface area was a key parameter in controlling the sizes of supported metal particles prepared by the DP method.28 The size trend was further confirmed by the TEM data (Fig. S6d), where Ni/ASA-45/55 exhibited the largest Ni nanoparticles (7.9 ± 1.5 nm). The other three Ni/ASA samples showed much smaller nanoparticles (5.7 ± 1.9 nm, 6.5 ± 2.1 nm, and 7.2 ± 1.7 nm), respectively. The XRD patterns and TEM images show that the increased Al2O3 contents of ASA lead to increased Ni particle sizes using the deposition precipitation method (Fig. 10b).

Four Ni/ASA samples with varying SiO2/Al2O3 ratios were evaluated and compared in enzymatic lignin hydrodeoxygenation at identical conditions of 300 °C and 4 MPa H2 (Fig. 11). The results showed that Ni/ASA-45/55 presented the lowest conversion (70.9%) and liquid yield (28.9%). This may stem from the lowest mesoporous surface area (148 m2 g−1), largest Ni particle size (13 nm), and lowest Brønsted acid concentration (0.007 mmol g−1). However, it was surprising to find that although Ni/ASA-90/10 and Ni/ASA-95/5 had similar surface areas at 213–226 m2 g−1 and Ni nanoparticle size at 11 nm, the Ni/ASA-90/10 obviously showed a much higher activity at attaining a conversion of 80.1% and a liquid yield at 46% than Ni/ASA-95/5 (conv: 77.9%, liquid yield: 32.1%).


image file: c6ra16977e-f11.tif
Fig. 11 Influence of different Al2O3 content of Ni/ASA catalysts towards the lignin conversion and the liquid yield. General conditions: lignin (2.0 g), Ni/ASA catalyst (30.1 wt%, 1.0 g), 300 °C, 6 MPa H2, dodecane (80 mL), 160 min, stirring at 700 rpm.

Discussion

With respect to direct lignin depolymerization and further hydrodeoxygenation, the crucial factors depend on rational selection of solvents and active sites under proper conditions. Generally, solvents that exhibit good solubility for lignin offer satisfactory activity in converting lignin. Hydrogenolysis of lignin was usually performed in water, dioxane, methanol, ethylene glycol, ethanol, 2-propanol as well as mixtures of these organic solvents with water.33 Interestingly, the different solvent performances were ascribed to a difference in lignin solubility, hydrogen solubility or hydrogen-donating capacity. Although these polar solvents and/or their aqueous solutions can dissolve some technical lignin, they can also decrease the catalytic activity of Ni catalysts. On the contrary, using solvents that enable the maximum Ni activity (e.g., alkanes) raises difficulties with regards to the solubility of lignin.

Thus, we concluded that the ability to convert lignin is a balance of lignin solubility and an active center on the selected solvents. Here, our results show that the polar solvents (ethylene glycol, ethanol, and 1,4-dioxane) can dissolve lignin well, but the best results for lignin deconstruction are achieved with the apolar solvent such as dodecane with its low lignin solubility. Therefore, polar solvents are not suitable for Ni-based catalysts because the catalytic activity of Ni is sensitive to solvents. The stable activity of Ni nanoparticles in dodecane leads to better performance in deconstruction of external C–O bonds of lignin molecule, and the consumption of lignin shifts the equilibrium for lignin solubility, which weakens the influence of the relatively low lignin solubility in dodecane towards lignin depolymerization. It is also rationally supposed that the state of the lignin may be a quasi-gel like in dodecane. This is beneficial for contact of Ni sites to the polymer substrate.

The results show that the liquid yields from lignin are increased linearly with trends in specific surface areas of Ni/oxides. This indicates that the key point for controlling the activity lies on the specific surface areas of diverse supports as well as the sizes of the metallic Ni. The high surface areas likely provide better contact opportunities of Ni sites to the lignin macromolecule. In terms of solid–solid reaction, efficient contact between active site and the polymer reactant is the most important factor. In the Ni/ASA catalysts, the common determinants include the sizes of active Ni sites and the specific surface areas of the supports. These are tailored by different deposition precipitation times, reduction temperatures, and varying amounts of Ce additives. This implies that, in principle, the particle sizes and dispersion of Ni nanoparticles influence the ability of the metal to attack the external lignin C–O bonds.

To find the synergistic relationship between the metal and the acid sites towards C–O bond cleavage of lignin, data for liquid yields and conversion of lignin were recorded as a function of Ni particle sizes, Brønsted and Lewis acid sites, as well as total acid sites of Ni/ASA (see Fig. 12). The acid sites were manipulated by modifying the Si/Al ratios of the ASA supports (Fig. S6, 10 and 11). Fig. 12 showed that efficiency toward lignin depolymerization and formation of derived phenolic monomer liquid yields were independent of Ni particles (Fig. 12a) as well as Lewis and total acid sites densities (Fig. 12b and c). Of note, the C–O bond cleavage yields were increased linearly with the almost linear increase in Brønsted acid densities (Fig. 12d). This indicates that the presence of the Brønsted acidic sites combined with the highly dispersed small Ni nanoparticles in the case of Ni/ASA-90/10 catalyst are critical for lignin depolymerization and hydrodeoxygenation—perhaps because of the enhanced metallic capability promoted by the Brønsted acidic sites.


image file: c6ra16977e-f12.tif
Fig. 12 The recorded lignin conversion and liquid yields as a function of (a) Ni particle sizes determined by TEM images, (b) total acid density, (c) Lewis acid density, and (d) Brönsted acid density.

The acidity of the support (especially Brønsted acid sites) enhanced the capability of Ni to cleave the C–O bonds in lignin. This indicates that the acid properties of the support can be further tailored to amplify the performance of the metallic sites of Ni. The Brønsted acid sites on Ni/ASA also showed considerable activities in catalyzing the dehydration reaction on cyclic alcohols,34 facilitating the formation of hydrocarbons from the hydrodeoxygenation of derived phenolic fragments (Table 1). In fact, metal–support interactions affect the activity of zeolite-supported metal catalysts in hydrogenation and hydrogenolysis reactions.35 Many studies have demonstrated that the activities of supported metals, especially the noble metals Pt or Pd, decreased with decreasing support acidity.36–38 In explaining the enhanced activities on noble metals, Larsen and Haller36 suggested a decreased electron density of Pt as the LTL zeolite acidity increased via cation exchange in the hydrogenation of benzene/toluene. XPS data showed that zeolite supported by Pt and Pd is electron deficient on acidic supports.37 This is also confirmed by the IR spectra of adsorbed CO that shifts to lower frequency due to a higher electron density of Pt on alkaline Y zeolite.38 Therefore, the support acidity (especially with Brønsted acid sites) has a significant influence towards the catalytic properties of the metal catalyst by tailoring the electronic structures of the metal particles via the support.

Conclusions

The Ni/ASA catalyst directly transforms lignin into liquid products, with nearly 80% conversion and 50 wt% liquid yield (determined by GC spectra) as well as 100% hydrocarbon selectivity. The –OCH3 groups are converted to CH4 in the gas phase, while the oxygen elements in lignin are removed by hydrodeoxygenation in the form of water. This facile and effective approach offers a one-pot method for conversion of lignin to hydrocarbons via Ni-based heterogeneous catalyst in the liquid dodecane phase. The apolar solvent dodecane has the highest activity towards lignin conversion probably because of increased Ni performance in dodecane. The separation of solvent and products is not necessary because alkanes are the solvent. After initial cleavage of external C–O bonds of lignin, further scission of C–O bonds in the phenolic secondary dimer and primary monomer units leads to much faster rates for forming target hydrocarbons. The slowest step in the lignin hydrodeoxygenation is cleavage of the C–O bond in the phenolic oligomers.

In addition, the metallic properties of Ni loading, size distribution, and dispersion as well as the acidic features of Brönsted and Lewis acid sites and the synergy of metal and acid sites on the silica alumina support can greatly influence the activity of lignin depolymerization. The key element in controlling the activity of Ni-based catalysts is the specific external surface areas of diverse supports as well as the sizes of metallic Ni sites. This is probably because of the high external surface areas that can provide good contact opportunities for Ni sites in the lignin macromolecule. The efficient contact of active sites in the polymer reactant is the most important factor for such solid–solid reaction. Furthermore, the acidity of the support (especially Brönsted acid sites) as modified by the Si/Al ratio of ASA significantly enhances the capabilities and alters the electronic structures of Ni nanoparticles for cleavage of the C–O linkages of lignin. This suggests that the synergy of acid and metal sites can be subtly tailored to strengthen the catalytic performance of Ni metallic sites.

Acknowledgements

We are grateful to the financial support of the Recruitment Program of Global Young Experts in China, the National Natural Science Foundation of China (Grant No. 21573075), and the Shanghai Pujiang Program (PJ1403500).

References

  1. (a) N. Yan and X. Chen, Nature, 2015, 525, 155–157 CrossRef PubMed ; (b) C. Li, X. Zhao, A. Wang, G. W. Huber and T. Zhang, Chem. Rev., 2015, 115, 11559–11624 CrossRef CAS PubMed ; (c) B. Ma, X. Yi, L. Chen, A. Zheng and C. Zhao, J. Mater. Chem. A, 2016, 4, 11330–11341 Search PubMed; (d) J. Zhang and C. Zhao, ACS Catal., 2016, 6, 4512–4525 CrossRef CAS ; (e) B. Ma, J. Hu, Y. Wang and C. Zhao, Green Chem., 2015, 17, 4610–4617 RSC ; (f) J. Zhang and C. Zhao, Chem. Commun., 2015, 51, 17249–17252 RSC ; (g) B. Ma and C. Zhao, Green Chem., 2015, 17, 1692–1701 RSC .
  2. (a) G. W. Huber, S. Iborra and A. Corma, Chem. Rev., 2006, 106, 4044–4098 CrossRef CAS PubMed ; (b) J. Zakzeski, P. C. A. Bruijnincx, A. L. Jongerius and B. M. Weckhuysen, Chem. Rev., 2010, 110, 3552–3599 CrossRef CAS PubMed .
  3. (a) A. G. Gayubo, A. T. Aguayo, A. Aguado, R. Atutxa and J. Bilbao, Ind. Eng. Chem. Res., 2004, 43, 2610–2618 CrossRef CAS ; (b) M. A. Jackson, D. L. Compton and A. A. J. Boateng, J. Anal. Appl. Pyrolysis, 2009, 85, 226–230 CrossRef CAS ; (c) Q. Lu, Y. Zhang, Z. Tang, W. Z. Li and X. F. Zhu, Fuel, 2010, 89, 2096–2103 CrossRef CAS .
  4. (a) J. E. Miller, L. Evans, A. Littlewolf and D. E. Trudell, Fuel, 1999, 78, 1363–1366 CrossRef CAS ; (b) W. Masaru, I. Hiroshi, O. Mitsumasa, T. Sato, T. Adschiri and K. Arai, Fuel, 2003, 82, 545–552 CrossRef ; (c) Wahyudiono, M. Sasaki and M. Goto, Chem. Eng. Process., 2008, 47, 1609–1619 CrossRef CAS .
  5. (a) J. M. Nichols, L. M. Bishop, R. G. Bergman and J. A. Ellman, J. Am. Chem. Soc., 2010, 132, 12554–12555 CrossRef CAS PubMed ; (b) J. M. W. Chan, S. Bauer, H. Sorek, S. Sreekumar, K. Wang and F. D. Toste, ACS Catal., 2013, 3, 1369–1377 CrossRef CAS ; (c) M. Jakob, R. Torsten, B. Claire, B. Julien and B. Carsten, Green Chem., 2015, 17, 5001–5008 RSC .
  6. (a) C. Zhao and J. A. Lercher, Angew. Chem., Int. Ed., 2012, 51, 5935–5940 CrossRef CAS PubMed ; (b) W. Schutyser, S. Van den Bosch, T. Renders, T. De Boe, S. F. Koelewijn, A. Dewaele, T. Ennaert, O. Verkinderen, B. Goderis and C. M. Courtin, Green Chem., 2015, 17, 5035–5045 RSC .
  7. (a) Z. Luo, Y. Wang, M. He and C. Zhao, Green Chem., 2016, 18, 433–441 RSC ; (b) A. K. Deepa and P. L. Dhepe, ACS Catal., 2015, 5, 365–379 CrossRef CAS ; (c) H. Wang, H. Ruan, H. Pei, H. Wang, X. Chen, M. P. Tucker, J. Cort and B. Yang, Green Chem., 2015, 17, 5131–5135 RSC ; (d) Z. Luo and C. Zhao, Catal. Sci. Technol., 2016, 6, 3476–3484 RSC .
  8. (a) D. D. Laskar, M. P. Tucker, X. Chen, G. L. Helmsc and B. Yang, Green Chem., 2014, 16, 897–910 RSC ; (b) J. Zhang, J. Teo, X. Chen, H. Asakura, T. Tanaka, K. Teramura and N. Yan, ACS Catal., 2014, 4, 1574–1583 CrossRef CAS .
  9. (a) W. Deng, H. Zhang, X. Wu, R. Li, Q. Zhang and Y. Wang, Green Chem., 2015, 17, 5009–5018 RSC ; (b) J. Kim, J. Park, U. Kim and J. W. Choi, Energy Fuels, 2015, 8, 5154–5163 CrossRef ; (c) Y. Shao, Q. Xia, X. Liu, G. Lu and Y. Wang, ChemSusChem, 2015, 10, 1761–1767 CrossRef PubMed .
  10. (a) F. P. Bouxin, A. McVeigh, F. Tran, N. J. Westwood, M. C. Jarvis and S. D. Jackson, Green Chem., 2015, 17, 1235–1242 RSC ; (b) A. L. Jongerius, P. C. A. Bruijnincx and B. M. Weckhuysen, Green Chem., 2013, 15, 3049–3056 RSC .
  11. (a) S. V. Bosch, W. Schutyser, R. Vanholme, T. Driessen, S. F. Koelewijn, T. Renders, B. D. Meester, W. J. J. Huijgen, W. Dehaen, C. M. Courtin, B. Lagrain, W. Boerjan and B. F. Sels, Energy Environ. Sci., 2015, 8, 1748–1763 RSC ; (b) S. V. Bosch, W. Schutyser, S. F. Koelewijn, T. Renders, C. M. Courtin and B. F. Sels, Chem. Commun., 2015, 51, 13158–13161 RSC .
  12. (a) N. Yan, C. Zhao, P. J. Dyson, C. Wang, L. Liu and Y. Kou, ChemSusChem, 2008, 1, 626–629 CrossRef CAS PubMed ; (b) N. Yan, Y. A. Yuan, R. Dykeman, Y. A. Kou and P. J. Dyson, Angew. Chem., 2010, 122, 5681–5685 CrossRef .
  13. (a) W. Schutyser, S. V. Bosch, J. Dijkmans, S. Turner, M. Meledina, G. V. Tendeloo, D. P. Debecker and B. F. Sels, ChemSusChem, 2015, 10(8), 1802–1818 Search PubMed ; (b) A. G. Sergeev, J. D. Webb and J. F. Hartwig, J. Am. Chem. Soc., 2012, 134, 20226–20229 CrossRef CAS PubMed ; (c) A. G. Sergeev and J. F. Hartwig, Science, 2011, 332, 439–443 CrossRef CAS PubMed .
  14. (a) X. Huang, C. Atay, T. I. Korányi, M. D. Boot and E. J. M. Hensen, ACS Catal., 2015, 5, 7359–7370 CrossRef CAS ; (b) X. Huang, C. Atay, T. I. Korányi, M. D. Boot and E. J. M. Hensen, ChemSusChem, 2014, 7, 2276–2288 CrossRef CAS PubMed .
  15. Y. Ren, M. Yan, J. Wang, Z. C. Zhang and K. Yao, Angew. Chem., Int. Ed., 2013, 52, 12674–12678 CrossRef CAS PubMed .
  16. R. Ma, W. Hao, X. Ma, Y. Tian and Y. Li, Angew. Chem., Int. Ed., 2014, 53, 1–7 CrossRef .
  17. J. He, C. Zhao and J. A. Lercher, J. Am. Chem. Soc., 2012, 134, 20768–20775 CrossRef CAS PubMed .
  18. Q. Song, F. Wang and J. Xu, Chem. Commun., 2012, 48, 7019–7021 RSC .
  19. Y. Jiang, Z. Li, X. Tang, Y. Sun, X. Zeng, S. Liu and L. Lin, Energy Fuels, 2015, 29, 1662–1668 CrossRef CAS .
  20. J. Kong, M. He, J. A. Lercher and C. Zhao, Chem. Commun., 2015, 51, 17580–17583 RSC .
  21. (a) X. Wang and R. Rinaldi, Angew. Chem., Int. Ed., 2013, 52, 11499–11503 CrossRef CAS PubMed ; (b) P. Ferrini and R. Rinaldi, Angew. Chem., Int. Ed., 2014, 53, 8634–8639 CrossRef CAS PubMed .
  22. (a) A. Rahimi, A. Ulbrich, J. J. Coon and S. S. Stahl, Nature, 2014, 515, 249–252 CrossRef CAS PubMed ; (b) A. Rahimi, A. Azarpira, H. Kim, J. Ralph and S. S. Stahl, J. Am. Chem. Soc., 2013, 135, 6415–6418 CrossRef CAS PubMed .
  23. (a) R. H. J. Creighton, D. Gibbs and H. Hibbert, J. Am. Chem. Soc., 1944, 66, 32–37 CrossRef CAS ; (b) R. H. J. Creighton and H. Hibbert, J. Am. Chem. Soc., 1944, 66, 37–38 CrossRef CAS .
  24. (a) O. Faix, Holzforschung, 1991, 45, 21–27 CrossRef CAS ; (b) O. Faix, C. Grünwald and O. Beinhoff, Holzforschung, 1992, 46, 425–431 CrossRef CAS .
  25. (a) R. Sjöholm, B. Holmbom and N. Akerback, J. Wood Chem. Technol., 1992, 12, 35–52 CrossRef ; (b) F. Lu and J. Ralph, J. Wood Chem. Technol., 1998, 18, 219–233 CrossRef CAS .
  26. J. P. Mikkola, H. Vainio, T. Salmi, R. Sjöholm, T. Ollonqvist and J. Väyrynen, Appl. Catal., A, 2000, 196, 143–155 CrossRef CAS .
  27. W. Song, Y. Liu, E. Baráth, C. Zhao and J. A. Lercher, Green Chem., 2015, 17, 1204–1218 RSC .
  28. (a) P. Burattin, M. Che and C. Louis, J. Phys. Chem. B, 1997, 101, 7060–7074 CrossRef CAS ; (b) P. Burattin, M. Che and C. Louis, J. Phys. Chem. B, 1998, 102, 2722–2732 CrossRef CAS .
  29. J. Han, X. Liu, J. Yue, B. Xi, S. Gao and G. Xu, Energy Fuels, 2014, 28, 4934–4941 CrossRef CAS .
  30. (a) J. P. Bortolozzi, T. Weiss, L. B. Gutierrez and M. A. Ulla, Chem. Eng. J., 2014, 246, 343–352 CrossRef CAS ; (b) N. Liang, X. Zhang, H. An, X. Zhao and Y. Wang, Green Chem., 2015, 17, 2959–2972 RSC .
  31. S. Zhang, S. Muratsugu, N. Ishiguro and M. Tada, ACS Catal., 2013, 3, 1855–1864 CrossRef CAS .
  32. F. Meng, Z. Li, J. Liu, X. Cui and H. Zheng, J. Nat. Gas Sci. Eng., 2015, 23, 250–258 CrossRef CAS .
  33. W. Schutyser, S. Van den Bosch, T. Renders, T. De Boe, S. F. Koelewijn, A. Dewaele, T. Ennaert, O. Verkinderen, B. Goderis, C. M. Courtinc and B. F. Sels, Green Chem., 2015, 17, 5035–5045 RSC .
  34. C. Zhao, Y. Kou, A. A. Lemonidou, X. Li and J. A. Lercher, Angew. Chem., Int. Ed., 2009, 48, 3987–3990 CrossRef CAS PubMed .
  35. B. L. Mojet, M. J. Kappers, J. T. Miller and D. C. Koningsberge, Stud. Surf. Sci. Catal., 1996, 101, 1165–1174 CrossRef CAS .
  36. G. Larsen and G. L. Haller, Catal. Lett., 1989, 3, 103–110 CrossRef CAS .
  37. B. L. Mojet, J. T. Miller, D. E. Ramaker and D. C. Koningsberge, J. Catal., 1999, 186, 373–386 CrossRef CAS .
  38. Z. Karpinski, S. N. Gandhi and W. M. H. Sachtler, J. Catal., 1993, 141, 337–346 CrossRef CAS .

Footnote

Electronic supplementary information (ESI) available. See DOI: 10.1039/c6ra16977e

This journal is © The Royal Society of Chemistry 2016
Click here to see how this site uses Cookies. View our privacy policy here.