Effect of co-doping of alkali metal ions on Ca0.5RE1−x(MoO4)2:xEu3+ (RE = Y, La) phosphors with enhanced luminescence properties

Venkatakrishnan Mahalingam and Jagannathan Thirumalai*
Department of Physics, B. S. Abdur Rahman University, Vandalur, Chennai – 600 048, Tamilnadu, India. E-mail: jthirumalai@bsauniv.ac.in; thirumalaijg@gmail.com; Fax: +91-44-2275-0520; Tel: +91-44-22751347 Tel: +91-44-22751348 Tel: +91-44-22751349 Tel: +91-44-22751350

Received 29th June 2016 , Accepted 5th August 2016

First published on 8th August 2016


Abstract

A series of Ca0.5RE1−x(MoO4)2:xEu3+,M+ (RE = Y, La; M = Li, K and Na) phosphors were synthesized by a facile hydrothermal method. X-ray diffraction suggested that these phosphors could be indexed to a scheelite tetragonal Ca0.5RE1−x(MoO4)2 (RE = Y, La) phase with a space group of I41/a with high purity. FESEM indicated the signs of bi-pyramid-like micro-architectures. Elemental mapping analysis provided evidence of the incorporation and uniform distribution of all the elements. X-ray photoelectron spectroscopy (XPS) confirmed the presence of all the elements. The PL properties of Ca0.5RE1−x(MoO4)2:xEu3+,M+ (RE = Y, La; M = Li, K and Na) phosphors were analysed extensively. The obtained results suggest that the characteristic red emission is due to the hypersensitive electric dipole 5D07F2 transition. The emission intensity of Ca0.5RE1−x(MoO4)2:xEu3+,Na+ (RE = Y, La) is higher than Li+ and K+ co-doped Ca0.5RE1−x(MoO4)2:xEu3+ (RE = Y, La). This can be explained by the charge compensation effect. Judd–Ofelt theory was adopted to examine the photophysical properties. The luminescence decay time values were estimated. The CIE chromaticity co-ordinates were derived from the emission spectra and the values were found to be close to the NTSC standard values. Hence, the prepared phosphors are suitable for display applications.

1. Introduction

In the current trend, the accurate architectural exploitation of inorganic nanocrystals, microcrystals, and submicrocrystals with well-defined morphologies and a mono-disperse nature and simultaneously accurate adjustable sizes forms a focus of research owing to the close relationship between the physical and chemical properties of the materials along with their unique structural factors such as size, shape, surface, and dimensionality.1 Mastering over the size, shape, and dimensionality of the micro/nanocrystals enable control of their unique properties and also improves their usage for a particular application.2 Lanthanide-activated luminescent micro/nanomaterials show promising optical properties, which can be developed for the improvement of phosphors and display applications.3

Among the different rare earth activated phosphor materials, the family of molybdates possess scheelite-like structures, which are broadly considered as the hosts for the characteristic luminescence emission of rare earth ions.4 Double alkaline rare earth molybdates A0.5RE(MoO4)2 (A = Ca, RE = trivalent rare earth cation) possess a similar scheelite-like (CaWO4) structure and show tremendous hydrolytic and thermal stability, which could be broadly applied in white light-emitting diodes (W-LEDs)5 and proficient phosphors.6 When RE3+ ions occupy the lattice sites with non-centro-symmetry, the concentration quenching effect barely occurs in A0.5RE(MoO4)2 activated with rare earth ions.7 Recently, Eu3+-activated A0.5RE(MoO4)2 was investigated as a potential red emitting phosphor and was considered as a perfect substitute for the commercial red phosphors for applications in WLEDs.8 Furthermore, less effort has been paid to increase the luminescence efficacy of A0.5RE(MoO4)2:Eu3+ for better performance.9

Several methodologies, including sol–gel,7 solid-state reaction method,10–14 combustion method,15 hydrothermal method,1,4,16–18 polyol method,19 and co-precipitation,20 have been studied broadly to synthesize A0.5RE(MoO4)2-based micro/nano crystals that are attractive. However, efficient control over the morphology, compositions and crystal size, which are critical for high luminescence performance, is a challenge faced. The EDTA-assisted hydrothermal approach yields various structures, such as building blocks and the uniform size distribution; as a result, the overall morphology could be modified in a highly accurate and controllable manner.4,16,18

Currently, there is a potential research on the improvement of highly proficient phosphors with the inclusion of co-dopants of rare earth or without rare earth dopants into phosphors.1 The responsibility of rare earth co-dopants is in general related to the mechanism of energy transfer, cross-relaxation, and up-conversion.7 The existence of alkali metal ions, such as Li+, K+ and Na+, in the A0.5RE(MoO4)2:Eu3+ matrix increases the luminescence of Eu3+ ions significantly. The alkali metal ions substitutions in the host would lead a distortion of the crystal field around the rare-earth ions, which remarkably enhances the luminescence intensity.21 Therefore, it is important to set up a precise method to synthesize A0.5RE(MoO4)2:Eu3+,M+ red phosphors with a bi-pyramid like shape with high dispersibility and narrow size distribution.4 In this crystal structure, rare-earth ions and alkali metal ions would be distributed randomly over the A site of A0.5RE(MoO4)2 host. The arbitrary arrangement of rare earth species could induce the non-uniform broadening of optical spectra because Eu3+ ions were activated in the crystals and might occupy the respective positions of RE3+.13 Thus, the MoO42− group has good absorption in the UV region, hence the possible energy transfer from the MoO42− group to rare-earth ions could readily occur, consequently improving the quantum efficiency of rare-earth ion activated materials.6 Liu et al.1 reported the synthesis of CaMoO4:Eu3+,M+ (M = Li, Na, K) and found that Li+ ions co-doped CaMoO4:Eu3+ has the best charge compensation effect. Luitel et al.21 synthesized the CaMoO4:RE3+,Yb3+,M+ (RE = Er, Ho, Tm; M = Li, Na, K, Rb) phosphors by a facile hydrothermal method and concluded that K+ substituted phosphors show intense up-conversion emissions. To the best of our knowledge, none of them have reported Ca0.5RE1−x(MoO4)2:xEu3+,M+ (RE = Y, La; M = Li, K and Na).

From the abovementioned investigations and the motivation to develop efficient red emitting phosphors, this paper reports the synthesis of rare-earth doped and alkali metal ion co-doped phosphors using a surfactant-assisted hydrothermal method for Ca0.5RE1−x(MoO4)2:xEu3+,M+ (RE = Y, La; M = Li, K and Na). The host Ca0.5Y1−x(MoO4)2 and Ca0.5La1−x(MoO4)2 are designated as CYM and CLM, respectively. The samples possess bi-pyramid-like micro- and nano architectures. The as synthesized samples were analysed based on the characterization techniques such as X-ray diffraction (XRD), field emission scanning electron microscopy (FESEM), elemental mapping analysis, X-ray photoelectron spectroscopy (XPS), photoluminescence (PL) spectroscopy, Judd–Ofelt analysis, and color chromaticity co-ordinates (CIE). The fluorescence decay times and photometric parameters were evaluated. Thus, the prepared phosphors are suitable for luminescent display devices applications.

2. Experimental details

2.1 Synthesis of Ca0.5RE1−x(MoO4)2:xEu3+,M+ (RE = Y, La; M = Li, K and Na) bi-pyramid-like micro/nano-architectures

All the chemicals involved in the syntheses were of analytical grade (99.9% purity). The stoichiometric quantities of CaO, RE2O3, (RE = Y, La) and Eu2O3 along with respective alkali compounds of Na2CO3, K2CO3, and Li2CO3 were taken. These were converted to the nitrate form using dilute HNO3. Subsequently, water-soluble Na2MoO4·2H2O was dissolved completely in 20 mL of double-distilled water by rigorous stirring. The mixtures of rare-earth nitrates along with alkali nitrates for co-doping were added dropwise to the Na2MoO4·2H2O solution until a whitish colloidal precipitate was obtained. The obtained whitish colloidal precipitate was further stirred for 30 minutes. Subsequently, 1.5 mM of EDTA was dissolved fully in 20 mL of double-distilled water that was mixed with the white colloidal solution. By adding the appropriate amount of NaOH solution, the pH of the final product was adjusted to between 7 and 8. After stirring further for 30 min, the obtained solution was transferred carefully to a 100 mL Teflon lined autoclave and that was sealed in a stainless steel vessel. The autoclave was kept at 180 °C for 24 h. Once the heat treatment was over, the autoclave was allowed to cool to room temperature. The final product was collected and washed with double-distilled water, centrifuged and dried at 60 °C in air for 5 h.

2.2 Characterization studies

The crystal structures and phase purities of the as-prepared phosphors were observed using the PANalytical X'Pert PRO Materials Research X-ray Diffractometer (Almelo, The Netherlands) furnished with CuKα radiation (λ = 0.154060 nm) with a scanning rate of 0.02° s−1 and 2θ range of 15–60°. The morphological studies of the synthesized materials and elemental mapping measurements were performed by field emission scanning electron microscopy (FESEM-Quanta 3D FEG) operated at an accelerating voltage of 15–20 kV. The carbon coating was applied to both sides to minimize the damage by the electron beam. The energy loss stimulated by the K, L shell electron ionization was used for the mapping of Ca, Y, Mo, O and Eu. X-ray photoelectron spectroscopy (XPS) analysis was carried out using LAS-3000 surface analysis system (RIBER, France) with AlKα X-rays (1489.6 eV, width 0.5 eV). PL excitation and emission spectra as well as luminescence decay time measurements were obtained using a Cary bench-top spectrophotometer (AGILENT Instruments, USA).

3. Results and discussion

3.1 X-ray diffraction studies

The crystal structure and phase identification of the synthesized powders were analysed from the indexed powder X-ray diffraction patterns. Fig. 1(a) and (b) depict the indexed XRD patterns of Ca0.5RE(1−x)(MoO4)2:xEu3+,M+ (RE = Y, La; M = Li, K and Na) obtained after a 24 h reaction time. The compound was crystallized in the scheelite tetragonal crystal structure with a space group of I41/a.10 All diffraction peaks were properly indexed. The planes (1 0 1), (1 1 2), (0 0 4), (2 0 0), (2 0 4), (2 2 0), (1 1 6), and (1 3 2) were in well accordance with JCPDS card no. 82-2369 of NaY(MoO4)2.4 The impurity peaks were not observed. The strongest peak of (1 1 2) was obtained at 28.92°. Similarly, (1 0 1), (1 1 2), (0 0 4), (2 0 0), (2 0 4), (2 2 0), (1 1 6), (3 1 2) and (2 2 4) planes were also in good acceptance with JCPDS card no. 79-2243 of Na0.5La0.5MoO4.14 The synthesized samples have high phase purity as no discernible impurity or other phases are found.
image file: c6ra16753e-f1.tif
Fig. 1 Indexed powder XRD patterns of the as-synthesized (a) Ca0.5Y(1−x)(MoO4)2:xEu3+,M+ (M = Li, K and Na) and (b) Ca0.5La(1−x)(MoO4)2:xEu3+,M+ (M = Li, K and Na) phosphors.

3.2 Morphological analysis

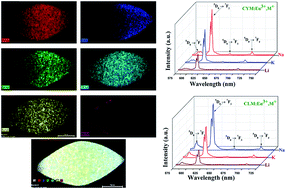
To understand the surface morphology, size and mechanism of the formation of the hierarchical bi-pyramid like structures, an EDTA-assisted hydrothermal route was carried out for 24 hours reaction time.4 The as-synthesized products were analysed by FESEM. Fig. 2(a–c) and 3(a–c) show the FESEM images of Ca0.5Y(1−x)(MoO4)2:xEu3+,M+ (M = Li, K and Na) and Ca0.5La(1−x)(MoO4)2:xEu3+,M+ (M = Li, K and Na) for x = 0.16 M for 24 hours reaction time at 180 °C, respectively. The methodical studies of detailed evolution of morphology and formation mechanism of hierarchically self-assembled bi-pyramid like micro/nano-architectures were performed previously by our group.4,18 The bi-pyramid like micro/nano-architectures were obtained when EDTA is used as a surfactant. In the present scenario, the evolution of bi-pyramid like morphology can be seen. The morphology for various reaction times was not shown because there is no significant variations in the morphology. The best morphology was obtained for 24 hours reaction time. Hence, those morphologies are shown for Ca0.5RE(1−x)(MoO4)2:xEu3+,M+ (RE = Y, La; M = Li, K and Na). The previous studies suggest that Eu3+ ions are distributed homogeneously in the crystal structure. This was confirmed by the elemental mapping associated with FESEM. As a representative, the relative distribution of the various important elements, such as Ca, Y, Mo, O, Eu, and Na, were investigated. Fig. 4(a–g) of elemental mapping clearly show the incorporation of rare earth ions and their homogeneous distribution inside the bi-pyramid-like structure.
image file: c6ra16753e-f2.tif
Fig. 2 FESEM images of the as prepared Ca0.5Y(1−x)(MoO4)2:xEu3+ co-doped with different alkali metal ions (a) Li+, (b) K+ and (c) Na+.

image file: c6ra16753e-f3.tif
Fig. 3 FESEM images of the as synthesized Ca0.5La(1−x)(MoO4)2:xEu3+ co-doped with various alkali metal ions (a) Li+, (b) K+ and (c) Na+.

image file: c6ra16753e-f4.tif
Fig. 4 Elemental mapping of (a) Mo, (b) O, (c) Ca, (d) Y, (e) Eu, (f) Na and (g) overall distribution of elements.

3.3 X-ray photoelectron spectroscopy studies

To investigate the chemical composition and valence states of the material, XPS was used. Fig. 5(a) and (b) show the representative XPS survey spectra of Ca0.5Y1−x(MoO4)2:xEu3+,Na+ and Ca0.5La1−x(MoO4)2:xEu3+,Na+, respectively. Based on XPS analysis, it was confirmed that the presence of core levels of Ca, Y, Mo, O, Eu, and Na were present in Ca0.5Y1−x(MoO4)2:xEu3+,Na+ obtained in the range of 100–300 eV (Eu 4d at 128 eV, Y 3d5/2 at 156 eV, Y 3d3/2 at 158 eV, Mo 3d5/2 at 228 eV, Mo 3d3/2 at 233 eV, Eu 4p at 281 eV); 300–600 eV(Y 3p at 311 eV, Ca 2p3/2 at 347 eV, Ca 2p1/2 at 352 eV, Y 3s at 392 eV, Mo 3p3/2 at 395 eV, Mo 3p1/2 at 413 eV, Mo 3s at 506 eV, O 1s at 530 eV) and 800–1200 eV (Na 1s at 1071 eV, Eu 3d5/2 at 1125 eV, Eu 3d3/2 at 1156 eV). Similarly, the presence of core levels of Ca, La, Mo, O, Eu, and Na in Ca0.5La1−x(MoO4)2:xEu3+,Na+ present in the range of 100–300 eV (La 4d at 103 eV, Eu 4d at 126 eV, Mo 3d5/2 at 228 eV, Mo 3d3/2 at 233 eV, Eu 4p at 284 eV); 300–600 eV (Ca 2p3/2 at 347 eV, Ca 2p1/2 at 351 eV, Mo 3p3/2 at 394 eV, Mo 3s at 507 eV, O 1s at 531 eV) and 800–1200 eV (La 3d5/2 at 836 eV, La 3d3/2 at 853 eV, Na 1s at 1071 eV, Eu 3d5/2 at 1126 eV, Eu 3d3/2 at 1154 eV). The binding energy data for Ca0.5Y1−x(MoO4)2:xEu3+,Na+ and Ca0.5La1−x(MoO4)2:xEu3+,Na+ were calibrated using carbon (1s, 283.5 eV) as the reference. All the peaks perfectly coincide with the literature.22
image file: c6ra16753e-f5.tif
Fig. 5 XPS survey spectrum of (a) Ca0.5Y(1−x)(MoO4)2:xEu3+,Na+ and (b) Ca0.5La(1−x)(MoO4)2:xEu3+,Na+.

3.4 Photoluminescence studies

(i) Ca0.5Y1−x(MoO4)2:xEu3+,M+ (M = Li, K and Na). The PL excitation spectra of the Ca0.5Y1−x(MoO4)2:xEu3+,M+ (M = Li, K and Na) for x = 0.16 M as a representative is given in Fig. 6(a). The PLE spectra is monitored using an emission wavelength of 616 nm comprising strong broad bands along with several sharp peaks.4,10 The broad band ranging from 225 to 350 nm with a maximum at ∼293 nm was designated as the charge transfer band (CTB).6 This might be due to ligand-to-Eu3+ metal charge transfer transitions (LMCT).23 In addition, sharp peaks situated at 362 nm (7F05D4), 382 nm (7F05L7), 395 nm (7F05L6), 416 nm (7F05D3), 465 nm (7F05D2), and 535 nm (7F05D1) are due to the 4f–4f transition of Eu3+ ions.18 Compared to all the peaks, the sharpest and most intense peak was found at 395 nm. The as prepared phosphor could be suitably excited by this UV region. The maximum intensity in the excitation spectra is for Ca0.5Y1−x(MoO4)2:xEu3+,Na+ phosphor compared to Li+ and K+ co-doped Ca0.5Y1−x(MoO4)2:xEu3+. The room-temperature PL emission spectra excited at 395 nm excitation wavelength for Ca0.5Y1−x(MoO4)2:xEu3+,M+ (M = Li, K and Na) for x = 0.16 M is shown in Fig. 6(b) for 24 hours reaction time at 180 °C.4 The PL spectra depict numerous intra-configurational f–f transitions arising from Eu3+ 5D0 excited state to the 7FJ (J = 1, 2, 3, and 4) ground states.18 When excited with various excitation wavelengths and LMCT, no significant variation was detected in the emission spectra. The PL emission spectra comprise a strong red emission peak at 617 nm corresponding to the 5D07F2 transition, and some weak emissions at 593 nm (5D07F1), 656 nm (5D07F3) and 703 nm (5D07F4) transitions. Among these two emission bands, 5D07F2 and 5D07F1 transitions are due to the characteristic emissions of Eu3+ ions. Following the forced electric dipole (ED) transition, whose selection rule (ΔJ ≤ 6, when J or J′ = 0, ΔJ = 2, 4, 6), the 5D07F2 transition is considered to be the ED transition, which comes under the category of a hypersensitive transition; hence, its intensity is most sensitive to crystal field.11,16 In general, this characteristic emission is dominant when the Eu3+ ions occupy the sites of non-inversion centers. For comparison, the 5D07F1 transition was attributed to a magnetic dipole (MD) transition; thus, the crystal field would have a meagre effect on its intensity. The hypersensitive red emission at 617 nm (5D07F2) suggests that the Eu3+ ions occupy the low symmetry sites without an inversion center in Ca0.5Y(MoO4)2 host lattice.4 The PL emission intensity is higher for Ca0.5Y1−x(MoO4)2:xEu3+,Na+ than the Li+ and K+ co-doped Ca0.5Y1−x(MoO4)2:xEu3+.
image file: c6ra16753e-f6.tif
Fig. 6 (a) PLE spectra of the Ca0.5Y(1−x)(MoO4)2:xEu3+,M+ (M = Li, K and Na) phosphors and (b) PL emission spectra for the different alkali metal ion co-doped phosphors Ca0.5Y(1−x)(MoO4)2:xEu3+,M+ (M = Li, K and Na).
(ii) Ca0.5La1−x(MoO4)2:xEu3+,M+ (M = Li, K and Na). The photoluminescence properties of the as prepared samples of Ca0.5La1−x(MoO4)2:xEu3+,M+ (M = Li, K and Na) phosphors were analysed at room temperature. Fig. 7(a) shows that the excitation spectra of Ca0.5La1−x(MoO4)2:xEu3+,M+ (M = Li, K and Na) contains a broad absorption band from 220 to 350 nm with a center at ∼275 nm due to a charge-transfer band between O2− and Mo6+ ions and several sharp peaks at 360 nm (7F05D4), 382 nm (7F05L7), 394 nm (7F05L6), 414 nm (7F05D3), 464 nm (7F05D2), and 535 nm (7F05D1) designated as the 4f–4f transition of Eu3+ ions.11 Among all these transitions, the excitation wavelength of 394 nm UV excitation is appropriate for the excitation of these phosphors.10 The highest intensity in the excitation spectra was for the Ca0.5La1−x(MoO4)2:xEu3+,Na+ phosphor when compared to Li+ and K+ co-doped Ca0.5La1−x(MoO4)2:xEu3+. The reason for the enhanced intensity due to the phosphors Ca0.5RE1−x(MoO4)2:xEu3+,Na+ (RE = Y, La) is explained in the following section. Fig. 7(b) illustrates the PL emission spectra obtained at room temperature for the Ca0.5La1−x(MoO4)2:xEu3+,M+ (M = Li, K and Na) phosphors for x = 0.16 M synthesized for a 24 hour reaction time at 180 °C.4 The emission peaks are centered at 587 nm (5D07F1), 615 nm (5D07F2), 654 nm (5D07F3), and 701 nm (5D07F4) considered to be radiative transitions of the Eu3+ ions.18,23 It is evident that the strongest emission peak was found at 615 nm owing to the typical forced electric dipole transition of Eu3+ ions. The intensities of the different 5D07FJ transitions would depend on the local symmetry of the crystal field of the Eu3+ ions.4,11 In the sites with inversion symmetry, a magnetic dipole transition is dominant, whereas in the site with non-inversion symmetry, electric dipole transition is dominant.24 The 5D07F2 is hypersensitive to the crystal field environment having the highest intensity, while 5D07F1 magnetic dipole transition is insensitive to the crystal field environment and thus the intensity is weak.25 In the alkali metal ions, co-doped PL emission spectra, as shown in Fig. 7(b), exhibit higher intensity for Na+ co-doped with Ca0.5La1−x(MoO4)2:xEu3+ than the other metal ions K+ and Li+. The possible reason for the enhanced intensity could be explained based on the charge compensation effect.26 From these studies, it is clear that as Ca0.5RE1−x(MoO4)2:xEu3+,M+ (RE = Y, La; M = Li, K and Na) possesses the scheelite tetragonal crystal structure, it could be used for display applications.
image file: c6ra16753e-f7.tif
Fig. 7 (a) PL excitation spectra for Ca0.5La(1−x)(MoO4)2:xEu3+,M+ (M = Li, K and Na) phosphors and (b) PL emission spectra for the various alkali metal ions activated phosphors Ca0.5La(1−x)(MoO4)2:xEu3+,M+ (M = Li, K and Na).

3.5 Effect of alkali cations and rare earth ions on the luminescence properties of Ca0.5RE1−x(MoO4)2:xEu3+ (RE = Y, La)

In this matrix, Eu3+ and M+ co-doped in Ca0.5RE(MoO4)2 (RE = Y, La) would accelerate the distortion in a lattice and the lattice symmetry is being lowered.11 The co-doped Eu3+ and M+ at Ca2+ sites in the synthesized samples could play a dominant role with increased luminescence intensity.1 This is based on modifying the symmetry and their surrounding in the vicinity of rare earth ions by adding charge compensators of alkali metal ions.21 Fig. 6(b) and 7(b) depict the PL emission spectra of Ca0.5Y1−x(MoO4)2:xEu3+,M+ (M = Li, K and Na) and Ca0.5La1−x(MoO4)2:xEu3+,M+ (M = Li, K and Na) phosphors for x = 0.16 M with a 24 hours reaction time. The emission intensity was increased enormously for Na+ ion co-doped Ca0.5RE1−x(MoO4)2:xEu3+ (RE = Y, La). This could be due to the charge compensation effect and the possible mechanism is Ca2+ → 2M+ (M = Li+, K+, Na+), which was described in detail in our previous work.26 In addition, the ionic radius of Na+ (0.97 Å) is closer to Ca2+ (1.12 Å), which is comparatively better than that of K+ (1.33 Å) and Li+ (0.59 Å).26 Hence, the Ca2+ ions are effectively replaced by the alkali metal ions. This is the possible mechanism for the enhanced intensity. In addition, to identify the best charge compensator ion, we varied the precursors for the preparation of Na+, K+, and Li+ charge compensated Ca0.5RE1−x(MoO4)2:xEu3+ (RE = Y, La) by taking stoichiometric amounts of Na2MoO4·2H2O, K2MoO4·2H2O and Li2MoO4·2H2O, respectively. Fig. 8(a) and (b) show the PL excitation and emission spectra of Ca0.5Y1−x(MoO4)2:xEu3+,M+ (M = Li, K and Na) phosphors and Fig. 8(c) and (d) depict the respective PL excitation and emission spectra for the phosphors Ca0.5La1−x(MoO4)2:xEu3+,M+ (M = Li, K and Na).
image file: c6ra16753e-f8.tif
Fig. 8 (a) PL excitation and (b) PL emission spectra for Ca0.5Y(1−x)(MoO4)2:xEu3+,M+ (M = Li, K and Na) phosphors; (c) PL excitation and (d) PL emission spectra for the various alkali metal ions activated phosphors Ca0.5La(1−x)(MoO4)2:xEu3+,M+ (M = Li, K and Na) obtained by varying precursor materials.

It is evident from Fig. 8(a–d) that Na+ ion activated Ca0.5RE1−x(MoO4)2:xEu3+ (RE = Y, La) shows enhanced intensity. Overall, in both cases, by fixing the precursors along with varying co-doping of alkali metal ions and also by varying three different precursor materials, Na+ ions play a major role in enhancing the luminescence intensity and are proposed as the best charge compensator. From these findings, it is suggested that these phosphors would be appropriate red phosphor candidates for display applications.

3.6 Judd–Ofelt theory and spectroscopic properties

The characteristics of the luminescence behaviour of Eu3+ in Ca0.5RE1−x(MoO4)2 (RE = Y, La) can be examined by the detailed studies of Judd–Ofelt (J–O)27,28 intensity parameters, ΩJ (J = 2, 4). Ω2 was dependent on the environment and are associated to the structural changes and covalency in the proximity of the Eu3+ ion and are thus considered as a short range effect. Ω4 was associated with the long range effect.29 In general, the intensity parameters would be deduced from the absorption spectra.29 Therefore, Eu3+ has special energy level structure, hence these intensity parameters could be estimated from the emission spectra.15 Based on the following relation between the radiative emission rate and associated with the intensity of the two manifolds 5D0 and 7FJ of the Eu3+ ion can be calculated using the following equation,29
 
image file: c6ra16753e-t1.tif(1)
where I0–J and I0–1 are the integral intensities of 5D07FJ and 5D07F1 attributed to magnetic dipole transition and 0–J and 0–1 are their associated energies, respectively.15 The magnetic dipole radiative emission rate possess a value of 50 s−1.23,30 The radiative emission rates A0–J could be associated with the forced electric dipole transitions and would be expressed as a function of the J–O intensity parameters as,23
 
image file: c6ra16753e-t2.tif(2)
where e is the electric charge, χ is the Lorentz field correction factor represented as a function of the refractive index31 of the host image file: c6ra16753e-t3.tif. The 〈5D0|U(J)|7FJ2 is denoted as square reduced matrix elements and those values do not depend on the chemical environment of the Eu3+ ion.29 Their values are familiar and are given by 〈5D0|U(J)|7F22 = 0.0032 and 〈5D0|U(J)|7F42 = 0.0023.32 Based on eqn (1) and (2), the values of ΩJ were achieved. The estimated Judd–Ofelt parameters could be used to evaluate the total radiative transition probability (AT) and lifetime (τrad).33 The radiative transition probability (AT) was obtained using the following equation:
 
image file: c6ra16753e-t4.tif(3)

The radiative lifetime τrad for an excited state is given as follows:

 
image file: c6ra16753e-t5.tif(4)

The Judd–Ofelt intensity parameters and radiative transition probability for Ca0.5RE1−x(MoO4)2:xEu3+,Na+ (RE = Y, La) phosphors are given in the Table 1. In all cases, Ω2 > Ω4 suggest that forced electric dipole transition has dominance and possesses higher asymmetry and covalency of Eu3+ ions in the present hosts.34 The branching ratio and non-radiative rate are expressed by the following relations23,31

 
image file: c6ra16753e-t6.tif(5)
 
image file: c6ra16753e-t7.tif(6)

Table 1 Judd–Ofelt intensity and radiative parameters, quantum efficiency for the phosphors Ca0.5Y(MoO4)2:Eu3+,Na+ and Ca0.5La(MoO4)2:Eu3+,Na+
Phosphor J–O intensity parameters (×10−20 cm2) Transitions A0–2,4 (s−1) A0–1 (s−1) AT (s−1) β (%) Quantum efficiency η (%)
Ω2 Ω4
Ca0.5Y(MoO4)2:Eu3+,Na+ 9.71 4.59 5D07F1 50 966.00 5.18 76
5D07F2 683.00 70.76
5D07F4 232.35 24.06
Ca0.5La(MoO4)2:Eu3+,Na+ 4.51 2.50 5D07F1 50 498.00 10.03 74
5D07F2 321.00 64.37
5D07F4 127.54 25.60


The emission quantum efficiency34 from the emitting 5D0 level is given by

 
image file: c6ra16753e-t8.tif(7)

The luminescence quantum efficiency (η) values are given in Table 1 and these values are reasonably good for Ca0.5RE1−x(MoO4)2:xEu3+,Na+ (RE = Y, La) phosphors, which suggests that these phosphor candidates are good for the display applications.

3.7 Photometric characterization and decay-time analysis

Fig. 9 illustrates the Commission Internationale de I'Eclairage (CIE) color chromaticity coordinates of the Ca0.5Y1−x(MoO4)2:xEu3+,Na+ and Ca0.5La1−x(MoO4)2:xEu3+,Na+ phosphors. Thus, the CIE color chromaticity coordinates of the Ca0.5Y1−x(MoO4)2:xEu3+,Na+ and Ca0.5La1−x(MoO4)2:xEu3+,Na+ phosphors were (0.673, 0.327) and (0.658, 0.341), respectively.
image file: c6ra16753e-f9.tif
Fig. 9 CIE diagram for the as-synthesized powder phosphors (A) Ca0.5Y(1−x)(MoO4)2:xEu3+,Na+ and (B) Ca0.5La(1−x)(MoO4)2:xEu3+,Na+. Inset shows enlarged view of the CIE diagram.

Furthermore, the CIE chromaticity coordinates of these phosphors were found nearer to the standard red light (0.675, 0.325).11,23,35 Furthermore, to be more familiar about the red emission of the Ca0.5Y1−x(MoO4)2:xEu3+,Na+ and as Ca0.5La1−x(MoO4)2:xEu3+,Na+, the value of color purity was also deduced by the equation,11,23

 
image file: c6ra16753e-t9.tif(8)
where (x, y) is denoted as the CIE chromaticity coordinate of the prepared sample, (xi, yi) is the CIE white illumination, and (xd, yd) is the CIE chromaticity coordinate of the dominant wavelength.11 For Ca0.5Y1−x(MoO4)2:xEu3+,Na+ phosphor (x, y) = (0.673, 0.327) and for Ca0.5La1−x(MoO4)2:xEu3+,Na+ phosphor (x, y) = (0.658, 0.341), (xi, yi) = (0.310, 0.316) and (xd, yd)= (0.675, 0.325).11 Hence, the color purity of the Ca0.5Y1−x(MoO4)2:xEu3+,Na+ and Ca0.5La1−x(MoO4)2:xEu3+,Na+ phosphors are 99.5% and 95.6%, respectively. These results suggest that Ca0.5Y1−x(MoO4)2:xEu3+,Na+ and Ca0.5La1−x(MoO4)2:xEu3+,Na+ phosphors with reasonable CIE chromaticity coordinate along with high color purity values might have remarkable applications in display devices and evidence as an efficient red emitting phosphor.

The representative PL decay curves for the highest luminescence intensity emission for the phosphors Ca0.5Y1−x(MoO4)2:xEu3+,Na+ and Ca0.5La1−x(MoO4)2:xEu3+,Na+ for x = 0.16 M is plotted.

Fig. 10(a) and (b) depict the PL decay curves for the Ca0.5Y1−x(MoO4)2:xEu3+,Na+ and Ca0.5La1−x(MoO4)2:xEu3+,Na+ phosphors. This could be fitted to a single exponential function4,10,26 as

 
image file: c6ra16753e-t10.tif(9)
where I0 is the luminescence intensity at times t = 0 and τ is its corresponding luminescence lifetime. The values of the luminescence decay time, color chromaticity co-ordinates, and photometric parameters are estimated and are provided in Table 2.


image file: c6ra16753e-f10.tif
Fig. 10 Luminescence decay profiles for Na+ ion co-doped (a) Ca0.5Y(1−x)(MoO4)2:xEu3+ and (b) Ca0.5La(1−x)(MoO4)2:xEu3+ powder phosphors.
Table 2 Color chromaticity co-ordinates, photometric properties, luminescence decay time and color purity for the phosphors Ca0.5Y(MoO4)2:Eu3+,Na+ and Ca0.5La(MoO4)2:Eu3+,Na+
Phosphor CCT (K) CRI Color coordinates LER (lm W−1) τ (ms) Color purity (%)
x y
Ca0.5Y(MoO4)2:Eu3+,Na+ 1020 25 0.673 0.327 290 0.475 99.5
Ca0.5La(MoO4)2:Eu3+,Na+ 1050 27 0.658 0.341 305 0.485 95.6


4. Conclusions

Scheelite-structured Ca0.5Y1−x(MoO4)2:xEu3+,M+ (M = Li, K and Na) and Ca0.5La1−x(MoO4)2:xEu3+,M+ (M = Li, K and Na) were successfully synthesized by the hydrothermal method. The XRD patterns imply tetragonal scheelite type crystal structure without discernible impurities and other phases. The FESEM images show bi-pyramid like morphologies. Elemental mapping analysis evidenced the incorporation and uniform distribution of all the elements in the bi-pyramid-like architectures. The compositional analysis by X-ray photoelectron spectroscopy confirmed the presence of Ca, Y, Mo, O, Eu, and Na. PL emission spectra showed a hypersensitive electric dipole transition 5D07F2 at 617 nm for Ca0.5Y1−x(MoO4)2:xEu3+,M+ (M = Li, K and Na) and 615 nm for Ca0.5La1−x(MoO4)2:xEu3+,M+ (M = Li, K and Na) and show characteristic red emission in the visible region. Judd–Ofelt theory is envisaged to estimate intensity parameters, radiative emission rates, branching ratio and quantum efficiency. The effect of alkali cations (Li, K and Na) on Ca0.5RE1−x(MoO4)2:xEu3+ (RE = Y, La) was analysed in detail. From the results, it is evident that the red emission peak intensity of Ca0.5RE1−x(MoO4)2:xEu3+ (RE = Y, La) using Na+ ions as a charge compensator is greater than that of Li+ and K+ ions and Na+ ions has a remarkable charge compensation effect. From the CIE chromaticity diagram, it is suggested that Ca0.5RE1−x(MoO4)2:xEu3+,Na+ (RE = Y, La) phosphor materials are suitable best candidates for display applications.

Acknowledgements

The authors are grateful to the Science and Engineering Research Board – SERB, New Delhi for funding this work under the SERB Project SR/FTP/PS – 135/2011.

References

  1. X. Liu, L. Li, H. M. Noh, J. H. Jeong, K. Jang and D. S. Shin, RSC Adv., 2015, 5, 9441–9454 RSC.
  2. S. Gai, C. Li, P. Yang and J. Lin, Chem. Rev., 2014, 114, 2343–2389 CrossRef CAS PubMed.
  3. A. M. Kaczmarek and R. V. Deun, Chem. Soc. Rev., 2013, 42, 8835–8848 RSC.
  4. V. Mahalingam, J. Thirumalai, R. Krishnan and R. Chandramohan, Electron. Mater. Lett., 2016, 12, 32–47 CrossRef CAS.
  5. A. K. Parchur, R. S. Ningthoujam, S. B. Rai, G. S. Okram, R. A. Singh, M. Tyagi, S. C. Gadkari, R. Tewari and R. K. Vatsa, Dalton Trans., 2011, 40, 7595–7601 RSC.
  6. Luminescent Materials, ed. G. Blasse and B. C. Grabmaier, Springer, Berlin, 1994 Search PubMed.
  7. T. Li, C. Guo, Y. Wu, L. Li and J. H. Jeong, J. Alloys Compd., 2012, 540, 107–112 CrossRef CAS.
  8. S. Yu, Z. Lin, L. Zhang and G. Wang, Cryst. Growth Des., 2007, 7, 2397–2399 CAS.
  9. G. S. R. Raju, E. Pavitra, Y. H. Ko and J. S. Yu, J. Mater. Chem., 2012, 22, 15562–15569 RSC.
  10. V. Mahalingam, J. Thirumalai, R. Krishnan and R. Chandramohan, J. Mater. Sci.: Mater. Electron., 2015, 26, 842–852 CrossRef CAS.
  11. P. Du and J. S. Yu, RSC Adv., 2015, 5, 60121–60127 RSC.
  12. R. Krishnan, J. Thirumalai, I. B. Shameem Banu and R. Chandramohan, J. Mater. Sci.: Mater. Electron., 2013, 24, 4774–4781 CrossRef CAS.
  13. L. Li, J. Zhang, W. Zi, S. Gan, G. Ji, H. Zou and X. Xu, Solid State Sci., 2014, 29, 58–65 CrossRef CAS.
  14. R. Krishnan, J. Thirumalai, V. Mahalingam, S. Mantha and M. Lavanya, Mater. Chem. Phys., 2015, 162, 41–49 CrossRef CAS.
  15. R. Saraf, C. Shivakumara, N. Dhananjaya, S. Behera and H. Nagabhushana, J. Mater. Sci., 2015, 50, 287–298 CrossRef CAS.
  16. R. Krishnan, J. Thirumalai, S. Thomas and M. Gowri, J. Alloys Compd., 2014, 604, 20–30 CrossRef CAS.
  17. S. Dutta, S. Som and S. K. Sharma, Dalton Trans., 2013, 42, 9654–9661 RSC.
  18. R. Krishnan and J. Thirumalai, New J. Chem., 2014, 38, 3480–3491 RSC.
  19. B. P. Singh, Maheshwary, P. V. Ramakrishna, S. Singh, V. K. Sonu, S. Singh, P. Singh, A. Bahadur, R. A. Singh and S. B. Rai, RSC Adv., 2015, 5, 55977–55985 RSC.
  20. Y. Yang, X. Li, W. Feng, W. Yang, W. Li and C. Tao, J. Alloys Compd., 2011, 509, 845–848 CrossRef CAS.
  21. H. M. Luitel, R. Chand and T. Watari, Displays, 2016, 42, 1–8 CrossRef CAS.
  22. Hand-book of X-ray Photoelectron Spectroscopy, ed. J. Chastain, Perkin-Elmer Corporation, Eden Prairie, 1992 Search PubMed.
  23. S. Som, S. Das, S. Dutta, H. G. Visser, M. K. Pandey, P. Kumar, R. K. Dubey and S. K. Sharma, RSC Adv., 2015, 5, 70887–70898 RSC.
  24. J. Liu, B. Xu, C. Song, H. Luo, X. Zou, L. Han and X. Yu, CrystEngComm, 2012, 14, 2936–2943 RSC.
  25. L. Hou, S. Cui, Z. Fu, Z. Wu, X. Fu and J. H. Jeong, Dalton Trans., 2014, 43, 5382–5392 RSC.
  26. V. Mahalingam, J. Thirumalai, R. Krishnan and S. Mantha, Spectrochim. Acta, Part A, 2016, 152, 172–180 CrossRef CAS PubMed.
  27. B. R. Judd, Phys. Rev., 1962, 127, 750–761 CrossRef CAS.
  28. G. S. Ofelt, J. Chem. Phys., 1962, 37, 511–520 CrossRef CAS.
  29. M. P. Hehlen, M. G. Brik and K. W. Krämer, J. Lumin., 2013, 136, 221–239 CrossRef CAS.
  30. C. Shivakumara, R. Saraf, S. Behera, N. Dhananjaya and H. Nagabhushana, Spectrochim. Acta, Part A, 2015, 151, 141–148 CrossRef CAS PubMed.
  31. V. Mahalingam and J. Thirumalai, J. Mater. Sci.: Mater. Electron., 2016, 27, 8884–8890 CrossRef CAS.
  32. W. T. Carnall, H. Crosswhite and H. M. Crosswhite, Energy level structure and transition probabilities in the spectra of trivalent lanthanides in lanthanum fluoride, Argonne National Laboratory Report, 1978 Search PubMed.
  33. S. Dutta, S. Som and S. K. Sharma, RSC Adv., 2015, 5, 7380–7387 RSC.
  34. S. K. Gupta, M. Sahu, P. S. Ghosh, D. Tyagi, M. K. Saxena and R. M. Kadam, Dalton Trans., 2015, 44, 18957–18969 RSC.
  35. C. Bouzidi, M. Ferhi, H. Elhouichet and M. Ferid, J. Lumin., 2015, 161, 448–455 CrossRef CAS.

This journal is © The Royal Society of Chemistry 2016