Sugarcane molasses as a pseudocapacitive material for supercapacitors

A. Sanchez-Sanchez*a, Alicia Martinez de Yusoa, Flavia Lega Braghirolia, M. Teresa Izquierdob, Edelio Danguillecourt Alvarezd, Eduardo Pérez-Cappec, Yodalgis Mosquedac, Vanessa Fierro*a and Alain Celzarda
aInstitut Jean Lamour, UMR CNRS-Université de Lorraine no. 7198, ENSTIB, 27 Rue Philippe Séguin, 88026 Epinal Cedex, CS 60036, France. E-mail: angela.sanchez-sanchez@univ-lorraine.fr; Vanessa.Fierro@univ-lorraine.fr; Tel: +33 329 296177
bInstituto de Carboquimica, ICB-CSIC, Miguel Luesma Castan, 4, 50018 Zaragoza, Spain
cInstitute of Materials Science and Technology (IMRE), Havana University, Zapata y G, Vedado, Havana 10400, Cuba
dInstituto Superior Minero Metalúrgico de Moa (ISMM), Departamento de Metalurgia y Quimica, Holguín 83300, Cuba

Received 23rd June 2016 , Accepted 10th September 2016

First published on 12th September 2016


Abstract

Oxygen-rich carbons were obtained from sugarcane molasses by two methods: direct carbonisation on one hand, and hydrothermal carbonisation and subsequent pyrolysis on the other hand. As no activation treatments were applied, the porous texture was poorly developed and mainly composed of ultramicropores with restricted access to electrolyte ions. Despite this, the directly carbonised molasses exhibited specific capacitances up to 153 F g−1 at 0.5 mV s−1 in 1 M H2SO4 electrolyte when tested as electrodes in a three-electrode system. Given the low specific surface areas of the carbons, the capacitance values were mainly assigned to their pseudocapacitance contributions. The latter were more adequately estimated by considering the NLDFT surface area (SNLDFT) than the BET area (ABET) due to the narrow porosity of the materials. Maximum values of pseudocapacitance contribution of 35.2% were attained for the carbon with a SNLDFT of 178 m2 g−1, which were explained by the high concentrations of surface oxygen groups, such as quinones and carbonyls.

Introduction

Supercapacitors (SCs) are energy storage systems exhibiting excellent power densities, long cycling life, reliability and high efficiency. Owing to their properties, they are used in devices requiring high power and short current supplies.1 Nevertheless, they exhibit to date moderate energy densities compared to batteries, and considerable research has been carried out for producing high energy and high power density supercapacitors that might substitute batteries.2

The capacitance of SCs, i.e., the electric charge stored per unit of potential difference, depends on several factors related to the electrode material (e.g. active surface area, geometry and size of the pores and occurrence of faradaic reactions) and to the electrolyte (e.g. type and concentration of electrolyte).3 According to their main energy storage mechanism, SCs can be classified as: (i) electric double-layer capacitors (EDLCs), in which the energy is stored through the charge separation at the electrode/electrolyte interface, designated as EDLC mechanism; (ii) pseudocapacitors, wherein the energy is stored through faradaic reactions taking place at the electrode surface, designated as pseudocapacitance.

Carbon materials can store energy through both mechanisms, and different types of carbon, such as activated carbons, carbon nanotubes, mesoporous carbons, carbon nanofibers, graphene, etc., have been intensively investigated to be used as electrodes for supercapacitors.4 Using carbon materials containing surface functionalities (O, N, P, B or S functional groups) has been an attractive strategy to increase the energy density of supercapacitors by promoting the pseudocapacitive storage mechanism.5–9 Moreover, the presence of functional groups in the material surface both improves electrode wettability and modifies the electronic and acid–base properties of the surface, thereby affecting the capacitance and, hence, the energy density.8 For instance, oxygen-doped carbons show enhanced specific capacitances with respect to their non-doped counterparts in aqueous electrolytes.10 Depending on the acidic or basic character of the electrolyte, different oxygen functionalities are involved in pseudocapacitance, namely quinones, carbonyls, phenols or carboxylic acids.11 The functionalisation of carbon surface with oxygen groups is usually performed through wet, dry, plasma or electrochemical oxidation post-treatments.12 However, these treatments are time-consuming procedures and a specific control of the type of the generated oxygen functionalities is hardly achievable.

A possible alternative to surface functionalisation is based on the use of oxygen-containing precursors such as biomass-derived materials. In this sense, hydrothermal carbonisation (HTC) has received growing interest because it is an easy method, applying low temperature and environment-friendly conditions, to obtain oxygen-rich hydrochars from biomass precursors.13,14 But hydrochars exhibit generally not enough open porosity and carbonisation at high temperatures only produces a slight increase of their textural properties. Therefore, chemical activation is often used to develop their porosity, thereby increasing the electric double-layer capacitance.6,15–17 Many activated carbons obtained by KOH chemical activation of biomass precursors have indeed shown excellent performances as electrode materials in supercapacitors with different electrolytes. As examples, waste dragon fruit skin, Momordica grosvenori skin and Firmiana catkins exhibited specific capacitances exceeding 230 F g−1 at 0.5 A g−1 in a three-electrode cell with 2 M KOH electrolyte,18 activated carbons obtained from rice brans yielded specific capacitances of 265 F g−1 at 10 A g−1 in a two-electrode cell with 6 M KOH electrolyte,19 and activated carbons obtained by HTC of cellulose, potato starch and eucalyptus wood sawdust allowed obtaining specific capacitances up to 236 F g−1 at 1 mV s−1 in a two-electrode cell with tetraethyl ammonium tetrafluoroborate (TEABF4)/acetonitrile (AN) electrolyte.13 Even though higher specific capacitances are obtained after activation processes, it should be recalled that activation processes are time consuming and may generate toxic wastes.20,21

Herein, we report the synthesis of carbon materials produced from sugarcane molasses, either by direct carbonisation on the one hand, or by HTC followed by pyrolysis on the other hand. A carbon material obtained by HTC of commercial sugar was also reported for comparison. The as-obtained carbons were tested as electrodes for supercapacitors in 1 M H2SO4 electrolyte, without any activation or functionalisation post-treatment. A thorough study of both porosity and surface chemistry of the materials was carried out, and some correlation with their electrochemical performances was looked for. Surprisingly, the molasses-derived carbons possessing the lowest surface areas but the highest oxygen concentrations exhibited the highest specific capacitances. The pseudocapacitance contribution to the total capacitance was therefore estimated and a correlation between the surface chemistry and the specific capacitance of the materials was evidenced.

Experimental

A. Materials

Sugarcane molasses, i.e., the industrial viscous by-product of the refining of sugarcane into sugar, was supplied by the company “Cristino Naranjo” (Cacocum, Cuba). PTFE binder and carbon black powder used to fabricate the electrodes were both purchased from Sigma-Aldrich. The glass fibre separator was purchased from Pall Life Sciences. All the products were used as received.

B. Material synthesis

Hydrothermally-treated samples were prepared from molasses and sucrose solutions. In this work, different amounts of molasses (2.57 g) or sucrose (2 g) were used in order to have the same carbon content, and were dissolved in 16 g of water. The resultant solutions were then submitted to hydrothermal treatment in a Teflon-lined autoclave (50 cm3) under autogenous pressure (180 °C, 24 h). The as-obtained product was filtered, washed several times with distilled water and dried in a vacuum oven (80 °C, 12 h), and was called MH or SH depending on the carbon precursor, molasses or sucrose, respectively. Finally, MH and SH were carbonised under nitrogen flow (80 mL min−1) up to the final temperature (750 or 900 °C, 3 h; 1 °C min−1), and subsequently cooled down to room temperature. The resultant carbons were named MH-T and SH-T, where T indicates the carbonisation temperature.

Molasses was also directly carbonised under nitrogen flow in the same conditions as for the hydrothermally treated samples (750 or 900 °C, 3 h; 1 °C min−1). The obtained carbons were designated as M-T, T being again the final carbonisation temperature (750 or 900 °C).

C. Physicochemical and electrochemical characterisation

Porous texture characterisation of the samples was performed by N2 and Kr adsorption at −196 °C and by CO2 adsorption at 0 °C using an ASAP 2020 (Micromeritics) automatic equipment. Carbons and hydrochars were degassed for 48 h prior to any gas adsorption at 250 °C and at 60 °C, respectively. The surface area was calculated through two methods: (i) the Brunauer–Emmett–Teller (BET) model applied to the nitrogen adsorption data in the appropriate range of relative pressures, leading to ABET, and (ii) the Non-Local Density Functional Theory (NLDFT) model applied to the adsorption data obtained from both nitrogen and carbon dioxide isotherms, leading to SNLDFT. The micropore volume was also determined by two methods: (i) from the Dubinin–Radushkevich (DR) equation, applied to the adsorption branches of nitrogen and carbon dioxide isotherms, leading to VDR-N2 and VDR-CO2, respectively, and (ii) from the NLDFT model, applied to the adsorption data obtained from nitrogen and carbon dioxide isotherms, leading to Vμ-NLDFT.22 The total pore volume was calculated from the amount of nitrogen adsorbed at the relative pressure of 0.97, V0.97,N2, and also from the pore size distributions (PSDs) calculated by applying the NLDFT model, VT-NLDFT. The mesopore volume (Vmeso) was determined by subtracting Vμ-NLDFT from VT-NLDFT.

Thermogravimetric (TG) analyses were carried out in a STA 449F3 Jupiter (NETZSCH) microbalance by heating the samples (∼20 mg) under argon flow up to the target temperature (1000 °C, 10 °C min−1). Molasses moisture content was gravimetrically determined through the AOAC official method 925.04, by submitting the sample (∼1 g) to a thermal treatment (105 °C, 24 h) and subsequent cooling down to room temperature. Mineral ash content was gravimetrically evaluated using the AOAC official method 492.05, after calcination in air (550 °C, 24 h) and cooling down to room temperature of the molasses sample (∼1 g).

Temperature-programmed desorption (TPD) experiments were carried out in the aforementioned microbalance by submitting the sample (0.3 g) to a thermal treatment (1100 °C, 10 °C min−1) in argon flow (30 mL min−1). The released gases, CO and CO2, were analysed in continuous mode with a QMS 403D Aëolos (NETZSCH) mass spectrometer. The calibrations for CO and CO2 were carried out by using the corresponding standard gases diluted in argon.

Scanning electron microscopy (SEM) and energy-dispersive X-ray spectroscopy (EDS) were performed with a FEI-NOVA NANOSEM 230 microscope coupled with an EDAX-Ametek detector. X-ray diffraction (XRD) patterns were obtained with a Bruker D8 Advance diffractometer in the following conditions: Cu-Kα radiation; scanning range 2θ = 2–80°; step width = 0.02°.

Bulk chemical composition of the materials (carbon, hydrogen, nitrogen and sulphur) was determined with a ThermoFlash 1112 apparatus. Surface chemical composition was analysed through X-ray photoelectron spectroscopy (XPS) by using an ESCAPlus OMICRON system equipped with a hemispherical electron energy analyser. The spectrometer was operated at 10 kV and 15 mA, using a non-monochromatised Mg-Kα X-ray source ( = 1253.6 eV) and under vacuum (<5 × 10⁻⁹ Torr). Analyser pass energy of 50 eV was used for survey scans and 20 eV for detailed scans. The C1s peak at 284.5 eV was used for binding energy correction. A survey scan (1 sweep/200 ms dwell) was acquired between 1100 and 0 eV. Current region sweeps for N1s, O1s and C1s were obtained. CASA data processing software allowed smoothing, Shirley type background subtraction, peak fitting and quantification. Atomic percentages of each element were calculated from intensity ratios using Scofield sensitivity factors.23

Molasses- and sucrose-derived electrodes were prepared by spreading a paste (∼3 mg) containing the carbon material, polytetrafluoroethylene (PTFE) binder and carbon black in the weight percent ratio of 85[thin space (1/6-em)]:[thin space (1/6-em)]10[thin space (1/6-em)]:[thin space (1/6-em)]5 onto a graphite foil. The resultant electrodes were pressed at 5 MPa and impregnated in 1 M H2SO4 electrolyte, or with 1 M NaNO3 for cyclic voltammetry measurements, during 48 hours.

Before impregnation, the electrical conductivity of these carbon pastes was measured by the four-probe method with a Keithley 237 source-measure unit. Disc-shaped carbon electrodes were used, having a diameter of 0.6 cm and a thickness determined as the average value (∼0.3 mm) of ten measurements using a Keyence LK-G32 non-contact profilometer. Electric contacts were ensured by copper wires glued with silver paint to the ends of the samples. The electric field was always maintained constant at 0.2 V cm−1, for which the current–voltage characteristics always obeyed Ohm's law at room temperature. The electrical conductivity, σ (S cm−1), was then calculated by application of eqn (1):

 
image file: c6ra16314a-t1.tif(1)
where R (Ω) is the resistance obtained by dividing the voltage drop V (volts) by the intensity I (A) throughout the sample, L0 (cm) is the average thickness of the sample and S (cm2) is the disc area.

Electrochemical performances of the carbon materials were studied by cyclic voltammetry (CV) and galvanostatic charge–discharge (GCD) techniques. Both kinds of measurements were carried out with a Biologic VMP3 electrochemical workstation in the potential window 0–0.7 V.

Cyclic voltammetry (CV) tests were performed at different scan rates ranging from 0.5 to 100 mV s−1 in a three-electrode cell system, using a platinum gauze as the counter electrode and a saturated calomel electrode (SCE) as reference. The specific gravimetric capacitance (C, F g−1) was calculated from the CV curves according to eqn (2):

 
image file: c6ra16314a-t2.tif(2)
where I (A) is the constant current, s (V s−1) is the scan rate, ΔV (V) is the potential window and m (g) is the mass of active material.

GCD tests were carried out at current densities ranging from 0.1 to 5 A g−1 in a two-electrode cell system. Specific capacitance (C, F g−1), energy density (E, W h kg−1) and power density (P, W kg−1) were calculated from the GCD curves by applying eqn (3)–(5), respectively:

 
C = (2I)/[m(dV/dt)] (3)
 
E = C/8(ΔVIR)2 (4)
 
P = Et (5)
where I (A) represents the discharge current, (dV/dt) (V s−1) the slope of the discharge curve, m (g) the mass of active material, ΔV (V) the potential difference within the discharge time Δt (s) and IR the drop of voltage in the discharge process.

Results and discussion

Fig. 1a shows the N2 adsorption–desorption isotherms of the studied materials. Fig. 1b displays the PSDs calculated after applying the NLDFT model to both the N2 and the CO2 isotherms, and the inset shows the CO2 adsorption isotherms of the materials. Sucrose-derived carbon, SH-900, exhibited a type-I isotherm according to the IUPAC classification, typical of microporous materials. Its porosity was mainly composed of narrow micropores, of diameter ∼0.46 nm, and of a low amount of wider micropores, of diameter centred on 1.55 nm. Molasses-derived carbons presented type-IV isotherms, characteristic of mesoporous materials. The shape of their hysteresis cycle was not the same from one material to another: M-900 carbon, obtained from direct carbonisation, exhibited a very narrow hysteresis loop in the 0.5–1.0 range of relative pressure; MH-750 and MH-900 carbons, obtained through HTC followed by pyrolysis, displayed well-defined hysteresis loops in the 0.3–1.0 range of relative pressure with a jump in the desorption branch at the relative pressure of 0.5. These observations clearly indicate that the mesopore volume and the PSD in the mesopore range of the molasses-derived samples depend on the synthesis method. Direct carbonisation produced less porous carbons, within the micro- and mesoporosity ranges, than HTC followed by carbonisation.
image file: c6ra16314a-f1.tif
Fig. 1 (a) N2 adsorption–desorption isotherms at −196 °C; (b) corresponding pore size distributions and CO2 adsorption isotherms at 0 °C (inset) of the carbon materials.

Table 1 presents the textural parameters obtained from N2, Kr and CO2 adsorption isotherms. Although it is generally accepted that the DR method overestimates micropore volumes,24 VDR-N2 and VDR-CO2 were reported here for comparison with previously reported data. VDR-CO2 was higher than both VDR-N2 and V0.97,N2 for all the samples, suggesting that the latter presented porosities mainly composed of narrow pores, not accessible to N2 at −196 °C.

Table 1 Textural parameters calculated from N2 and Kr adsorption at −196 °C and from CO2 adsorption at 0 °C
Sample ABET (m2 g−1) SNLDFT (m2 g−1) V0.97,N2 (cm3 g−1) Vμ-DR,N2 (cm3 g−1) Vμ-DR,CO2 (cm3 g−1) VT-NLDFT (cm3 g−1) Vμ-NLDFT (cm3 g−1) Vmeso (cm3 g−1)
a SBET determined by Kr adsorption at −196 °C.
M-750 8 178 0.02 0.01 0.16 0.04 0.04 0.00 (0%)
M-900 102 302 0.09 0.04 0.17 0.09 0.07 0.02 (22%)
MH 0.4a
MH-750 232 523 0.10 0.12 0.20 0.15 0.12 0.03 (20%)
MH-900 214 429 0.11 0.07 0.21 0.15 0.10 0.05 (33%)
SH 1.8a
SH-900 562 836 0.22 0.22 0.26 0.23 0.23 0.00 (0%)


Thus, N2 and the CO2 adsorption were both absolutely necessary to correctly evaluate the textural properties of these carbons.

We therefore applied the NLDFT model to the N2 and the CO2 adsorption data to obtain the micropore, Vμ-NLDFT, and the total pore volume, VT-NLDFT. Both Vμ-NLDFT and VT-NLDFT values were indeed higher when calculated from CO2 isotherms than from N2 isotherms, thereby confirming the need of using both gases to characterise adequately these samples. The ABET values showed the same trend as those of SNLDFT but, as expected, the former were lower than the latter because the BET method underestimates the surface area when materials are essentially ultramicroporous.24

Molasses and sugar hydrochars, MH and SH, had very low ABET determined by krypton adsorption at −196 °C, ∼0.4 and ∼2 m2 g−1, respectively, which can be attributed to the external surface area of the materials. Porosity development took place during subsequent carbonisation, due to the evolution of volatiles, and SNLDFT values of 429 and 836 m2 g−1 (ABET of 214 and 562 m2 g−1) were attained for MH-900 and SH-900, respectively. As seen in Table 1, higher surface areas were obtained when a preliminary HTC step was used in the preparation of the samples. This fact could be due to the partial dissolution of inorganic impurities in hot water when working in hydrothermal conditions. The pyrolysis temperature proved to have a significant effect on the molasses-derived carbons obtained either by HTC and subsequent carbonisation or by direct carbonisation. In the case of HTC + pyrolysis, SNLDFT decreased (from 523 to 429 m2 g−1) when increasing the carbonisation temperature from 750 to 900 °C, which is mainly due to pore widening without micropore generation. In the case of direct carbonisation of molasses, SNLDFT of 178 m2 g−1 at 750 °C and of 302 m2 g−1 at 900 °C were measured, due to micropore generation.

According to the supplier, the raw molasses contained 30.3 wt% of sucrose, 18.9 wt% of reducing sugars and 18.9 wt% of other carbohydrates, in good agreement with the organic matter fraction (68.2 wt%) determined in this study. The high ash content (∼9.6 wt%) is due to the presence of inorganic salts and metals, mainly coming from the chemical fertilisers used on farmlands. These inorganic compounds were retained in some extent in the material after carbonisation, as corroborated by the XRD profile and the SEM-EDS analysis of M-750 shown in Fig. 2a and c. The XRD profile (Fig. 2a) evidenced the presence of KCl as the main impurity, as well as the SEM-EDS results, in which potassium was found at a concentration of 2.5 wt% (62.5 wt% lower than in the raw material). The calcium content was ∼1.3 wt%, and the remaining elements were found at concentrations <1 wt%.


image file: c6ra16314a-f2.tif
Fig. 2 XRD patterns of M-750 samples: (a) before, and (b) after having being washed with water; (c) and (d) corresponding SEM images and EDS results before and after M-750 was washed with water, respectively.

In order to determine the solubility of the inorganic impurities, M-750 carbon was washed several times with distilled water and subsequently dried under vacuum (80 °C, 12 h). The corresponding XRD profile and SEM-EDS analysis displayed in Fig. 2b and d, respectively, revealed that K, Na and Fe were removed, indicating that they were part of the soluble compounds. The presence of Ca (1.3 wt%) and Mg (0.6 wt%) indicates that they were in the form of insoluble compounds. No significant changes in the porosity of the material were observed after the washing step.

The TG/DTG curves of the raw molasses are displayed in Fig. 3. The TG curve of the raw molasses presented four main weight loss steps associated to endothermic peaks in the DTG curve (at 118, 207, 690 and ∼900 °C). The first mass loss occurring between 30 and 160 °C (∼22%) can be assigned to moisture release. The second stage between 160 and 283 °C (33.2%) may be associated to the pyrolysis of both sugar and non-sugar organic constituents and breakdown of polysaccharide molecules, water and CO molecules being the main resultant gaseous by-products.25 The breakdown of polysaccharide molecules is probably produced until ∼600 °C (18.1 wt% mass loss), as indicated by the continuous weight loss observed in the TG curve, in agreement with a previous study on sugarcane molasses.26 In addition, this latter work indicated that the weight loss was negligible from 500 to 700 °C and that no weight loss was observed up to 900 °C.26 In contrast, our TG/DTG curves presented two steps between ∼600 and 758 °C and above 758 °C with no negligible weight loss values of 3.6 and 7.4 wt%, respectively. Such unexpected stages appearing above 600 °C will be explained in detail hereinafter.


image file: c6ra16314a-f3.tif
Fig. 3 TG and DTG curves of the raw molasses in inert atmosphere.

The bulk chemical composition of the studied materials, determined by elemental analysis and TPD, as well as the total yields of synthesis and the electrical conductivities are gathered in Table 2. Bulk oxygen concentration was only estimated from TPD experiments, since the high ash content of the samples present in molasses led to erroneous results by elemental analysis. Nevertheless, the as-determined oxygen concentration was only estimation, because nitrogen and sulphur oxides originating from the decomposition of N and S moieties present in the samples could not be determined by TPD. The composition of commercial sucrose is 42 wt% C, 6.5 wt% H and 51.5 wt% O. After HTC, the carbon content increased from 42 to 65.6 wt% (56% increase) and the hydrogen content decreased accordingly from 6.5 to 4.4 wt% (58.4% decrease), thereby indicating the increase of the aromatic character of the material. Subsequent carbonisation at 900 °C further increased the carbon content from 65.6 to 93 wt% (i.e., +41.7%) and decreased the hydrogen concentration from 4.4 to 0.1 wt% (i.e., −98.9%). When comparing the carbon enrichment achieved by both processes, the effectiveness of HTC, as a low-temperature pre-treatment followed by carbonisation, for biomass-based materials is obvious.

Table 2 Data of bulk chemical composition from elemental analysis and TPD experiments, and total yield (η) of the materials under study. Electrical conductivity (σ) of a paste based on the same carbon materials
Sample Elemental analysis (wt%) TPD (mmol g−1) η (%) σ (S cm−1)
C H N S CO CO2
M-750 60.0 1.4 0.9 1.9 2.68 3.30 0.015
M-900 61.7 1.1 0.9 2.1 2.83 3.06 2.006
MH 64.8 5.1 1.2 0.3 2.54 5.12 35.6
MH-750 84.9 1.6 1.1 0.4 1.96 3.35 19.3 0.054
MH-900 86.9 0.8 1.0 0.5 1.89 2.48 17.9 0.356
SH 65.6 4.4 0.0 0.0 1.86 6.51 41.1
SH-900 93.0 0.1 0.1 0.0 1.37 2.98 21.1 13.800


Direct carbonisation of molasses is indeed a violent process producing sample foaming and a partial loss of material. For this reason, carbon yields for M-750 and M-900 were not reported here. As expected, increasing the carbonisation temperature reduced the total yield, regardless of the synthesis method used.

As for the chemical composition, MH-750 and MH-900 exhibited lower oxygen and sulphur contents, as well as lower ash content (∼10 wt%) in their bulk than the samples directly carbonised. This feature may be due to the HTC conditions, aqueous medium and autogenous pressure, favouring the removal of soluble by-products and inorganic compounds from molasses. The carbon content of M-750 and M-900 was very low, mainly due to the high ash content of these samples (∼23 wt%). The bulk oxygen content of the molasses-derived samples was very high, especially for M-750 and M-900, as deduced from the CO and CO2 concentrations measured in the TPD experiments. On the contrary, sugar-derived carbon, SH-900, displayed the lowest CO and CO2 concentrations (∼3 wt%), in agreement with the lower oxygen concentration of sucrose.

It is generally assumed that oxygen functional groups of carbons desorb into CO and/or CO2 gases during TPD experiments. As shown in Table 2, the CO2 concentration is slightly higher than the CO concentration for all the samples. On one hand, oxygen functionalities possessing a basic character such as quinones, semiquinones, hydroquinones, ethers, phenols, carbonyls and chromenes decompose into CO at different temperatures. On the other hand, acidic oxygen functionalities such as carboxylic acids, lactones and lactols desorb as CO2. Carboxylic anhydrides decompose in equal amounts of CO and CO2.27 From the TPD results it appears that the concentration of acidic groups in the bulk of the carbons is higher than that of basic groups. MH-750 presented the highest concentration of acidic groups while M-900 exhibited the highest content of basic groups. Molasses samples presented ∼1 wt% N, slightly higher in MH-750 and MH-900 than in M-750 and M-900, respectively. This supports the fact that HTC favours nitrogen retention in the materials bulk. It is remarkable that the bulk sulphur content in the molasses-derived samples carbonised at 900 °C was higher than in those carbonised at 750 °C, independently of the synthesis method used. This fact was also observed at the surface of the respective samples, as displayed in Table S-1 (ESI section).

XPS data also evidenced the presence of several ions and metals in the material surface, namely K, Ca, Na, Cl, Cu, Zn, Mg and Si. Such inorganics were mainly found in M-750 and M-900 carbons, confirming that the HTC process induced the leaching of some inorganics from molasses. All the molasses-derived carbons also contained Ca in the form of CaO and CaSO4,28,29 as shown in Table S-1 and in the XPS profiles of Fig. S-1 (ESI section). The presence of these insoluble calcium salts supports XRD and SEM-EDS results previously discussed in which calcium remaining after washing molasses-based carbons was evidenced.

The S2p high-resolution spectra and the corresponding data of binding energy and relative area contributions to the S2p peak for the studied carbons are displayed in Table S-2 and Fig. S-3 (ESI section), respectively.

Deconvolution of the S2p high-resolution spectra gave rise to two peaks assigned to oxidised sulphur (SO42−) and to sulphide (S2−), respectively, as displayed in Table S-2. The sulphate concentration was higher in the directly carbonised samples than in those obtained through HTC + pyrolysis. When the carbonisation temperature increased from 750 to 900 °C, the sulphate content increased along with the decrease of sulphide content (released from the carbon above 500 °C).30 Moreover, the samples carbonised at 900 °C presented higher oxygen and lower carbon contents, which is quite unusual taking into account that increasingly high carbonisation temperatures are usually related to higher graphitisation degrees and, consequently, to higher carbon/heteroatom ratios.31 This finding can, however, be explained by the oxidising character of sulphates at high temperature, according to the following reactions:32–34

 
CaSO4(s) + 2C(s) → CaS(s) + 2CO2(g) (6)
 
CaS(s) + 3CaSO4(s) → CaO(s) + 2SO2(g) (7)
 
3CaS(s) + CaSO4(s) → 4CaO(s) + 2S2(g) (8)

Typically, reaction (6) takes place between 750 and 1080 °C whereas reactions (7) and (8) occur in the same extent between 900 and 1000 °C; the generated SO2 and S2 react with carbon and give rise to sulphur bound to carbon.

These transformations may explain some of the textural and chemical events observed above 750 °C: (i) the better porous texture development of the samples carbonised at 900 °C with respect to those carbonised at 750 °C, especially in the directly carbonised molasses, due to the activating effect of CO2. It is worth recalling that, in molasses-derived samples obtained through HTC, a widening effect of pre-existing micropores was observed, producing a slight decrease of SBET; (ii) the high oxygen and low carbon contents of the samples carbonised at 900 °C, owing to the oxidation of the carbon matrix by sulphates; the highly oxidised areas of the carbon matrices might finally produce CO2, contributing to the porous texture development and to the removal of carbon atoms from the matrix; (iii) the fixation of sulphur and other elements, such as Ca or Mg, in the samples carbonised at 900 °C: the concentration of these elements increased because of the change in the carbon/heteroelements ratio; (iv) the weight loss occurring above 600 °C observed in TG/DTG curves, assigned to the loss of gaseous by-products generated as a consequence of the chemical transformations.

Fig. S-3–S-5 display the C1s, N1s and O1s high-resolution spectra of the studied materials, respectively, and Table 3 collects the corresponding quantification data.35–37 No nitrogen was detected at the surface of M-750, M-900 and SH-900. Nitrogen of sugarcane molasses was transformed into pyridinic and amino groups during HTC; after subsequent carbonisation, the latter were mainly converted into pyridinic, pyrrolic and quaternary nitrogen, and into nitrogen oxides in a minor extent. Regarding the O1s high-resolution spectra, it is noteworthy that the relative area of OIII peak is very high in the samples carbonised at 900 °C and in those obtained through HTC + pyrolysis. This finding suggests the presence of highly oxidised functional groups in the carbons (carboxylic acids) and supports the oxidation of the carbon matrix by sulphates above 750 °C. Taking into account the surface oxygen content and the relative areas of each peak, M-750 exhibited the highest concentration of quinones and carbonyls (OI); M-900 possessed the highest amount of the rest of oxygen functionalities (OII and OIII) and a surface concentration of quinones and carbonyls slightly lower than that of M-750. Among the samples obtained through HTC, MH-750 presented the highest concentrations of quinone-type and carbonyl groups (OI) and of the oxygen functionalities assigned to OII peak (ethers, esters, phenols and anhydrides).35–37

Table 3 Contributions to the C1s, N1s and O1s peaks. BE and A stand for binding energy and relative peak area, respectively
Sample Contributions to C1s peak BE (eV) A (%) Contributions to N1s peak BE (eV) A (%) Contributions to O1s peak BE (eV) A (%)
CI CII CIII CIV Shake-up satellite π–π* Pyridinic (N-6) Amino groups Pyrrolic (N-5) Quaternary (N-Q) Oxidized (N-X) OI OII OIII
M-750 284.4 (72.6) 285.6 (21.2) 287.8 (2.8) 289.5 (3.4) 531.2 (34.3) 532.1 (64.6) 534.0 (1.1)
M-900 284.4 (69.4) 285.7 (24.8) 287.5 (2.9) 289.9 (2.9) 531.3 (28.0) 532.4 (70.6) 534.0 (1.4)
MH 284.4 (72.3) 285.7 (22.2) 287.7 (3.7) 289.1 (1.8) 398.1 (40.1) 399.2 (59.9) 531.3 (44.3) 532.6 (53.2) 533.8 (2.5)
MH-750 284.5 (71.1) 285.7 (20.5) 287.6 (5.1) 289.3 (3.3) 398.2 (30.9) 400.3 (45.1) 401.2 (21.8) 402.7 (2.2) 531.5 (39.9) 533.0 (50.4) 534.6 (9.7)
MH-900 284.5 (67.9) 285.5 (27.2) 287.7 (3.6) 289.2 (1.3) 398.3 (16.3) 400.4 (52.5) 401.4 (24.5) 402.5 (6.7) 531.5 (25.2) 532.8 (65.5) 534.8 (9.3)
SH 284.4 (68.4) 285.7 (23.6) 287.7 (6.8) 289.1 (0.5) 290.5 (0.7) 531.6 (42.1) 532.8 (56.8) 534.5 (1.1)
SH-900 284.5 (67.1) 285.6 (25.4) 287.7 (4.8) 289.2 (0.6) 290.4 (2.1) 532.0 (49.2) 533.0 (47.8) 534.5 (3.0)


The morphology of carbon particles was investigated by SEM. Fig. S-6 displays SEM images of carbons derived from molasses and sucrose hydrochars as well as from directly carbonised molasses. SEM photograph of Fig. S-6a shows that MH-900 was composed of heterogeneous carbon particles exhibiting uneven shapes with an average size ∼4 μm. Particle heterogeneity may be due to the complex chemical composition and to the high ash content of the molasses used as precursor. SEM image of Fig. S-6b shows that SH-900 comprised interconnected and heterogeneous carbon spheres with an average diameter of ∼1–2 μm, whereas some bigger spheres of diameter ∼5 μm were also observed. It has indeed been reported that the kinetics of sucrose reactions under HTC conditions are very high, so that a high number of seeds are formed and smaller spheres are finally obtained.38 SEM image of M-900 (Fig. S-6c) illustrates that directly carbonized molasses are composed of heterogeneous particles as for the carbons obtained from molasses hydrochars, but their sizes ranged from a few microns to more than 200 μm.

The electrical conductivities of the molasses-derived carbons were quite low compared to that of SH-900, obtained from sucrose, probably due to the much lower ash and oxygen contents of the latter. The materials carbonised at 750 °C, M-750 and MH-750, were the least conductive materials according to their electrical conductivity values of 0.035 ± 0.015 S cm−1. Increasing the carbonisation temperature from 750 to 900 °C produced an increase of electrical conductivity by 7 times for the molasses samples derived from HTC, and by 100 times for the directly carbonised samples. Differences of electrical conductivity among the samples can be explained by three main factors: (i) surface chemistry of the materials, in particular the different concentration and types of oxygen and sulphur groups;39 (ii) order at atomic level arising from the increase of carbonisation temperatures;40 (iii) size of the particles: smaller sizes promoting intra-particle resistances, thus decreasing the electrical conductivity of the material. After removal of KCl, which is a dielectric salt, the conductivity of M-750 for example increased from 0.015 to 0.077 S cm−1.

The electrochemical behaviour of the carbons was studied by cyclic voltammetry in 1 M H2SO4 electrolyte. Fig. 4a shows the cyclic voltammograms of the studied carbons in the aforementioned electrolyte within the potential window from 0 to 0.7 V (vs. SCE) at 0.5 mV s−1 scan rate. All samples exhibited quasi-rectangular CV curves and redox peaks at low sweep rates (Fig. 4a). Deviations from the rectangular shape of the CV curves are explained by faradaic reactions of oxygen and/or nitrogen functional groups, which participate to the total capacitance through pseudocapacitance contribution. No correlation was found between the carbonisation temperature and the anodic and cathodic current densities obtained, since the samples carbonised at 900 °C did not exhibit higher current density values. However, a correlation was found between the CV curves and the method by which the carbons were prepared: whereas the samples directly carbonised (M-750 and M-900) exhibited high current densities and broad redox peaks in the potential range of 0.15–0.5 V (due to oxygen groups), the materials prepared by HTC (MH-750, MH-900 and SH-900) showed low current density values and small peaks between 0.3 and 0.5 V (due to oxygen and nitrogen groups).


image file: c6ra16314a-f4.tif
Fig. 4 Electrochemistry results obtained from CV experiments carried out with a three-electrode cell: (a) cyclic voltammograms of all carbons in the potential range of 0–0.7 V at the scan rate of 0.5 mV s−1; (b) specific capacitance as a function of scan rate; (c) retention of specific capacitance as a function of scan rate; (d) cycling stability of raw and washed M-750 samples at the scan rates of 0.5 and 10 mV s−1.

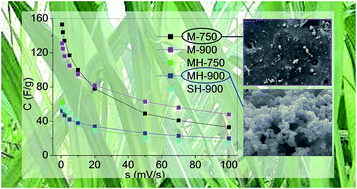
Fig. 4b displays the specific capacitance evolution for the different samples as a function of scan rate. The samples prepared by direct carbonisation yielded higher specific capacitance values in the studied sweep rate interval than the HTC-derived ones, whose specific capacitances were very similar to each other. Thus, M-750 and M-900 presented specific capacitances of 153 and 131 F g−1 at 0.5 mV s−1. The CV curves of M-900 and MH-900 exhibited a quasi-rectangular shape up to 20 mV s−1 (Fig. S-7 in ESI section shows MH-900 as representative sample), and these carbons yielded the higher values of capacitance retention as a function of scan rate, ∼40% at 100 mV s−1 (Fig. 4c) due to their higher mesopore volumes in comparison with the other carbons. The CV curves of M-750 and SH-900 maintained their quasi-rectangular shapes up to a scan rate of 10 mV s−1 (Fig. S-7 displays M-750 as representative sample), and the capacitance retention only reached 21 and 26% at 100 mV s−1, respectively. This finding is explained by their porous texture, mainly composed of ultramicropores (diameter ∼0.5 nm), hardly accessible to the hydrated ions of the electrolyte.41 These small pores are indeed well-known to increase the inner resistance of the system and thus hinder electrolyte ions transport at high scan rates.

CV tests were also carried out in an EDLC-only system, 1 M NaNO3 electrolyte, in order to determine the respective contributions of the EDL and of the faradaic reactions to the total capacitance. The resultant CV curves at 0.5 mV s−1 and capacitance results at different scan rates for two representative samples, M-750 and MH-750, are shown in Fig. S-8. When comparing the CV curves obtained in the two electrolytes, the existence of broad redox peaks in H2SO4 is evidenced for M-750, especially between 0 and 0.5 V (Fig. S-8a). The capacitance in NaNO3 is 31.4% lower than that obtained in H2SO4 and this difference could be related to the pseudocapacitance contribution of the system (Fig. S-8c). On the contrary, such difference is negligible for MH-750, indicating that the capacitance is mainly controlled by an EDL mechanism (Fig. S-8b and d).

The effect of KCl on the electrochemical performances of the carbons was studied by CV. Fig. 4d displays the evolution of specific capacitance, measured at scan rates of 0.5 and 10 mV s−1, as a function of the number of cycles for raw and washed M-750 samples. The washed samples did not contain KCl and yielded specific capacitance values 7 and 11% higher than the corresponding values for M-750 at 0.5 and 10 mV s−1, respectively.

Since the porous texture was almost unaffected after KCl removal, as observed above, the enhanced CV performance might be related to the increase of electrical conductivity. The cycling stability of both carbons was similar and the specific capacitance values remained almost constant until 1500 cycles at both 0.5 and 10 mV s−1 scan rates.

To further study the electrochemical performances of the present materials, GCD tests were carried out in a two-electrode cell, and the results are shown in Fig. 5. The charge–discharge curves obtained at 0.5 A g−1 for the molasses-based carbons (Fig. 5a) presented a slightly asymmetric shape, non-linear voltage profiles and increasing IR drops at increasing current densities, suggesting the existence of faradaic processes associated to nitrogen and/or oxygen moieties. These features are explained by the existence of high ion-transport resistances and low electrical conductivities. On the contrary, the GCD curves of SH-900 possessed symmetrical and quasi-triangular shape, small IR drop and short charge–discharge times, suggesting a more ideal capacitive behaviour.


image file: c6ra16314a-f5.tif
Fig. 5 Results obtained from GCD experiments carried out in a two-electrode cell: (a) GCD curves at 0.5 A g−1 current density; (b) evolution of specific capacitance as a function of applied current; (c) percentage of capacitance retention versus applied current; (d) Ragone plot; (e) cycling stability of the carbon electrodes at 0.5 A g−1 until 5000 cycles; (f) specific capacitances versus SBET for M-750 and M-900 samples studied in this work, and for other materials found in the literature: OMCs = ordered mesoporous carbons; ACFs = activated carbon nanofibres.

As shown in Fig. 5b, M-750 yielded the highest value of gravimetric capacitance at low current density, ∼32 F g−1. According to the approach proposed by Centeno and Stoeckli42 and using the ABET value in the equation, the pseudocapacitance contribution to the total capacitance was ∼97.1%. M-900 presented a gravimetric capacitance of ∼27 F g−1 at low current density, and the pseudocapacitance contribution was lower, 56.6%. Interestingly, MH-750 and MH-900 presented gravimetric capacitances of ∼3 and 8 F g−1 at low current density despite possessing ABET values of 232 and 214 m2 g−1, respectively. Both samples exhibited no pseudocapacitance contribution; this is quite surprising taking into account that the surface oxygen content of both materials was 7.5 at%, and could be related to a low accessibility of electrolyte ions to the surface functionalities. SH-900, which presented an ABET as high as 562 m2 g−1, yielded the lowest specific capacitance at low current density, 2 F g−1, with no pseudocapacitance contribution. However, considering for example the SNLDFT value of M-750, the pseudocapacitance reached only 35.2%, which is similar to 31.4% calculated from CV tests in H2SO4 and NaNO3 electrolytes. This could indicate that ABET really underestimates the surface area accessible to the electrolyte in this type of materials exhibiting narrow porosities, while SNLDFT leads to a better estimation of the pseudocapacitance contribution.

Increasing the current density strongly affected the specific capacitances of the materials (Fig. 5c); M-750, M-900 and MH-750 presented low capacitance retention at 5 A g−1, 10–12%, in agreement with the pronounced pseudocapacitive behaviour of both materials.

The Ragone plot displayed in Fig. 5d further confirmed these results. M-750 and M-900 exhibited the highest energy density at 0.1 A g−1 of ∼6.9 W h kg−1 under power outputs of 132 and 500 W kg−1, respectively. On the contrary, SH-900 yielded poor energy and power densities of 0.42 W h kg−1 and 132 W kg−1, respectively, which sharply decreased with the current density. Few works studying sugarcane molasses-based carbons as electrode materials for SCs can be found in literature. Capacitance values of ∼172 F g−1 at 1 A g−1 current density were reported in a former work, in which electrospun carbon microfibres obtained from cane molasses and 1.5 M tetraethyl ammonium tetrafluoroborate in acetonitrile electrolyte were used.26 M-750 and M-900 carbons exhibited specific capacitance values of ∼13 and 9 F g−1, respectively, at the same current density, but their surface areas were considerably lower (8 and 102 m2 g−1, respectively) than those of the electrospun carbon fibres (580 m2 g−1) and different electrolytes were also used.

The stability of the carbon-based supercapacitors was studied by long-term charge–discharge cycling at the current density of 0.5 A g−1 (Fig. 5e). More than 67% specific capacitance was retained over 5000 cycles in the studied carbon-based supercapacitors. The cycling performances showed an inverse relationship with the magnitude of the pseudocapacitance contribution: M-750 and M-900 exhibited the lowest cycling performances of 67.6 and 77.0%, respectively, MH-900 had an intermediate cycling performance of 80.8%, and MH-750 and SH-900 yielded the highest performances of 90.9 and 99.7%, respectively.

Fig. 5f shows some data of specific capacitances obtained in a two-electrode cell with 1 M H2SO4 electrolyte and ABET values of previous works dealing with carbon-based supercapacitors. M-750 and M-900 studied in this work exhibited much lower ABET values than all other carbon materials, such as biomass-based materials derived from wood43 or prawn shells,44 ordered mesoporous carbons (OMCs)45,46 or oxidised activated carbon fibres (ACFs).47 However, the specific capacitances of M-750 and M-900 were comparable or even higher than those of the aforementioned materials from the literature.44

From CV and GCD experiments, some contrasted results should be noticed. On one hand, M-750 and M-900 showed the highest specific capacitances at low scan rates and current densities (see Fig. 4b and 5b) despite the fact that they possessed the lowest specific surface areas (8 and 102 m2 g−1, respectively) and low electrical conductivities (0.015 and 2.006 S cm−1, respectively). On the other hand, SH-900 exhibited both the highest surface area (562 m2 g−1) and the highest electrical conductivity (13.8 S cm−1) but one of the lowest specific capacitances (Fig. 4b and 5b).

Given that most of the porosity may be inaccessible to ions and given the different pseudocapacitance contributions to the total capacitances, the surface chemistry of the carbon samples clearly appears to be the key factor for explaining their different observed electrochemical performances. Therefore, the interfacial capacitances (C/ABET and C/SNLDFT) were calculated by dividing the specific capacitances obtained at 0.1 A g−1 by the surface areas obtained through the BET and NLDFT methods. The interfacial capacitance gives information about the materials' pseudocapacitance, the latter being directly proportional to the heteroatom content.48

C/ABET and C/SNLDFT values were thus plotted together versus the content of surface oxygen groups of the samples, and the resultant trends are displayed in Fig. 6. No significant correlation was found between the interfacial capacitances and the small amount of nitrogen groups detected at the surface of MH-750 and MH-900, so it is not possible to determine if they participate in pseudocapacitive processes. The insoluble sulphates and sulphides are not believed to contribute to the pseudocapacitance of the different electrodes.


image file: c6ra16314a-f6.tif
Fig. 6 Variation of interfacial capacitance, C/ABET (a) and C/SNLDFT (b), as a function of surface concentration of oxygen functional groups: OI (quinones, carbonyls), OII (phenols, ethers, esters and anhydrides) and OIII (esters, anhydrides and carboxylic acids).

As commented above, the BET method underestimates the surface area of materials with narrow micropores. Previous studies dealing with the accessibility of aqueous electrolytes to micropores indicated that pores smaller than 0.5 nm could accommodate neither N2 molecules nor simple hydrated ions at low rates.49 Since the main pore diameter of the studied samples is ∼0.5 nm, ABET could be considered in this case as a more appropriate estimation of surface area in order to determine the interfacial capacitance. Although Fig. 6a and b show a direct relationship between the surface concentration of OI and OII oxygen groups (namely quinones, carbonyls, phenols, ethers, esters and anhydrides) and C/ABET, the correlation coefficients are higher when using C/SNLDFT. Thus, it seems that interfacial capacitance may be better defined in terms of SNLDFT for samples exhibiting porosities mainly composed of narrow pores (size < 0.7 nm). This affirmation is in agreement with the results shown above, but it should be confirmed by studying a much larger number of samples. Keeping this in mind, Fig. 6b could indicate that increasing OI and OII surface concentrations produced enhanced capacitances. The surface concentration of OIII groups showed no clear and probably negligible effects on the normalised capacitance values.

As stressed by these results, certain oxygen functional groups might account for the outstanding pseudocapacitive behaviour of the molasses-derived samples, M-750 and M-900, such as quinones, carbonyls, phenols, ethers, esters and anhydrides. Their participation to faradaic reactions related to pseudocapacitance has been already reported.42,50 Among them, quinones and carbonyl groups were proved to enhance the pseudocapacitance in H2SO4 electrolyte50 and might account for the high pseudocapacitive character of the molasses-based materials studied in this work.

Conclusions

Carbon materials obtained from sugarcane molasses either by HTC and subsequent carbonisation or by direct carbonisation exhibit low surface areas. Their porosities mainly comprise ultramicropores of size ∼0.5 nm that are hardly accessible to electrolyte ions. These materials exhibit high oxygen concentrations, about 7.5 at% at the surface of the HTC-derived carbons and 18–21 at% at the surface of directly carbonised molasses. Despite their poorly developed porosities, the carbons obtained by direct carbonisation of molasses yielded high capacitances in 1 M H2SO4 electrolyte, reaching 153 F g−1 at 0.5 mV s−1 in a three-electrode cell and 32 F g−1 at 0.1 A g−1 in a two electrode-cell. This is explained by the high pseudocapacitance contribution of these samples, which is 35.2% in the molasses sample carbonised at 750 °C. Such high pseudocapacitances are related to the considerable amount of surface oxygen functionalities, especially quinones and carbonyl functional groups. Meso-structuration and/or activation of molasses materials might be useful strategies to improve their porosities and achieve higher electrochemical performances.

Acknowledgements

The IJL research team gratefully acknowledges the financial support of the CPER 2007-2013 “Structuration du Pôle de Compétitivité Fibres Grand’Est” (Competitiveness Fibre Cluster), through local (Conseil Général des Vosges), regional (Région Lorraine), national (DRRT and FNADT) and European (FEDER) funds. Part of this work was supported by CHEERS project (FEDER funds). Dr A. Sanchez-Sanchez acknowledges the University of Lorraine and the Region Lorraine for financing her post-Doctoral contract.

References

  1. J. R. Miller and P. Simon, Science, 2008, 321, 651–652 CrossRef CAS PubMed.
  2. P. Simon and Y. Gogotsi, Nat. Mater., 2008, 7, 845–854 CrossRef CAS PubMed.
  3. F. Beguin, V. Presser, A. Balducci and E. Frackowiak, Adv. Mater., 2014, 26, 2219–2251 CrossRef CAS PubMed.
  4. E. Frackowiak, Q. Abbas and F. Béguin, J. Energy Chem., 2013, 22, 226–240 CrossRef CAS.
  5. W. Gu, M. Sevilla, A. Magasinski, A. B. Fuertes and G. Yushin, Energy Environ. Sci., 2013, 6, 2465 CAS.
  6. M. Zhou, F. Pu, Z. Wang and S. Guan, Carbon, 2014, 68, 185–194 CrossRef CAS.
  7. X. Yu, H. J. Kim, J.-Y. Hong, Y. M. Jung, K. D. Kwon, J. Kong and H. S. Park, Nano Energy, 2015, 15, 576–586 CrossRef CAS.
  8. J. P. Paraknowitsch and A. Thomas, Energy Environ. Sci., 2013, 6, 2839 CAS.
  9. D. Hulicova-Jurcakova, A. M. Puziy, O. I. Poddubnaya, F. Suárez-García, J. M. D. Tascón and G. Q. Lu, J. Am. Chem. Soc., 2009, 131, 5026–5027 CrossRef CAS PubMed.
  10. D. M. Anjos, J. K. McDonough, E. Perre, G. M. Brown, S. H. Overbury, Y. Gogotsi and V. Presser, Nano Energy, 2013, 2, 702–712 CrossRef CAS.
  11. Y. J. Oh, J. J. Yoo, Y. I. Kim, J. K. Yoon, H. N. Yoon, J.-H. Kim and S. B. Park, Electrochim. Acta, 2014, 116, 118–128 CrossRef CAS.
  12. A. Sánchez-Sánchez, F. Suárez-García, A. Martínez-Alonso and J. M. D. Tascón, Carbon, 2013, 62, 193–203 CrossRef.
  13. L. Wei, M. Sevilla, A. B. Fuertes, R. Mokaya and G. Yushin, Adv. Energy Mater., 2011, 1, 356–361 CrossRef CAS.
  14. M.-M. Titirici, in Novel Carbon Adsorbents, Elsevier, Oxford, 2012, pp. 351–399,  DOI:10.1016/B978-0-08-097744-7.00012-0.
  15. C. Long, L. Jiang, X. Wu, Y. Jiang, D. Yang, C. Wang, T. Wei and Z. Fan, Carbon, 2015, 93, 412–420 CrossRef CAS.
  16. P. Kleszyk, P. Ratajczak, P. Skowron, J. Jagiello, Q. Abbas, E. Frąckowiak and F. Béguin, Carbon, 2015, 81, 148–157 CrossRef CAS.
  17. Y.-J. Ou, C. Peng, J.-W. Lang, D.-D. Zhu and X.-B. Yan, New Carbon Mater., 2014, 29, 209–215 CrossRef.
  18. W. Feng, P. He, S. Ding, G. Zhang, M. He, F. Dong, J. Wen, L. Du and M. Liu, RSC Adv., 2016, 6, 5949–5956 RSC.
  19. J. Hou, C. Cao, X. Ma, F. Idrees, B. Xu, X. Hao and W. Lin, Sci. Rep., 2014, 4, 7260 CrossRef CAS PubMed.
  20. M. Sevilla and A. B. Fuertes, Carbon, 2009, 47, 2281–2289 CrossRef CAS.
  21. P. Kim, J. B. Joo, W. Kim, J. Kim, I. K. Song and J. Yi, Catal. Lett., 2006, 112, 213–218 CrossRef CAS.
  22. K. S. W. Sing, in Adsorption by Carbons, ed. J. M. D. Tascón, Elsevier, Amsterdam, 2008, pp. 3–14,  DOI:10.1016/B978-008044464-2.50005-5.
  23. J. H. Scofield, J. Electron Spectrosc. Relat. Phenom., 1976, 8, 129–137 CrossRef CAS.
  24. M. Thommes, K. A. Cychosz and A. V. Neimark, in Novel Carbon Adsorbents, Elsevier, Oxford, 2012, pp. 107–145,  DOI:10.1016/B978-0-08-097744-7.00004-1.
  25. C. L. Burket, R. Rajagopalan, A. P. Marencic, K. Dronvajjala and H. C. Foley, Carbon, 2006, 44, 2957–2963 CrossRef CAS.
  26. A. Kurniawan, L. K. Ong, F. Kurniawan, C. X. Lin, F. E. Soetaredjo, X. S. Zhao and S. Ismadji, RSC Adv., 2014, 4, 34739–34750 RSC.
  27. J. L. Figueiredo, M. F. R. Pereira, M. M. A. Freitas and J. J. M. Órfão, Carbon, 1999, 37, 1379–1389 CrossRef CAS.
  28. J. Adánez, V. Fierro, J. A. de Diego, L. F. de Diego and F. García-Labiano, Thermochim. Acta, 1996, 277, 151–164 CrossRef.
  29. U. Golla-Schindler, G. Benner, A. Orchowski and U. Kaiser, Microsc. Microanal., 2014, 20, 715–722 CrossRef CAS PubMed.
  30. Y. Zhou, S. L. Candelaria, Q. Liu, Y. Huang, E. Uchaker and G. CaO, J. Mater. Chem. A, 2014, 2, 8472–8482 CAS.
  31. K. T. Cho, S. B. Lee and J. W. Lee, J. Phys. Chem. C, 2014, 118, 9357–9367 CAS.
  32. E. M. Van der Merwe, C. A. Strydom and J. H. Potgieter, Thermochim. Acta, 1999, 340–341, 431–437 CrossRef CAS.
  33. M. E. Labib, J. H. Thomas III and D. D. Embert, Carbon, 1984, 22, 445–451 CrossRef CAS.
  34. W. Q. Hull, F. Schon and H. Zirngibl, Ind. Eng. Chem., 1957, 49, 1204–1214 CrossRef CAS.
  35. D. Briggs, Surface Analysis of Polymers by XPS and Static SIMS, Cambridge University Press, 1998 Search PubMed.
  36. D. Briggs and J. T. Grant, Surface analysis by Auger and X-ray photoelectron spectroscopy, IM Publications, Chichester, 2003 Search PubMed.
  37. A. B. Dongil, B. Bachiller-Baeza, A. Guerrero-Ruiz, I. Rodriguez-Ramos, A. Martinez-Alonso and J. M. Tascon, J. Colloid Interface Sci., 2011, 355, 179–189 CrossRef CAS PubMed.
  38. M.-M. Titirici, M. Antonietti and N. Baccile, Green Chem., 2008, 10, 1204–1212 RSC.
  39. D. Pantea, H. Darmstadt, S. Kaliaguine and C. Roy, J. Anal. Appl. Pyrolysis, 2003, 67, 55–76 CrossRef CAS.
  40. Y. Xia and R. Mokaya, Adv. Mater., 2004, 16, 1553–1558 CrossRef CAS.
  41. H. Shi, Electrochim. Acta, 1996, 41, 1633–1639 CrossRef CAS.
  42. T. A. Centeno and F. Stoeckli, Electrochim. Acta, 2011, 56, 7334–7339 CrossRef CAS.
  43. R. Asakura, T. Kondo, M. Morita, H. Hatori and Y. Yamada, Tanso, 2004, 2004, 231–235 CrossRef.
  44. F. Gao, J. Qu, Z. Zhao, Z. Wang and J. Qiu, Electrochim. Acta, 2016, 190, 1134–1141 CrossRef CAS.
  45. A. B. Fuertes, G. Lota, T. A. Centeno and E. Frackowiak, Electrochim. Acta, 2005, 50, 2799–2805 CrossRef CAS.
  46. C. Vix-Guterl, E. Frackowiak, K. Jurewicz, M. Friebe, J. Parmentier and F. Béguin, Carbon, 2005, 43, 1293–1302 CrossRef CAS.
  47. H. Oda, A. Yamashita, S. Minoura, M. Okamoto and T. Morimoto, J. Power Sources, 2006, 158, 1510–1516 CrossRef CAS.
  48. U. B. Nasini, V. G. Bairi, S. K. Ramasahayam, S. E. Bourdo, T. Viswanathan and A. U. Shaikh, J. Power Sources, 2014, 250, 257–265 CrossRef CAS.
  49. J. Koresh and A. Soffer, J. Electroanal. Chem. Interfacial Electrochem., 1983, 147, 223–234 CrossRef CAS.
  50. D. Hulicova-Jurcakova, M. Seredych, G. Q. Lu and T. J. Bandosz, Adv. Funct. Mater., 2009, 19, 438–447 CrossRef CAS.

Footnote

Electronic supplementary information (ESI) available. See DOI: 10.1039/c6ra16314a

This journal is © The Royal Society of Chemistry 2016
Click here to see how this site uses Cookies. View our privacy policy here.