DOI:
10.1039/C6RA15612F
(Paper)
RSC Adv., 2016,
6, 77629-77635
Glycidylmethacrylate based resin functionalized with graphene oxide for column preconcentration and trace determination of Cd(II) and Ni(II) in environmental and food samples†
Received
15th June 2016
, Accepted 8th August 2016
First published on 9th August 2016
Abstract
A novel solid phase extractant was synthesized by the immobilization of graphene oxide onto a glycidylmethacrylate matrix via coupling through the diethylenetriamine spacer arm and explored for the development of a column method for the preconcentration and flame atomic absorption spectrometric determination of Ni(II) and Cd(II) in environmental and food samples. The sorbent was characterized by Fourier transform infrared spectroscopy, elemental analysis, scanning electron microscopy, transmission electron microscopy, energy dispersive X-ray analysis and 13C NMR. The SPE method was optimized by varying experimental parameters such as pH, time, flow rate and elution. Under the optimized conditions the sorbent shows preconcentration factors of 180, 160 and detection limits of 0.23 and 0.06 μg L−1 for Ni(II) and Cd(II), respectively. The absence of systematic and constant errors in the developed method was confirmed by analysis of a Standard Reference Material and recovery experiments (>95% recovery with <5% RSD) after spiking of a known amount of analyte in real samples.
1. Introduction
Graphene oxide (GO) is a well established two-dimensional single-layered sp2-hybridized carbon compound derived from graphite by chemical oxidation.1 In solid phase extraction (SPE) and preconcentration of metal ions2–5 GO is used due to its large specific surface area leading to high sorption capacity and the hydrophilic functional groups like epoxy (–COC), hydroxyl (–OH), carbonyl (–CO), and carboxyl (–COOH) present on the edges and basal plane of GO6,7 form chelates with the metal ions8 and show fast metal ion uptake. Direct use of GO in SPE becomes challenging, particularly when the sheet size ranges on the nanoscale, due to unfavorable phase separation and recycling of GO.2 Recently published data show the use of GO in the separation and preconcentration of metal ions by dispersive solid phase extraction (DSPE),9 dispersive magnetic solid phase extraction (DMSPE)10,11 and cloud point extraction (CPE).12 However, these methods have several drawbacks e.g. dispersive mode filtration of GO leads to its aggregation because of strong van der waals interactions and π–π stacking between GO sheets which can significantly affect the efficiency and reusability and needs sonication for redispersion of GO. During filtration there is a possibility of escape of GO which is simplified by the use of DMSPE. In CPE, the regeneration of GO is not possible since the analyte along with GO slurry is introduced into atomic spectrometer for analyte determination and gets degraded during atomization.12 Moreover, in all the three methods, application of large sample volume is restricted for metal ion preconcentration. Direct use of GO in SPE cartridge/column creates back pressure and needs a high pressure peristaltic pump which may results in GO escaping.8 In order to simplify these problems GO can be immobilized onto a solid support material for column application, providing enough flow rate for large sample volume without a use of high-pressure peristaltic pump. These solids not only play a role of support but also enhance the hydrophilicity due to the presence of functional groups and provide spacer arms. The introduction of spacer arm between the solid supports and GO is a new approach by virtue of which GO behaves in a manner similar to DSPE as well as free monomeric ligand in homogenous system for longer spacer arms and forms complexes with metal ions.13,14 In this work, we have synthesized a novel GO-based solid phase extractant by the coupling of GO with glycidyl methacrylate polymer beads via diethylenetriamine spacer arm for the separation and preconcentration of metal ions. The polymer bound GO sheets restricts to aggregation and leaching from column compared to direct use of GO and can be reused for several sorption elution cycle in SPE.
2. Material and methods
2.1 Reagents and solutions
All reagents used in this work were of analytical reagent grade. Stock solutions of Ni(II) and Cd(II) (1000 mg L−1) were purchased from Merck (Darmstadt, Germany). Graphite powder (50 μm) and 2,2-azobisisobutyronitrile (AIBN) were acquired from Otto Chemie Pvt. Ltd. (Mumbai, India). Glycidyl methacrylate (GMA) and divinylbenzene (DVB) were obtained from Fluka (Buchs, St. Gallen, Switzerland) and Sigma-Aldrich (St. Louis, MO, USA), respectively. Ethylenediamine (EDA) and diethylenetriamine (DETA) were received from Merck (Mumbai, India). Triple distilled water (TDW) was used for the dilution of the samples. The standard reference material (SRM) rice flour NIES-10c was obtained from the National Institute of Environmental Studies (Ibaraki, Japan) and JSS 513-4 Cr steel from Iron and Steel Institute of Japan (Tokyo, Japan). For wet digestion of the samples, reagents nitric acid (HNO3), hydrochloric acid (HCl), perchloric acid (HClO4) and hydrogen peroxide (H2O2) used were procured from Merck (Mumbai, India).
2.2 Instrumentation
An atomic absorption spectrometer, GBC 932+ (Dandenong, Australia) with deuterium background correction was used for the determination of Ni and Cd at a wavelength of 232.0 nm and 228.8 nm respectively. For pH measurement, an Orion 2 star model pH meter from Thermo Scientific (Waltham, MA, USA) was used. Dynamic studies were carried out using a column (1 × 10 cm) obtained from J-SIL Scientific Industries (Agra, UP, India). Elemental (CHNO) analysis was done on Flash EA 1112 Organic Elemental Analyzer, Thermo Fischer Scientific (Waltham, MA, USA). FT-IR spectral studies were performed on a PerkinElmer Spectrum Two spectrometer (Waltham, MA, USA), using a KBr disk method in the range between 500 and 4000 cm−1 with the resolution of 2.0 cm−1. Brunauer–Emmett–Teller (BET) surface area analysis and pore size measurements were done on Quantachrome Instruments (Boynton Beach, FL, USA). Thermal gravimetric analysis/differential thermal analysis (TGA/DTA) was run on the Shimadzu TGA/DTA (Kyoto, Honshu, Japan). Scanning electron microscopy (SEM) along with energy dispersive X-ray analysis (EDS) spectra (Jeol JSM-6510LV, Tokyo, Japan) was used to record the micrographs for the surface morphology and micro compositional analysis of the sorbent. Transmission electron microscope (TEM) images were recorded (Jeol JEM-2100 microscope, MA, USA) at a maximum accelerating voltage of 200 kV. 13C NMR was recorded on Bruker Avance III HD (Germany).
2.3 Synthesis of poly (GMA-co-DVB) DETA-GO resin
GO was synthesized from graphite powder by modified Hummers method.1 GO was immobilized onto the resins having different amines chelating units.
GMA-DVB-EDA-GO (p-EDAGO) and GMA-DVB-DETA-GO (p-DETAGO) resins were prepared by using a 10 g of GMA-DVB resin beads as prepared earlier.15 After swelling in water for 2 h, first 5 g of resin beads were mixed with 3 mL of EDA in 20 mL of TDW and the remaining 5 g resin was treated with DETA (2 mL in 25 mL TDW). The resultant mixtures individually undergo on refluxing for 10 h, after refluxing the products were thoroughly washed with distilled water and methanol to remove the unreacted EDA, DETA and then oven dried. The resulting products abbreviated as p-EDA, p-DETA, respectively. In the second step, GO was immobilized onto the p-EDA resin, taking 3 g of resin beads in a 250 mL of round bottom flask containing 25 mL of DMF, 5 mL of GO solution (2 mg mL−1) and a coupling agent N,N′-dicyclohexylcarbodiimide (DCC).2 The solution mixture refluxed for 12 h with continuous stirring at a temperature of 60 °C. Similarly, 2.5 g of p-DETA resin was refluxed with a mixture of 4 mL of GO solution (2 mg mL−1) and DCC in 25 mL DMF at 60 °C for 12 h. The final products obtained were washed with distilled water thoroughly and dried in an oven overnight. The synthesis scheme of the resin was shown in Fig. 1.
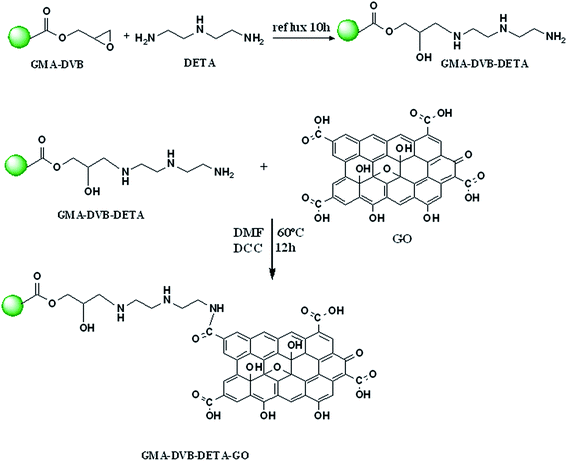 |
| | Fig. 1 Proposed scheme for the synthesis of p-DETAGO. | |
2.4 Pretreatment of samples and SRM
Electroplating industry wastewater (Aligarh, India), river water (the Ganga, Narora, India), and tap water (Laboratory, Department of Chemistry) were filtered through a cellulose membrane filter (Millipore) of 0.45 μm pore size, acidified to pH 2 with concentrated HNO3, and stored in precleaned polyethylene bottles, while the food sample (fruit juice) was purchased from a local market (Aligarh, India) and digested by wet oxidation with concentrated HNO3, HClO4, and 30% H2O2.16 The residue was dissolved in 2 mL of 0.5 M HNO3 and finally made up to 50 mL with TDW. The solution of SRM (NIES 10c and JSS 513-4 Cr steel) were prepared as reported in earlier work.15,17
2.5 Recommended column procedure for preconcentration of metal ions
A glass column was packed with 0.2 g resin with a bed height of 0.8 cm after swelling in TDW and preconditioned by passing 5 mL of a buffer solution of pH 8.0 ± 0.1 before subjected to further experiments. Sample solution adjusted to pH 8.0 ± 0.1 of optimum concentration was passed through the column at a flow rate of 2–6 mL min−1. Sorbed Ni(II) and Cd(II) were eluted with 5.0 mL of 2 M HCl and the concentration of these metals was determined subsequently by FAAS.
3. Result and discussion
3.1 Characterization
The FT-IR spectra of p-DETAGO resin shown in figure (ESI1†). The O–H stretching vibrations18,19 of (–COOH and –OH) is appearing at 3373.8 cm−1 and peak for sp2 –CH stretching vibrations appeared at 2943.5 cm−1. The sharp band at 1725.26 cm−1 is due the presence of C![[double bond, length as m-dash]](https://www.rsc.org/images/entities/char_e001.gif) O.19 N–H (bending), C–N and C–O bands are observed at 1560.88 cm−1, 1387.66 cm−1 and 1160.59 cm−1, respectively.18,19 The peak 1271.42 cm−1 is due to –CH of the epoxy group. The band 1472.41 cm−1 can be attributed to stretching of CC bonds.19 The chemical shifts observed in 13C NMR spectra (ESI2†) indicates the presence of amide bond (168.37 ppm), –CH2–NHR (45.22 ppm), benzylic –C–NHR (66.22 ppm, 67.22 ppm), aromatic carbons (106.66–138.66 ppm), carboxylic carbon (177.59 ppm), and carbonylic carbon (179.34 ppm). The incorporation of an amine group on to GMA matrix was estimated by shaking 0.5 g of p-DETA resin with 50 mL of 0.05 M HCl for 24 h. The residual HCl was measured titrimetrically against 0.05 M NaOH. The number of moles of HCl that interacted with the amine group and consequently the amine content were found to be 1.95 mM g−1 of the resin. Multi point BET surface area of p-DETAGO resin was found to be 51.063 m2 g−1. Structure morphology of p-DETAGO was evaluated by the SEM analysis along with EDS. GO sheets were decorated on the surface of the p-DETA resin beads as it can be seen from the SEM and TEM images (Fig. 2). The presence of atom on pendant functional groups after immobilization of GO on GMA-DETA and metal ion complexation was confirmed by EDS analysis shown in Fig. 3 including their elemental% weight. The elemental analysis C, H, N and O resulted in % content as 55.6, 7.7, 7.0 and 29.7. TGA analysis shows that the resin was thermally stable up to 245 °C (ESI3†).
O.19 N–H (bending), C–N and C–O bands are observed at 1560.88 cm−1, 1387.66 cm−1 and 1160.59 cm−1, respectively.18,19 The peak 1271.42 cm−1 is due to –CH of the epoxy group. The band 1472.41 cm−1 can be attributed to stretching of CC bonds.19 The chemical shifts observed in 13C NMR spectra (ESI2†) indicates the presence of amide bond (168.37 ppm), –CH2–NHR (45.22 ppm), benzylic –C–NHR (66.22 ppm, 67.22 ppm), aromatic carbons (106.66–138.66 ppm), carboxylic carbon (177.59 ppm), and carbonylic carbon (179.34 ppm). The incorporation of an amine group on to GMA matrix was estimated by shaking 0.5 g of p-DETA resin with 50 mL of 0.05 M HCl for 24 h. The residual HCl was measured titrimetrically against 0.05 M NaOH. The number of moles of HCl that interacted with the amine group and consequently the amine content were found to be 1.95 mM g−1 of the resin. Multi point BET surface area of p-DETAGO resin was found to be 51.063 m2 g−1. Structure morphology of p-DETAGO was evaluated by the SEM analysis along with EDS. GO sheets were decorated on the surface of the p-DETA resin beads as it can be seen from the SEM and TEM images (Fig. 2). The presence of atom on pendant functional groups after immobilization of GO on GMA-DETA and metal ion complexation was confirmed by EDS analysis shown in Fig. 3 including their elemental% weight. The elemental analysis C, H, N and O resulted in % content as 55.6, 7.7, 7.0 and 29.7. TGA analysis shows that the resin was thermally stable up to 245 °C (ESI3†).
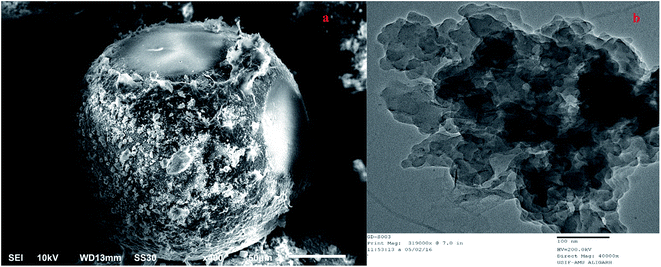 |
| | Fig. 2 Micrographs of p-DETAGO (a) SEM and (b) TEM showing the decoration GO sheets onto the GMA matrix. | |
 |
| | Fig. 3 EDS investigation after Ni(II) and Cd(II) sorption. | |
3.2 Optimization of experimental parameters
A univariate approach was adopted for the optimization of experimental parameters such as effect of solution pH, effect of time, sample flow rate and eluent type and concentration, in order to develop an effective SPE method for preconcentration and determination of Ni(II) and Cd(II). The variables pH, time and eluent was optimized by batch mode while rest of with the recommended column procedure. The pH is an important parameter for the sorption of metal ions. For optimization of sample pH, 0.1 g of p-DETAGO resin was equilibrated with 50 mL of 0.05 mM Ni(II) and Cd(II) ions solution over a pH range of 2.0–10.0 for 180 min. It can be seen from Fig. 4a that sorption capacity of both metal ions was found to be a maximum at pH 8.0. The slight decrease in the sorption capacity was observed at pH 9.0 and 10.0. The pH studies for p-EDAGO were also carried out as shown in a Table 1. It is clear from the data that the sorption capacity of p-EDAGO resin was less than that of p-DETAGO resin. Hence, p-DETAGO was selected as a final sorbent for rest of the experimental studies. The higher capacity of the p-DETAGO resin is because of deprotonation, which makes the oxygen-containing GO functional groups negatively charged, which facilitates complexation with Ni2+ and Cd2+ owing to the strong electrostatic interactions.20 Hence, pH 8.0 was fixed as optimum for rest of the studies. Sorption behaviour is more clearly understood by the point of zero charged (pHpzc) studies which was carried out following the procedure as reported in some previous literature.21,22 The 0.1 g of the p-DETAGO resin and 50 mL solution of 0.1 M NaCl were taken into a series of conical flasks with their initial pH (pHi) adjusted in the range 2.0–10.0. It was kept for 24 h with occasional shaking and the final pH (pHf) was measured after decanting. The value of pHpzc was found to be 4.6 from point of intersection in pHi versus ΔpH (pHi–pHf) as shown in figure (ESI4†). Since pHpzc < pH it was concluded that the surface of the resin is negatively charged and favors the sorption of positive metal ions due to strong electrostatic interaction. For the optimization of contact time between resin and metal ions, the sorption of Ni(II) and Cd(II) on p-DETAGO resin was studied in the different time interval and it was observed from the experimental results that 40 min was sufficient for the complete sorption of Ni(II) and 30 min for Cd(II) Fig. 4b. Thus, Ni(II) takes more time than Cd(II) to reach the equilibrium because of high complexation rate between borderline acid Ni(II) and hard base O− of GO while Cd(II) comes in the category of soft acids. Fast sorption kinetics is a great advantage for the preconcentration studies. Column flow rate was optimized by passing a 100 mL solution containing 5 μg of Ni(II) and Cd(II) buffered at pH 8.0 ± 0.1 over the range of 2–7 mL min−1. The results showed that the sorption of the analyte ions on the column was unaffected up to a flow rate of 2.5 mL min−1 for Ni(II) and 5.0 mL min−1 for Cd(II) and it was maintained throughout the column experiment. HCl and HNO3 were used as an eluent in order to check the quantitative recovery of sorbed Ni(II) and Cd(II). It was observed from the experimental studies that 5 mL of 2 M HCl gives the recovery of >98% for both the metal ion. Thus, 5 mL of 2 M HCl was selected as an eluting agent. The effect of temperature on the sorption of metal ions has been studied by batch method. The results are shown in the table (Table S1†). Increase of sorption capacity as well as decrease of loading half time for both Ni(II) and Cd(II) were observed with the increase of temperature which are in agreement with reported studies.23,24 However, 25 ± 0.2 °C was selected for further studies since application of SPE method involves real samples having temperature closed to it. The prepared p-DETAGO resin was tested for reusability by several loading and elution cycles and it was concluded that resin can be regenerated up to 36 cycles without loss in capacity indicating that GO remains immobilized on to resin matrix. The releases of GO sheets are potential health threat to ecosystems.25 Hence, the method is environmentally green and has good application in the separation and preconcentration of metal ions.
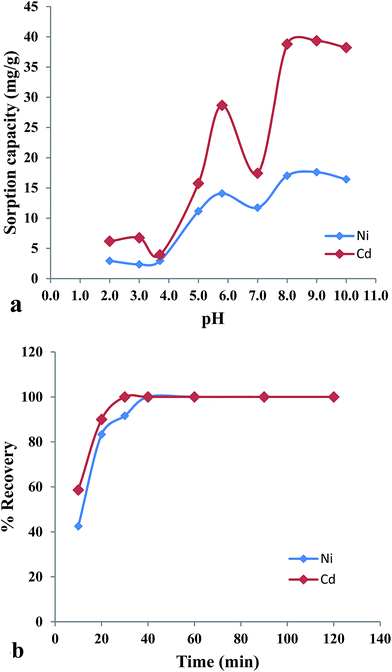 |
| | Fig. 4 (a) Effect of sample solution pH on the sorption of Ni(II) and Cd(II) and (b) effect of contact time on the % recovery of Ni(II) and Cd(II). | |
Table 1 Comparison of sorption capacity of different sorbent during synthesis (experimental conditions: 0.1 g resin, 50 mL solution of 0.05 mM Ni(II) and Cd(II))
| Sorbent |
pH |
Ni(II) SCa (mg g−1) |
Cd(II) SCa (mg g−1) |
| Sorption capacity. |
| GMA-DVB-EDA |
8.0 |
1.76 |
10.12 |
| GMA-DVB-EDA-GO |
8.0 |
9.39 |
37.66 |
| GMA-DVB-DETA |
8.0 |
7.04 |
30.35 |
| GMA-DVB-DETA-GO |
8.0 |
17.02 |
38.78 |
3.3 Interference studies
The selectivity of proposed preconcentration/determination technique was tested under the optimized conditions by analyzing various cations and anions inevitably associated with metal ions in all natural water samples. The extraction efficiency of the p-DETAGO resin in the determination of Ni(II) and Cd(II) was affected by these ions through the precipitate formation, redox reactions, or competing for complexation reactions, either of interferent anions with the analyte metal ions or of the metal ions in the matrix with the sorbent. In order to see the interfering effect, 5 μg of Ni(II) and Cd(II) was checked out with some transition, alkali and alkaline earth metal ions (Table 2). As it was evidenced from the results, that no significant interferences were observed in the determination of Ni(II) and Cd(II) up to an appreciable tolerance level. Hence, the prepared resin has good applicability in the trace preconcentration and determination of analyte ions in different samples. The tolerance limit is defined as the interfering ion concentration causing a relative error smaller than ±5% related to the preconcentration/determination of the analytes.
Table 2 Interference studies of some commonly interfering ions in the determination of Ni(II) and Cd(II) by FAAS (experimental conditions: 0.1 g resin, 100 mL solution containing 5 μg of Ni(II) and Cd(II))a
| Interfering ions |
Added as |
Tolerance limit Ni(II) (μg L−1) |
Tolerance limit Cd(II) (μg L−1) |
| Relative error < ±5%. |
| Zn |
ZnCl2 |
500 |
200 |
| Cd |
CdCl2 |
500 |
— |
| Ni |
NiNO3 |
— |
500 |
| Fe |
Fe(NO3)3 |
400 |
250 |
| Cr |
CrCl3 |
400 |
250 |
| Cu |
Cu(NO3)2 |
400 |
250 |
| Co |
Co(NO3)2 |
500 |
200 |
| Pb |
Pb(NO3)2 |
500 |
250 |
| Na |
NaCl |
19 × 105 |
19 × 105 |
| Mg |
MgCl2 |
48 × 104 |
48 × 105 |
| Cl |
NaCl |
30 × 105 |
30 × 106 |
| HPO4−2 |
Na2HPO4 |
11 × 105 |
11 × 106 |
| CH3COO− |
C3H2NaO2 |
11 × 104 |
11 × 105 |
| NO3− |
NaNO3 |
15 × 104 |
15 × 105 |
3.4 Preconcentration studies
Our ultimate object is to preconcentrate the trace metal ions in water samples before subjected to FAAS determination in order to improve the detection limit and reduction of matrix effects which further enhances the accuracy. Preconcentration studies were done by constant loading (5 μg) of Ni(II) and Cd(II) with increasing volume of samples. As a result of this, preconcentration limits were found to be 5.56 μg L−1 and 6.25 μg L−1 along with the preconcentration factors of 180, 160 for Ni(II) and Cd(II), respectively.
3.5 Analytical method validation
Limit of detection (LOD), limit of quantification (LOQ), linearity and correlation coefficient (R2) were important parameters for validation of method.26,27 A calibration curve was plotted using least square method under the optimized conditions which results regression equation Y = 0.054XNi + 0.038 and Y = 0.264XCd + 0.015 and correlation coefficient R2 = 0.998 for Ni(II) and Cd(II). The LOD and LOQ were found to be 0.23, 0.76 μg L−1 for Ni(II) and 0.06, 0.20 μg L−1 for Cd(II). The inter-day and intra-day repeatability experiments were performed in order to check the precision of the method by running 3 replicates of 50 mg L−1 Cd(II) and Ni(II) between three columns and for three consecutive days. The average column to column and day to day coefficient of variation of the method was found to be 2.96, 3.14% for Cd(II) and 3.46, 2.54% for Ni(II), respectively. The accuracy of the method was tested by analyzing SRM by the recommended column procedure. Calculated Student's t (t-test) values for Ni(II) and Cd(II) ions were found to be less than the critical Student's t value of 4.303 at 95% confidence level for N = 3 (Table 3). Hence, the mean concentration values were not statistically significant from the certified values indicating that absence of systematic errors and demonstrate the accuracy of the proposed method. The reliability of the developed method was also investigated by the analysis of electroplating waste water, river water, tap water and fruit juice spiked with the known amount (5 μg) of Ni(II) and Cd(II), resulting in percentage recoveries of 95–107.2% with a relative standard deviation (RSD) <5% (Table 4).
Table 3 Validation of developed column preconcentration SPE method by the analysis of SRM for Ni and Cd concentration
| SRM |
Certified value (μg g−1) |
Found valuea (μg g−1) |
Calculated Student's t valueb |
| Mean value ± 95% confidence limit; N = 3. At 95% confidence limit. |
| Ni JSS 513-4 Cr steel |
1300 |
1289 ± 2.0 |
3.198 |
| Cd NIES-10c |
1.82 ± 0.06 |
1.79 ± 0.03 |
0.5814 |
Table 4 FAAS determination Ni(II) and Cd(II) in environmental water samples and fruit juice
| Sample |
Element |
Amount spikeda (μg L−1) |
Amount founda (μg L−1) |
% RSD |
% Recovery |
| Mean value ± 95% confidence limit; N = 3. |
| River water (Ganga) |
Ni(II) |
0 |
4.85 |
2.61 |
— |
| 10 |
14.92 |
1.24 |
100.7 |
| Cd(II) |
0 |
3.76 |
2.06 |
— |
| 10 |
13.26 |
3.54 |
94.97 |
| Tap water |
Ni(II) |
0 |
2.39 |
3.60 |
— |
| 10 |
13.11 |
0.73 |
107.2 |
| Cd(II) |
0 |
1.84 |
2.17 |
— |
| 10 |
11.85 |
0.34 |
100.1 |
| Electroplating waste water |
Ni(II) |
0 |
30.26 |
0.49 |
— |
| 25 |
54.09 |
0.48 |
95.33 |
| Cd(II) |
0 |
2.22 |
1.69 |
— |
| 25 |
27.27 |
0.06 |
100.2 |
| Fruit juice |
Ni(II) |
0 |
14.34 |
0.27 |
— |
| 25 |
39.53 |
0.16 |
100.7 |
| Cd(II) |
0 |
2.92 |
2.24 |
— |
| 25 |
27.61 |
0.71 |
98.77 |
4. Conclusion
A novel GO based solid phase extractant was used in a column SPE method which allowed the determination of trace metal ions by cheap and less sensitive technique such as FAAS. Toxic GO was not observed to escape from p-DETAGO even after 36 sorption/elution cycles and elution of metal ions do not involve use of any carcinogenic organic solvents. The proposed method was simple, economic, ecofriendly and successfully applied for the separation and preconcentration of Cd(II) and Ni(II) in electroplating waste water, river water, tap water and fruit juice samples without any significant interference from commonly occurring cations and anions. The validity and reliability of the method was indicated by good accuracy and precision. It is evident from the comparison (Table 5) that the presented method shows good analytical figure of merits over other GO based column SPE method. Potential application in the removal of Cd(II) and Ni(II) could further be explored since it possesses comparatively high sorption capacity.
Table 5 Comparison of figure of merits with previously reported GO based column SPE method
| Sorbent |
Analyte |
SCa (mg g−1) |
LODb (μg L−1) |
Flow rate (mL min−1) |
PFc |
Technique |
Reference |
| Sorption capacity. Limit of detection. Preconcentration factor. N-(5-Methyl-2-hydroxyacetophenone)-N′-(2-hydroxyacetophenone) ethylene diamine. 3-(1-Methyl-1H-pyrrol-2-yl)-1H-pyrazole-5-carboxylic acid. 2-(tert-Butoxy)-N-(3-carbamothioylphenyl) acetamide. |
| GMA-DVB-DETA-GO |
Ni, Cd |
17.02, 38.78 |
0.23, 0.06 |
2.5, 5.0 |
180, 160 |
FAAS |
This work |
| Si-GO |
Cu, Pb |
4.9, 13.6 |
0.084, 0.27 |
7 |
250, 200 |
FI-AAS |
8 |
| Si-GO |
Mn, Co, Ni Cu, Cd, Pb |
— |
|
0.2 |
10 |
ICP-MS |
28 |
| GO-TiO2 |
Cu, Pb, La, Ce, Eu, Dy, Yb |
0.8, 13.5, 3.8, 2.9, 2.8, 2.7, 3.2 |
0.48, 2.64, 0.41, 0.24, 0.13, 0.26, 0.21 |
0.5 |
10 |
ICP-OES |
29 |
| GO-MCNTs-DETA |
Cr, Fe, Pb, Mn |
5.4, 13.8, 6.6, 9.5 |
0.16, 0.50, 0.24, 0.38 |
1.5 |
75 |
ICP-OES |
30 |
| GO-MHEd |
Co, Ni |
6.8, 7.0 |
0.25, 0.18 |
10 |
250 |
FAAS |
31 |
| GO-MPPCe |
Mn, Fe |
21.6, 24.0 |
0.145, 0.162 |
8 |
325 |
FAAS |
32 |
| GO-TBCPAf |
Fe, Ni, Cu, Zn |
6.7, 6.4, 6.0, 6.1 |
0.39, 0.11, 0.63, 0.45 |
9 |
250 |
FAAS |
33 |
References
- W. S. Hummers and R. E. Offeman, J. Am. Chem. Soc., 1958, 80, 1339 CrossRef CAS.
- A. Islam, H. Ahmad, N. Zaidi and S. Kumar, ACS Appl. Mater. Interfaces, 2014, 6, 13257–13265 CAS.
- B. Zawisza, A. Baranik, E. Malickal, E. Talik and R. Sitko, Microchim. Acta, 2016, 183, 231–240 CrossRef CAS PubMed.
- R. Sitko, B. Zawisza and E. Malicka, TrAC, Trends Anal. Chem., 2013, 51, 33–43 CrossRef CAS.
- M. Ghazaghi, H. Z. Mousavi, A. M. Rashidi, H. Shirkhanloo and R. Rahighi, Anal. Chim. Acta, 2016, 902, 33–42 CrossRef CAS PubMed.
- G. X. Zhao, J. X. Li, X. M. Ren, C. L. Chen and X. K. Wang, Environ. Sci. Technol., 2011, 45, 10454–10462 CrossRef CAS PubMed.
- A. Lerf, H. He, M. Forster and J. Klinowski, J. Phys. Chem. B, 1998, 102, 4477–4482 CrossRef CAS.
- R. Sitko, B. Zawisza, E. Talik, P. Janik, G. Osoba, B. Feist and E. Malicka, Anal. Chim. Acta, 2014, 834, 22–29 CrossRef CAS PubMed.
- K. Pytlakowska, V. Kozik, M. Matussek, M. Pilch, B. Hachuła and K. Kocot, RSC Adv., 2016, 6, 42836–42844 RSC.
- A. Islam, H. Ahmad, N. Zaidi and S. Kumar, Microchim. Acta, 2016, 183, 289–296 CrossRef CAS.
- E. Kazemi, S. Dadfarnia and A. M. H. Shabani, Talanta, 2015, 141, 273–278 CrossRef CAS PubMed.
- D. Deng, X. Jiang, L. Yang, X. Hou and C. Zheng, Anal. Chem., 2014, 86, 758–765 CrossRef CAS PubMed.
- H. Kumagai and Y. Inoue, Anal. Chem., 1998, 70, 4070–4073 CrossRef CAS PubMed.
- M. A. L. Tanco, D. A. P. Tanaka, V. C. Flores, T. Nagase and T. M. Suzuki, React. Funct. Polym., 2002, 53, 91–101 CrossRef CAS.
- A. Islam, N. Zaidi, H. Ahmad and S. Kumar, Environ. Sci. Pollut. Res., 2015, 22, 7716–7725 CrossRef CAS PubMed.
- A. Islam, H. Ahmad, N. Zaidi and S. Yadav, Ind. Eng. Chem. Res., 2013, 52, 5213–5220 CrossRef CAS.
- A. Islam, N. Zaidi, H. Ahmad and S. Kumar, RSC Adv., 2015, 5, 46662–46671 RSC.
- R. S. Drago, Physical Methods in Inorganic Chemistry, Litton Educational Publishing, USA, 1965 Search PubMed.
- G. Socrates, Infrared Characteristics Group Frequencies, John Wiley & Sons, New York, 1980 Search PubMed.
- R. Sitko, E. Turek, B. Zawisza, E. Malicka, E. Talik, J. Heimann, A. Gagor, B. Feista and R. Wrzalik, Dalton Trans., 2013, 42, 5682–5689 RSC.
- A. H. Gedam and R. S. Dongre, RSC Adv., 2015, 5, 54188–54201 RSC.
- S. Jayanthi, N. K. R. Eswar, S. A. Singh, K. Chatterjee, G. Madras and A. K. Sood, RSC Adv., 2016, 6, 1231–1242 RSC.
- H. H. Najafabadi, M. Irani, L. R. Rad, A. H. Haratameh and I. Haririan, RSC
Adv., 2015, 5, 16532–16539 RSC.
- A. Islam, M. A. Laskar and A. Ahmad, J. Chem. Eng. Data, 2010, 55, 5553–5561 CrossRef CAS.
- Y. L. Chang, S. T. Yang, J. H. Liu, E. Dong, Y. W. Wang, A. N Cao, Y. F Liu and H. F. Wang, Toxicol. Lett., 2011, 200, 201–210 CrossRef CAS PubMed.
- S. Patra, E. Roy, R. Madhuri and P. K. Sharma, Environ. Sci. Technol., 2015, 49, 6117–6126 CrossRef CAS PubMed.
- A. Islam, H. Ahmad, N. Zaidi and S. Kumar, RSC Adv., 2016, 6, 5590–5598 RSC.
- S. Su, B. Chen, M. He and B. Hu, Talanta, 2014, 123, 1–9 CrossRef CAS PubMed.
- Y. Zhang, C. Zhong, Q. Zhang, B. Chen, M. He and B. Hu, RSC Adv., 2015, 5, 5996–6005 RSC.
- X. Zhu, Y. Cui, X. Chang and H. Wang, Talanta, 2016, 146, 358–363 CrossRef CAS PubMed.
- M. R. Pourjavid, M. Arabieh, S. R. Yousefi, M. R. Jamali, M. Rezaee, M. H. Hosseini and A. A. Sehat, Mater. Sci. Eng., C, 2015, 47, 114–122 CrossRef CAS PubMed.
- M. R. Pourjavid, A. A. Sehat, M. Arabieh, S. R. Yousefi, M. H. Hosseini and M. Rezaee, Mater. Sci. Eng., C, 2014, 35, 370–378 CrossRef CAS PubMed.
- M. R. Pourjavid, A. A. Sehat, M. H. Hosseini, M. Rezaee, M. Arabieh, S. R. Yousefi and M. R. Jamali, Chin. Chem. Lett., 2014, 25, 791–793 CrossRef CAS.
Footnote |
| † Electronic supplementary information (ESI) available: Further information on characterization of p-DETAGO; FTIR spectrum, 13C NMR, TGA/DTA, pHpzc and Table S1. See DOI: 10.1039/c6ra15612f |
|
| This journal is © The Royal Society of Chemistry 2016 |
Click here to see how this site uses Cookies. View our privacy policy here. 


