Rapid pre-symptomatic recognition of tristeza viral RNA by a novel fluorescent self-dimerized DNA–silver nanocluster probe

Ehsan Shokria, Morteza Hosseini*a, Farnoush Faridbodb and Mahdi Rahaiea
aDepartment of Life Science Engineering, Faculty of New Sciences & Technologies, University of Tehran, Tehran, Iran. E-mail: smhosseini@khayam.ut.ac.ir; Fax: +98 21 61112788; Tel: +98 21 61112788
bCenter of Excellence in Electrochemistry, Faculty of Chemistry, University of Tehran, Tehran, Iran

Received 11th June 2016 , Accepted 9th October 2016

First published on 12th October 2016


Abstract

Citrus tristeza virus (CTV), a positive-strand RNA virus within the family of Closteroviridae, is distributed worldwide and causes one of the most economically important diseases of citrus. Since the CTV pathogen is easily spread by graft propagation and aphid vectors, continual monitoring of healthy seedlings and eradication of infected plants is essential for better disease management. In this study, a novel self-dimerized DNA–silver nanocluster probe was developed for the simple and rapid pre-symptomatic detection of CTV severe strains in biological preparations. Insertion of a G rich loop maker sequence containing internal complementary bases in the probe structure leads to the formation of a stable homodimer probe with a G-rich loop at the center that is more reactive than the formless probe. Interestingly, the results showed that the probe structure conversion between dimeric and non dimeric states upon DNA/RNA hybridization, produced an enhanced fluorescence signal allowing precise and sensitive detection of tristeza RNA. Based on the sensitivity test, CTV-RNA in the range of 5–210 nM, can be linearly detected with the detection limit of 2.5 nM. Finally, the results of our DNA–AgNCs based fluorometric assay were consistent with the results of the conventional RT-PCR.

1 Introduction

Citrus tristeza virus (CTV) is a phloem-limited virus transmitted by infected buds and by various aphid species which has led to the decline and death of millions of citrus trees worldwide. The virus exists in multiple types that usually are referred to as mild and severe strains.1 Mild strains do not produce noticeable symptoms in field conditions and are used against CTV severe strains through the cross-protection strategy.2 Severe strains have been characterized on the basis of their biological activities on indicator plants and lead to three different syndromes that are briefly called QD, SP and SY.3 Trees affected by QD syndrome wilt rapidly and die within a few years or after a short period of time. The decline is generally exhibited by sweet orange, mandarin, or grapefruit when they are grafted on infected sour orange rootstock.

In citrus-growing areas, often a mixture of CTV populations4 can be found. So, any attempts to prevent or decrease the spread of the CTV depend on accurate and early identification of the infected plants. One of the common ways to detect infection with CTV is based on symptoms in sensitive hosts like Mexican lime (Citrus aurantifolia). For many years, biological indexing was performed constantly, however the assays did not provide efficient results and have inherent difficulties for large-scale analysis and maintaining indicator plants. Serological methods like ELISA are routinely used for the accurate detection of CTV,5 but some inherent limitations make them difficult to perform. As an alternative to serological methods a class of techniques, including molecular hybridization with cDNA or cRNA probes6 and PCR-based methods,7 were also developed that greatly improved sensitivity of diagnosis and simultaneously provide the possibility of absolute quantification and variation detection in CTV viral RNA. PCR-based method is very commonly used in the laboratory but these methods are time consuming, require expensive equipment and expertise for diagnosis.

Recently, a group of nanocomposite materials based on DNA–cations interaction have been introduced.8 Metal cations like Ag, Au and Hg could interact with heterocyclic bases and localized in DNA structure which could then be reduced to form small nanoclusters, typically composed of a few metal atoms. Among DNA-nanoclusters, fluorescent DNA–Ag clusters have found wide applications in the field of label-free biosensing owing to strong brightness, excellent photostability, water solubility and low toxicity.9,10 In addition, fluorescence emission of DNA–Ag clusters can be tuned to create highly fluorescent blue, green, and yellow emitters by modifying the DNA scaffold sequences.11 Recently, DNA–Ag clusters has been widely employed to design and fabricate various biosensors for detection of metal ions, protein, single stranded DNA, and microRNA by fluorimetry or colorimetry means.9,12–14

To detect target nucleic acids, the DNA/AgNCs probe was widely applied. Structurally, DNA/AgNCs probes consist of a hosting scaffold for AgNCs and a target recognition site that were interconnected together. In the presence of analyte, the recognition site (which is complementary to the target) hybridized with it, affected the emission intensity of AgNCs part of the probe by enhancement, quenching or shifting the emission wavelength. At present, a number of highly emissive hosting DNA for a AgNCs with multi-color switching properties have been developed.9 However, the efforts to create a series of probes to detect different DNA/RNA targets with current AgNCs hosting DNA were failed. This is because when the recognition site is substituted with another target sequence, not all probes form fast, bright and useable emission.15 Previously, we examine four distinct DNA emitter scaffolds (C12, red, green, yellow) for specific and label-free detection of tristeza mild RNA.16 Our results showed that for optimal detection many factors, including compatibility between hosting and capture sequences, probe secondary structures, synthesis and hybridization buffers combination must be carefully adjusted. Recently, several studies have emphasized the importance of secondary structures of hosting DNA for AgNCs formation. Cytosine and guanine rich DNA sequences that were forming i-motif and G-quadruplex structures respectively, are able to encapsulate emissive AgNCs species in a pH-dependent manner.17,18 It is also shown that DNA self-dimers and cytosine hairpins and are good hosts for stabilizing AgNCs.15,19

On the basis of the previous findings, in the present work we designed a novel self-dimerized DNA–silver nanocluster probe with the G-rich loops at the center and used it to detect CTV severe RNA (Scheme 1). The results showed that the self-dimerization and G-rich loops was significantly improved probe performance and provide a fluorescent enhancement signal for sensitive and rapid pre-symptomatic detection of tristeza severe RNA.


image file: c6ra15199j-s1.tif
Scheme 1 Scheme illustrating the sensing procedure for CTV RNA detection based on the self-dimerized DNA/AgNCs probes (SEVlo and SEVnl).

2 Experimental details

2.1 Chemical reagents

Silver nitrate (AgNO3, 99.998%) and sodium borohydride (NaBH4, 98%) was prepared from Sigma Aldrich and used without further purification. Ultra pure Milli-Q water (pH = 7) was used for all solutions. Oligonucleotides were synthesized by Shanghai Generay Biotech Co. (Shanghai, China) and purified by PAGE to remove residual salts.

2.2 DNA & RNA oligos

A specific sequence (SEV: AGCGGATGACTTAGCGAC), that had already reported7 based on the sequence of isolates T318A and SY568 for severe SP isolates was chosen for CTV probes designing. The 12nt nano cluster nucleation sequence (red emitter AgNCs nucleation seq.: 5′-CCTCCTTCCTCC-3′) alone and in combination with G-linker sequence (5′-ACCGCAGGG-3′) was attached to 5′ termini of SEV strands to produce SEVnl and SEVlo DNAs, respectively. The SEVlo DNA effectively self assembled into the homodimer form and shaped G-rich loops at the center as a result of base pair matching conducted with G-linker sequence. In contrast, the SEVnl DNA didn't have complementary parts and not formed any stable secondary structure (formless DNA) (Scheme 1). The suffix: nl and lo were respectively standing for non-loop and loop-own probes. For detection assays a set of RNA sequences were synthesized as a full-complementary (RNA-SEV), semi-complementary (RNA-MLD) and non-complementary (RNA-NC) targets. The RNA-MLD was based on the sequence of mild CTV isolates T385 and T30 (ref. 7) and had 6 mismatches with the sequence of RNA-SEV. All strands information used in this study are briefly described in Table 1.
Table 1 Probe and target sequences used in this study
Name Sequence 5′…3′ Description
Red emitter AgNCs nucleation seq. CCTCCTTCCTCC Used as AgNCs nucleation sequence
G-Linker CCGCAGGGAGCGC G-Rich loop maker sequence
SEVnl DNA [CCTCCTTCCTCC]AGCGCATGACTTAGCGAC Used as DNA template for SEVnl/AgNC probe synthesis
SEVlo DNA [CCTCCTTCCTCCACCGCAGGG]AGCGGATGACTTAGCGAC Used as DNA template for self dimerized SEVlo/AgNC probe synthesis
RNA-UC ACGUUGUCGACGUCAUCA Non-complementary target
RNA-SEV GUCGCUAAGUCAUCCGCU Full-complementary target
RNA-MLD AGUCAUCAAGUCGUCCAUU Semi-complementary target
Primers F: CGCCAATTTGATCTGTGAACG For RT-PCR amplification
R: GCGAAAGCAAACATCTCGACTC


2.3 DNA/AgNCs synthesis

For synthesis of 50 μL solution of fluorescent silver nanoclusters, 7.5 μM of SEVnl or SEVlo DNAs in SB buffer (2 mM sodium phosphate, pH = 7) were heated at 90 °C for 5 min, and were cooled at room temperature for at least 1 h to form dimeric structure. Then, 105 μM of AgNO3 was added to the solutions of the SEVnl or SEVlo DNA oligos (molar ratio: 1DNA[thin space (1/6-em)]:[thin space (1/6-em)]14AgNO3) and after ice incubation for 30 min, 105 μM NaBH4 was added to the solutions under vigorous shaking μL. The DNA/AgNCs probes (SEVnl/AgNCs & SEVlo/AgNCs) were stored for 1 h (SEVlo/AgNCs) and 12 h (SEVnl/AgNCs) at 25 °C in dark condition before measurement by a fluorimeter.

2.4 DLS analysis

The size and zeta-potential distribution of DNA/AgNCs was measured using a Zetasizer Nano ZS (Malvern, UK) at 25 °C.

2.5 Spectroscopic analysis

The UV-vis absorption spectra were recorded by a Perkin Elmer Lambda 25 spectrophotometer in the range of 200–790 nm, with 1.0 cm × 1.0 cm quartz cuvette. All fluorescence spectra were measured by a model LS-55 spectrofluorometer (Perkin-Elmer, USA) equipped with a xenon lamp. Fluorescence lifetimes were determined via a time correlated single photon counting setup (TCSPC) by using an FLS-920 picosecond fluorescence lifetime spectrometer (Edinburgh Instruments, UK). Circular dichroism (CD) spectra were recorded on a JASCO (J-810) using a 0.1 cm path length quartz cell.

2.6 Detection procedure

For the RNA detection assay, different concentrations of the RNA targets were added to a fixed amount (7.5 μM) of the SEVnl/AgNCs and SEVlo/AgNCs probes in 50 μL SB buffer. The solutions were kept at 25 °C for 30 min and then before measurement by a fluorimeter, the final volume of the solutions was adjusted to 250 μL upon addition of 200 μL of distilled water.

2.7 Plant samples

In this study, eighteen sweet orange seedlings (on citrange rootstock) were graft-inoculated with two bark pieces from plants infected with CTV isolate. Plant pots were kept in a controlled condition and 40 days after CTV infection the total RNA from all seedlings was extracted using guanidine thiocyanate modified method. The first strand cDNA was extended using 400 ng of total RNA according to RevertAid Reverse Transcriptase procedure (Fermentas). Universal CTV oligonucleotide primers, 5′-CGCCAATTTGATCTGTGAACG-3′ and 5′-GCGAAAGCAAACATCTCGACTC-3′, were used as forward and reverse primers (Table 1), respectively, to specifically amplify a single amplicon of 186 bp. Program of PCR cycling was performed for 2 min initial denaturation at 94 °C, followed by 35 cycles of 1 min denaturation at 94 °C, 30 s at the annealing temperature (Ta = 50 °C) and 30 s elongation at 72 °C. Final elongation step was 5 min at 72 °C. The fragments were run on 1% agarose gel in 1× TBE (Tris Borate EDTA) buffer by electrophoresis for 45 minutes at 90 V and stained with ethidium bromide before visualization in UV trans-illuminator.

3 Results and discussion

3.1 Synthesis of self-dimerized DNA/AgNCs

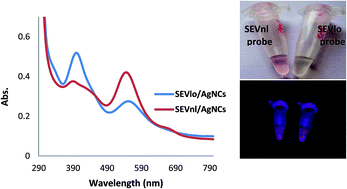
By using DNA sequences SEVnl and SEVlo as capping scaffolds fluorescent DNA/AgNCs were formed according to material and methods section. A few hours after the synthesis process different color was observed in SEVnl/AgNCs (pale red) and SEVlo/AgNCs (pale yellow) solutions under the visible light (Fig. 1-inset, up). Under UV lamp, AgNCs from SEVlo/AgNCs probe exhibited so much brighter red fluorescent light than SEVnl/AgNCs probe (Fig. 1-inset, down). UV-vis absorption spectrum for both probes showed two absorption peaks with different intensities around 400 and 550 nm which were, according with the result reported by.20,21 (Fig. 1). SEVnl/AgNCs showed an intense fluorescent peak at 545 nm and weak fluorescent peak at 390 nm while the SEVlo/AgNCs probe reversely displayed a high and low absorption at 400 nm and 550 nm respectively. The UV-vis absorption patterns of probes explain the color differences between them in exposure to visible light. Since it has been previously reported20 that absorption peak at 550 nm was characteristic of DNA/AgNCs, it can be concluded that silver nanoclusters were packed in both probes. In addition, the obvious increase in the absorption peak at around 400 nm in SEVlo/AgNCs probe in comparison with SEVnl/AgNCs (Fig. 1) assigned to the silver nanoparticles and indicates that the Ag–cytosine interaction is limited by the SEVlo DNA dimeric structure. From previous reports, the binding affinities between Ag/NCs and DNA templates greatly depend on the secondary structures, with the observed binding affinity in the decreasing order of: coiled C-rich ssDNA > i-motif > DNA duplex > G quadruplex.22 The secondary structure of DNA not only affects the stability, but also the emission wavelength and absorption point of DNA/AgNCs.
image file: c6ra15199j-f1.tif
Fig. 1 UV-vis absorption spectra of silver nanocluster in SEVnl/AgNCs (red) and SEVlo/AgNCs (blue) probes. (Inset) SEVnl/AgNCs and SEVlo/AgNCs reactions color under room light (up) and UV (down).

3.2 Structural analysis

For structure comparisons and to confirm the dimeric nature of SEVlo/AgNCs probe CD spectroscopy was used to study DNA structure. The CD spectrum of both probes was measured before and after cluster synthesis. The CD spectrum of the SEVnl DNA shows a negative signal at 245 nm and a positive signal at 275 nm (Fig. 2), indicative of unfolded DNA in a random coil structure.23 After silver nanocluster formation (SEVnl/AgNCs) a significant change was observed in the long wavelength part of the CD spectrum and the negative band intensity was decreased (Fig. 2). In this case, the bands position was somewhat similar to that of i-motif characteristic CD bands (a positive band near 288 nm and a negative band near 256 nm at acidic pH).24 Unlike the SEVnl DNA, the CD spectrum of SEVlo DNA showed two higher positive peaks with a deeper single negative band at 235 nm. So in comparison with SEVnl DNA, an additional positive peak was seen at 220 nm and the position of negative peak was slightly shifted beyond the blue wavelengths. Furthermore, reducing Ag+ ions with NaBH4 and DNA–Ag nano cluster formation in SEVlo DNA just slightly shifted the peaks from their primary location, and did not have a severe impact on the peak ellipticity (Fig. 2). Based on these results we can conclude that the SEVnl DNA interacts with silver ions more efficiently and forms an i-motif like structure, while the SEVlo DNA spectrum representative of DNA in duplex structure and silver nanocluster formation did not induce a large impact on the CD spectra.
image file: c6ra15199j-f2.tif
Fig. 2 CD spectra of SEVnl DNA (red solid curve), SEVlo DNA (black solid curve), SEVnl/AgNCs (red dashed curve) and SEVlo/AgNCs (black dashed curve) solutions (each 15 μM) in SB buffer (pH = 7).

To more confirm these results, dynamic light scattering (DLS) was used. The data showed a significant size and zeta potential differences between the SEVnl/AgNC and SEVlo/AgNCs probes. The mean hydrodynamic radius for the SEVnl/AgNCs is 12.18 nm, which is larger than the radius measured for the SEVlo/AgNCs probe, 8.7 nm (Fig. S1a and b). The layer of SEVnl DNA surrounded the Ag nanocluster surface if assumes a random coiled conformation in aqueous solution would increase the hydrodynamic radius of the SEVnl/AgNCs probe. In addition, the more negative potential of SEVlo/AgNCs (−31.1) than SEVnl/AgNCs (−19.2) probe implies that it possesses better colloidal stability under physiological conditions.

3.3 Fluorescence behavior of self-dimerized SEVlo/AgNCs

3.3.1 Preliminary study. In order to compare the impact of self dimerization in the SEVlo/AgNCs probe versus non-dimeric structure of the SEVnl/AgNCs probe on the fluorescence emission of DNA/AgNCs, a full spectral scan as a function of excitation wavelength for the both probes were measured (Fig. S2a and b). Moreover, since the loop sequence may, itself served as a site of ions interaction the G-linker sequence was also used for AgNCs synthesis (according to methods) and fluorescence intensity was measured at different wavelengths (Fig. S2c). The result showed that the SEVnl/AgNCs and SEVlo/AgNCs probes displayed strong red emission at 620 nm and 640 nm (red signal), respectively (when excited at 545 nm), while there was no significant emission observed in G-linker sequence at different excitation wavelengths (Fig. S2a–c). In addition, another electronic transition was observed for both probes as a weaker band with λex = 440 nm/λem = 525 nm (green signal). These transitions (red and green signals) are in the spectral region for small silver nanoclusters, as expected from theoretical and experimental studies.25,26 Furthermore, the dimeric structure of the SEVlo/AgNCs probe leads to the slight shift (∼20 nm) to red wavelengths compared to SEVnl/AgNCs (Fig. S2a and b).
3.3.2 Life time analysis. Time-resolved emission decays of AgNCs templated by SEVnl and SEVlo DNAs exhibit biexponential decay kinetics behavior with an average lifetime of 1.63 ns for the SEVnl/AgNC and a prolonged average lifetime 3.29 ns for SEVlo/AgNCs probe (Fig. S3c). This result showed that the emission life time in SEVlo/AgNCs probe was significantly increased and dimeric structure induce a longer life emission state in comparison to SEVnl/AgNCs probe. The longer emission life time of the SEVlo probe is may be due to the existence of partial rigidity near the AgNCs which confers more stability to the silver clusters. In addition, DNA/AgNCs seems to be more passivated by G-rich loop, which resulted in longer emission lifetime by efficiently reduce the non-radiative recombination rate.31
3.3.3 Photostability. After addition of AgNO3 and reduction with NaBH4, fluorescence emission was read in both probes at specified intervals to show the time evolution of the fluorescence intensity. As shown in Fig. S3(a and b) the formation of the red emitting AgNCs with the SEVlo DNA is much faster and brighter than for the SEVnl sequence, and the maximum emission intensity is 20 times brighter after 1 h (Fig. S3a and b). The fluorescence intensity of SEVlo/AgNCs probe overloads after 3 h and remained at the highest level (overload state) for weeks without any detectable reduction (Fig. S3b). In contrast, a gradual decline in the fluorescence emission of SEVnl/AgNCs probe was observed in response to incubation time, while a significant reduction in the emission peak was triggered after 24 h and continuously declined during the time (presumably due to oxidation of Ag clusters) (Fig. S3a). Consistent with our results, Lee and co-workers 2015, indicated that Cyt12-AgNCs/Cyt12-AgNCs dimer connected by an Ag+ bridge, has a more intense green emission compared to non-dimeric Cyt12-AgNCs.27 It is also shown by other researchers that the structure of the whole probe plays important roles in the creation of the bright emissive AgNCs. Shah and co-workers 2012 showed that unstructured 12nt, 15nt, and 18nt single strand DNAs when used as template for AgNCs generate a lower emission than longer sequences (22nt and 23nt). These authors conclude that the higher emission of longer sequences were due to the self dimerization.15

Furthermore, from previous reports, the emission enhancement for nanocluster beacons is the strongest at the guanine-rich tail.28 A comparison of guanine and cytosine reveals that the larger size of guanine could potentially polarize the metal core as a “super atom”.29 The enhancer sequence maybe also constructs a new electronic state and the highly efficient energy transfer between this state and the surface state can create high emission.29 So, the large steady fast formed emission that was observed from AgNCs templated with SEVlo DNA can be arise from the new excited state and an induced polarization effect of G-rich loop that was formed by the G linker sequence upon self dimerization.

Finally, the oxidation level of AgNCs can also modulate the fluorescence properties. Petty and co-workers 2004, found that freshly prepared C12-AgNCs showed three emission bands at 490, 520, and 665 nm, respectively. With the addition of six more equivalents of NaBH4, the blue and green emissions were completely quenched, while the red emission was greatly enhanced. This suggests the blue and green emission properties relate to the surface oxidation states of AgNCs.20 Consistent with this, the SEVnl/AgNCs probe green emission signal at 525 nm was becoming stronger over the time, while at the same time we have seen a slight increase in the SEVlo/AgNCs green signal (data not shown). Interestingly, the SEVlo/AgNCs probe has a long shelf life (more than weeks) in comparison with the SEVnl/AgNCs probe. As previously reported, guanine has the lowest oxidation potential over other nucleotides, and it may serve as a reducing agent to reduce the nearby AgNCs and enhance the red fluorescence.30 Based on these results, we propose that G-rich loops and the dimeric conformation of the SEVlo/AgNCs probe exerts a strong protective effect against oxidation of the silver nanoclusters and leads to longer photostability.

3.4 Hybridization test (CTV RNA detection)

In order to study the response of SEVnl/AgNCs and SEVlo/AgNCs probes in reaction to complementary molecules, the RNA hybridization test was done. Interestingly, the result showed that the fluorescence light of SEVnl/AgNCs and SEVlo/AgNCs probes in the presence of target molecules quenched and enhanced, respectively (Fig. S4 and 3).
image file: c6ra15199j-f3.tif
Fig. 3 The fluorescence response of SEVlo/AgNCs probe to target RNA with different concentrations ranging from 0 to 840 nM. (Inset) The linear dynamic range was from 5 nM to 210 nM. Intensity of fluorescence reached a plateau in the presence of 1 μM of target RNA.

To evaluate the sensitivity and detection limit of the SEVlo/AgNCs probe in the presence of RNA-SEV target, the fluorescence intensity of SEVlo probe was plotted with respect to the concentrations (0 nM to 840 nM) of target RNA-SEV (Fig. 3, inset). The results showed that there is a linear dependence of the fluorescence intensity versus RNA-SEV target concentrations from 5 nM to 210 nM (R = 0.999) and based on that the detection limit (LOD) was estimated at 2.5 nM (Fig. 4c).


image file: c6ra15199j-f4.tif
Fig. 4 Selectivity of SEVlo/AgNCs probe towards CTV RNA-SEV. Emission spectra of SEVlo/AgNCs probe (black curve, control) and mixtures of SEVlo/AgNCs probe with different RNA targets. The RNA-SM contains RNA-SEV and RNA-MLD in equal concentrations (each 100 nM).

3.5 Selectivity

In the next step, under the optimal conditions, the effect of adding different RNA targets to the SEVlo/AgNCs probe solution was investigated to testify the selectivity of the CTV sensing platform. So the complementary RNA sequences specific for the mild CTV strains (RNA-MLD) alone and in combination with equal volume of RNA-SEV (RNA-SM) was added to the SEVlo/AgNC solution 1 h after synthesis at the final concentration of 200 nM. In addition, an uncomplimentary sequence was also selected as a negative control. As shown in Fig. 4. The CTV-RNA targets significantly enhanced the SEVlo/AgNC emission light with the increasing order of RNA-SEV > RNA-SM > RNA-MLD while uncomplimentary sequence has no effect.

3.6 Real sample assay

To study the impact of possible interfering compounds which usually exist in biological samples and as a proof of principle experiment, the performance of SEVlo/AgNC probe for detecting the presence of CTV-RNA in whole plant (citrus) endogenous RNA was investigated. For this detection assay, we used manually infected seedlings (18 plants) with no phenotypic symptoms in addition to some leaf samples, which was collected from the field disease trees as a positive control. In order to confirm the samples infection with virus particles, a portion of CTV genome was amplified with CTV general primers (Table 1) by using the conventional RT-PCR method. As shown in Fig. 5(a and b), 14/18 of infected seedlings was CTV positive due to the specific amplicon of CTV (186 bp band) was observed on agarose gel. Afterwards, upon the SEVlo/AgNC probe hybridized with total RNA of CTV infected seedlings a notable enhance of fluorescence was observed for the majority (16/18) of the samples. Comparing the SEVlo/AgNC probe detection power with RT-PCR results in this case showed that for most of the samples there was a high correspondence between the two methods (Fig. 5b). Finally, according to the Fig. 5a, adding the endogenous RNAs of healthy plants partially enhanced the red fluorescence of the SEVlo/AgNC probe. This is not due to the specific interaction with the CTV-RNA but is probably due to interaction with nonspecific RNAs and other unknown biological materials. Yang and Vosch 2011, investigated the possibility of detection of the presence of miRNA160 in whole plant (Arabidopsis) RNA on the basis of DNA–AgNC probe.32 These authors also concluded that a part of the drop in the red fluorescence of the DNA-12nt-RED-160 probe is not due to the specific interaction with the RNA-miR160 target. We found that the healthy plant signal for different species of citrus (including orange, sour orange, lemons and tangerine) in maximized state was 1 times more than the blank (data not shown), thus based on that as a general criteria to distinguish infected plants from healthy ones we suggest to use a baseline limit as: test signal intensity/blank signal intensity > 1.5. However, it is better to use the healthy plant RNA signal in each test as a baseline to achieve more accurate results.
image file: c6ra15199j-f5.tif
Fig. 5 (a) Emission spectra of SEVlo/AgNCs probe from a solution containing 1.5 μM of SEVlo/AgNCs probe and 2 μg of endogenous RNAs from healthy (black curve) or CTV infected plants. The baseline was showed as a black dashed line over the healthy plant signal (b) RT-PCR results of 18 seedlings were graft-inoculated with bark pieces of plants infected with CTV isolate on 1% agarose gel. Line (−) and (+) are CTV negative and positive controls. White asterisks represented the seedlings that showed enhanced signal in fluorometric assay with self dimerized SEVlo/AgNCs probe.

4 Conclusion

In this study, we have designed a novel specific DNA/AgNCs probe in dimeric form that was significantly showed enhanced fluorescent signals upon hybridization in the presence of CTV severe RNA. Formation of centrally G-rich loops and stability of the probe in dimeric state leads to a strong fluorescence within an 1 h, which was very stable for several weeks and leaving enough time for the detection of CTV RNA. In addition, the structural switch of probe from its dimeric form to its monomeric state upon DNA/RNA hybridization leads to an increase in fluorescence signal and provide a highly specific way for CTV RNA detection. In this regards, we have also shown that the self-dimerized DNA stabilized AgNCs can be used as a probe for tracing the presence of CTV complementary RNA in infected seedlings at an early stage. Finally, the self-dimerized DNA/AgNCs based probing procedure is an innovative method that has the potential to become useful not only for viral RNA detection, but also for tracing of any other DNA or RNA targets present in the biological samples likes miRNAs.

Acknowledgements

The authors thank the research Council of University of Tehran for financial support of this work.

References

  1. M. E. Hilf, V. A. Mavrodieva and S. M. Garnsey, Phytopathology, 2005, 95, 909 CrossRef CAS PubMed.
  2. A. Sambade, L. Rubio, S. M. Garnsey, N. Costa, G. W. Muller, M. Peyrou, J. Guerri and P. Moreno, Plant Pathol., 2002, 51, 257 CrossRef CAS.
  3. C. L. Niblett, H. Genc, B. Cevik, S. Halbert, L. Brown, G. Nolasco, B. Bonacalza, K. L. Manjunath, V. J. Febres, H. R. Pappu and R. F. Lee, Virus Res., 2000, 71, 97 CrossRef CAS PubMed.
  4. L. A. Matos, M. E. Hilf, X. A. Cayetano, A. O. Feliz, S. J. Harper and S. Y. Folimonova, Plant Dis., 2013, 97, 339 CrossRef.
  5. G. Nolasco, C. Santos, G. Silva and F. Fonseca, J. Virol. Methods, 2009, 155, 97 CrossRef CAS PubMed.
  6. L. Barbarossa and V. Savino, J. Phytopathol., 2006, 154, 329 CrossRef CAS.
  7. S. Ruiz-Ruiz, P. Moreno, J. Guerri and S. Ambrós, J. Virol. Methods, 2007, 145, 96 CrossRef CAS PubMed.
  8. J. Leng, W. M. Wang, L. M. Lu, L. Bai and X. L. Qiu, Nanoscale Res. Lett., 2014, 9, 99 CrossRef PubMed.
  9. J. M. Obliosca, C. Liu, R. A. Austin Batson, M. C. Babin and J. H. Werner, Biosensors, 2013, 3, 185 CrossRef CAS PubMed.
  10. H. Ahmadzadeh Kermani, M. Hosseini, M. Dadmehr and M. R. Ganjali, Anal. Bioanal. Chem., 2016, 408, 4311 CrossRef PubMed.
  11. C. I. Richards, S. Choi, J. C. Hsiang, Y. Antoku, T. Vosch, A. Bongiorno, Y. L. Tzeng and R. M. Dickson, J. Am. Chem. Soc., 2008, 130, 5038 CrossRef CAS PubMed.
  12. S. Li, W. Cao, A. Kumar, S. Jin, Y. Zhao, C. Zhang, G. Zou, P. C. Wang, F. Li and X. J. Liang, New J. Chem., 2014, 38, 1546 RSC.
  13. J. Sharma, H. C. Yeh, H. Yoo, J. H. Werner and J. S. Martinez, Chem. Commun., 2011, 47, 2294 RSC.
  14. J. J. Liu, X. R. Song, Y. W. Wang, A. X. Zheng, G. N. Chen and H. H. Yang, Anal. Chim. Acta, 2012, 749, 70 CrossRef CAS PubMed.
  15. P. Shah, A. Rørvig-Lund, S. B. Chaabane, P. W. Thulstrup, H. G. Kjaergaard, E. Fron, J. Hofkens, S. W. Yang and T. Vosch, ACS Nano, 2012, 6, 8803 CrossRef CAS PubMed.
  16. E. Shokri, M. Hosseini, F. Faridbod and M. Rahaie, J. Fluoresc., 2016, 26, 1795 CrossRef CAS PubMed.
  17. B. Sengupta, K. Springer, J. G. Buckman, S. P. Story, O. H. Abe, Z. W. Hasan, Z. D. Prudowsky, S. E. Rudisill, N. N. Degtyareva and J. T. Petty, J. Phys. Chem. C, 2009, 113, 19518 CAS.
  18. Y. Fu, J. Zhang, X. Chen, T. Huang, X. Duan, W. Li and J. Wang, J. Phys. Chem. C, 2011, 115, 10370 CAS.
  19. P. R. O'Neill, L. R. Velazquez, D. G. Dunn, E. G. Gwinn and D. K. Fygenson, J. Phys. Chem. C, 2009, 113, 4229 Search PubMed.
  20. J. T. Petty, J. Zheng, N. V. Hud and R. M. Dickson, J. Am. Chem. Soc., 2004, 126, 5207 CrossRef CAS PubMed.
  21. M. Dadmehr, M. Hosseini, S. Hosseinkhani, M. R. Ganjali and R. Sheikhnejad, Biosens. Bioelectron., 2015, 73, 108 CrossRef CAS PubMed.
  22. W. Li, L. Liu, Y. Fu, Y. Sun, J. Zhang and R. Zhang, Photochem. Photobiol. Sci., 2013, 12, 1864 CAS.
  23. H. A. Day, C. Huguin and Z. A. Waller, Chem. Commun., 2013, 49, 7696 RSC.
  24. X. Li, Y. Peng, J. Ren and X. Qu, Carboxyl-modified single-walled carbon nanotubes selectively induce human telomeric i-motif formation, Proc. Natl. Acad. Sci. U. S. A., 2006, 103, 19658 CrossRef CAS PubMed.
  25. I. Rabin, W. Schulze and G. Ertl, J. Chem. Phys., 1998, 108, 5137 CrossRef CAS.
  26. B. G. Ershov, G. V. Ionova and A. A. Kiseleva, Russ. J. Phys. Chem., 1995, 69, 239 Search PubMed.
  27. J. Lee, J. Park, H. H. Lee, H. Park, H. I. Kim and W. J. Kim, Biosens. Bioelectron., 2015, 68, 642 CrossRef CAS PubMed.
  28. H. C. Yeh, J. Sharma, J. Han, J. S. Martinez and J. H. Werner, Nano Lett., 2010, 10, 3106 CrossRef CAS PubMed.
  29. S. H. Yau, N. Abeyasinghe, M. Orr, L. Upton, O. Varnavski, J. H. Werner, H. C. Yeh, J. Sharma, A. P. Shreve and J. S. Martinez, Nanoscale, 2012, 4, 4247 RSC.
  30. C. A. M. Seidel, A. Schulz and M. H. M. Sauer, J. Phys. Chem., 1996, 100, 5541 CrossRef CAS.
  31. P. Juwon, S. Jaejung, P. Joonhyuck, P. Nokyoung and K. Sungjee, Bull. Korean Chem. Soc., 2014, 35, 1105 CrossRef.
  32. S. W. Yang and T. Vosch, Anal. Chem., 2011, 83, 6935 CrossRef CAS PubMed.

Footnote

Electronic supplementary information (ESI) available. See DOI: 10.1039/c6ra15199j

This journal is © The Royal Society of Chemistry 2016
Click here to see how this site uses Cookies. View our privacy policy here.