Evaluation of a drinking water treatment process involving directly recycling filter backwash water using physico-chemical analysis and toxicity assay

Bingwei Houab, Tao Lin*ab and Wei Chen*ab
aMinistry of Education Key Laboratory of Integrated Regulation and Resource Development on Shallow Lakes, Hohai University, Nanjing 210098, PR China. E-mail: hit_lintao@163.com; cw5826@hhu.edu.cn
bCollege of Environment, Hohai University, Nanjing 210098, PR China

Received 8th June 2016 , Accepted 7th August 2016

First published on 8th August 2016


Abstract

Recycling the filter backwash water of a drinking water treatment plant (DWTP) was considered as a feasible method to enhance the efficiencies of pollutant removal and water conservation. In this study, the purification efficiency and water quality evaluation were investigated in a DWTP with a direct recycling of sand filters backwash water (SFBW) at recycling rates of 0–30%. The concentrations of dissolved organic carbon and dissolved nitrogen matters, and the formation potentials of carbonated or nitrogenous disinfection by-products did not obviously increase or were even lower than that without recycling when the recycling rate of SFBW was less than 20%. The di-haloacetamides (DCAcAm) accounted for the majority of HAcAms formed during chlorination in all water extracts, followed by tri-HAcAms and, to a much lower extent, mono-HAcAms. The immobilization of Daphnia magna (D. magna) increased with the increasing exposure concentration of water extracts during a 48 h period. The immobilization of D. magna exposed to water treated by recycling SFBW at a recycling rate below 20% was nearly equivalent to that without a recycling process. When the recycling rate was more than 20%, there was a significant increase in the superoxide dismutase (SOD) activity of D. magna, whereas a significant inhibition observed in the catalase (CAT) activity, which reflected a damaged defense chain caused by the toxic substances including chlorinated and nitrogenous disinfection by-products such as DCAcAm. When the recycling rate was more than 20%, there was a statistically significant difference (p > 0.05) between the recycling rate of SFBW and the toxicity effect of water sample extracts during the recycling trial. It was also identified that the main precursors of DCAcAm were hydrophilic and low molecular weight fractions of dissolved organic nitrogen.
1. Introduction

The United States Environmental Protection Agency promulgated a Filter Backwash Recycle Rule in June 2001 in response to concerns about recycling the drinking water treatment plant (DWTP) waste residuals in the water treatment process. The rule stated that there is evidence that the recycling compromises the treatment efficacy and provides strategies for water conservation.1 Because the sand filter backwash water (SFBW) comprises a large portion of the DWTP's output, which contains up to 3–8% of the DWTP's total water production, it has become increasingly popular to recycle the waste residuals.2 Some previous studies have explored the removal efficiency of organics, Giardia cysts and Cryptosporidium oocysts, and some routinely determined parameters to evaluate the water quality safety after recycling of filter backwash water, which has reported both benefits and problems caused by adding recycled untreated filter backwash water before the coagulation process.1,3–5 These reports have suggested that there may be optimum operating and water quality conditions for minimizing potential adverse effects associated with SFBW recycling. Some toxic substances may pose a potential threat to human health under a long exposure long time, owing to waste residual pollution from SFBW water.6

SFBW is typically characterized by higher dissolved organic nitrogen (DON) level, where amino acids constitute an important class, accounting for from 15% to 35% composition of the total DON pool.7 Richardson et al.8 has found that during chlorination or chloramination, the components of DON in water could react with the disinfectant to form halogenated nitrogenous disinfection by-products (N-DBPs), such as haloacetamides (HAcAms), halonitromethanes (HNMs) and haloacetonitriles (HANs), which represent an emerging concern due to their cytotoxicity and genotoxicity.9–11 It is therefore essential to focus on the variation of DON concentration and its nitrogenous disinfection by-products potential in the drinking water treatment process associated with directly recycling untreated filter backwash water before the coagulation. However, there are few reports on the risk evaluation of nitrogenous disinfection by-products potential due to the direct SFBW recycling, which is gradually utilized in the waterworks in China. Haloacetamides (HAcAms), an emerging class of halogenated N-DBPs firstly quantified in 2002, have exhibited much higher cytotoxicity and genotoxicity than many C-DBPs (e.g., THMs) and other N-DBPs (e.g., HANs).12 Di-haloacetamides (DCAcAm) as a typical HAcAms is found to cause significantly chronic cytotoxicity and acute genotoxicity.13–16

A toxicity evaluation for the recycling process is a useful tool to determine the comprehensive risk. Daphnia magna (D. magna), a sensitive organism widely used in aquatic risk assessment,17,19 was tested in toxicity assay to evaluate the toxicity of water samples treated by the coagulation–sedimentation–filtration associated with directly recycling SFBW, comparing that without recycling process has indicated that a lower dose of water extract could stimulate the enzyme activity of D. magna, whereas a higher dose inhibited its activity.1,18,19 Therefore, the important antioxidant enzymes, such as the superoxide dismutase (SOD), the catalase (CAT) and glutathione peroxidase (GPX), were used to evaluate the effects of extracts from water samples on the antioxidant enzymes activities of D. magna.

This study focused on combining physico-chemical analysis with a D. magna bioassay to investigate the water quality variations in water treatment process with SFBW recycling. A bench-scale experiment of coagulation–sedimentation–filtration was performed in the 7 day continuous recycling trials, where the characteristics of DON as DCAcAm precursor was investigated and the toxicity of water sample extracts were assessed by the immobilization, SOD and CAT activity assays of D. magna.

2. Materials and methods

2.1. Materials

The Amberlite XAD-2 resin, dimethylsulfoxide (DMSO) and trihalomethanes (THMs) calibration mix standard solution were purchased from Sigma (USA). The polyaluminium chloride (PACl) was industrial grade (content 10.57% Al2O3, the basicity is 76.58%, density 1.249 g mL−1, Wuxi, China). Tyrosine (98.5%) was obtained from Wako (Osaka, Japan). Guaranteed reagent (GR) grade reagents-sodium hypochlorite (5% NaOCl), sodium bicarbonate (NaHCO3), hydrochloric acid (HCl) were purchased from Sinopharm Chemical Reagent Co., Ltd. (Shanghai, China). The following chemicals were analytical grade and from China: methanol (≥99.6%; Jingdong, Tianjing), dichloromethane (≥99.5%; Baiyi, Jining), hexane (≥97; Bangyi, Hangzhou), acetone (≥99%, Kemiou, Tianjing). CAcAm (≥99%), DCAcAm (≥98.5%) and TCAcAm (≥99%) were obtained from Alfa Aesar (Karlsruhe, Germany). All solutions were prepared using ultrapure water produced with a Millipore Milli-Q Gradient water purification system (Billerica, Massachusetts, USA). Chlorine solutions were prepared by diluting a 5% NaOCl solution with ultrapure water, which was standardized daily prior to use. The solutions of DON were prepared as 3 mg N L−1 with tyrosine using ultrapure water.

2.2. Water sample collection

Raw water (Taihu Lake source water) and sand filters backwash water (SFBW) samples were obtained from a DWTP in Wuxi, China. The sand filters are backwashed every 24 hours with approximately 1200 m3 of water. The raw water was characterized by low DOC concentration and turbidity, with slightly elevated levels of UV254, as presented in Table 1. The conventional treatment process consists of flocculation, sedimentation and sand filtration and a simulated bench-scale experiment was performed in this study. The SFBW was directly mixed with raw water prior to bench-scale experiment, where a Jar-test unit was used to simulate the process of coagulation combined with sedimentation, and then the effluent was filtered through a sand filter column.
Table 1 Raw water and sand filter backwash water (SFBW) characteristics
Analyte Units Raw water SFBW
Range Average Range Average
a TN: total nitrogen; SUVA: specific UV254 absorbance; DON: dissolved organic nitrogen.
Temperature °C 12–28 20 12–28 20
pH 6.5–8.2 7.5 6.2–8.2 7.2
Turbidity NTU 2–4 3 5–10 7.5
Solid content (w%/w%) 0.001–0.004 0.002 0.05–0.8 0.35
UV254 cm−1 0.0032–0.0045 0.0036 0.0035–0.005 0.004
DOC mg L−1 2.2–3.0 2.55 3.0–4.2 4.5
CODMn mg L−1 1.8–2.5 2.15 2.1–3.2 2.2
SUVAa mg L−1 m−1 1.17–2.05 1.65 0.83–1.67 1.25
TNa mg L−1 2.2–3 2.75 2.9–4.2 3.45
NH4+–N mg L−1 0.1–0.6 0.45 0.3–0.9 0.78
NO3–N mg L−1 1.8–2.2 2.0 2.1–2.8 2.75
Zeta potential mV −11.5 to −16.6 −13.5 −5.8 to +7.9 +1.45
DONa mg L−1 0.2–0.4 0.3 0.3–0.6 0.45
DOC/DON 5.5–15 8.7 5–14 10
THMFPs μg L−1 100–240 170 260–380 320
DCAcAmFP μg L−1 1.2–3.1 2.05 3.5–5.4 3.95


2.3. Bench-scale recycling experiments

Raw water and SFBW were sampled from the facilities in the waterworks in summer. SFBW was mixed with the raw water at following recycling rate: 0, 5%, 10%, 15%, 20%, 25% and 30%, and then the mixed water was added to a bench-scale apparatus to simulate the coagulation–sedimentation–filtration recycling process. The bench-scale experiments were performed using a programmable jar testing apparatus (Zhong-Run Jar Test Instruments, China). Jar tests were conducted in duplicates for a total of three samples analyses (n = 3) per trial. The predetermined dosage of 20 mg L−1 PACl was added to the mixed water using a graduated syringes and the water sample was stirred simultaneously 10 min at 300 rpm, subsequently 1 min slow stir at 120 rpm, 15 min flocculation at 50 rpm, and 30 min settling. Then the effluent of sedimentation was transferred to the sand filter column with a filtration rate of 8 m h−1 and 10 min filtration. Finally, the water sample collected from the effluent of sand filter column was analyzed by physical-chemical analysis and toxicity assay.

2.4. Chlorination of water samples and HAcAms formation potentials

The HAcAms formation potentials (HAcAmsFPs) were determined according to the reported methods,20,21 using chlorinated waters prepared by diluting a 5% NaOCl solution with ultrapure water. The desired residual chlorine concentration was 0.5 mg L−1. During the HAcAmFPs tests, the water samples were chlorinated in 2000 mL amber glass volumetric flasks at a controlled room temperature (23.0 ± 0.2 °C) in the dark for 24 h. The sample was buffered at pH value of 7.5 with NaHCO3 buffer. The disinfectant dosages for formation potential tests were calculated by eqn (1).
 
Cl2 dosage (mg L−1) = 3 × DOC (mg L−1) + 7.6 × NH3 (mg N L−1) + 10 (mg L−1) (1)

Prior to HAcAms analysis, each 1500 mL water sample was stored at pH 5 ± 0.5 to prevent the hydrolysis of HAcAms and was split into three 500 mL glass bottles (triplicate). In the analysis of three species of HAcAms, a simultaneous determination method, combining SPE enrichment, HPLC separation, and MS detection with APCI, using SRM in the positive mode, was developed. The intra-day and inter-day RSDs (n = 5) for each HAcAm were generally lower than 10%. The details of the HAcAms analysis are presented elsewhere.22,23

2.5. Fractionation procedure of DOC or DON

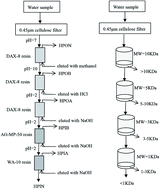
2.5.1. Hydrophobic and hydrophilic fractionation procedure of DOC or DON. Dissolved organic matters or nitrogenous compounds were isolated and concentrated from water samples by a sequentially extraction method using three types of adsorbents, i.e. nonionic DAX-8 (SUPELCO) resin, a cationic exchange AG-MP-50 (Bio-Rad) resin and a weak anionic WA-10 (SUPELCO) resin24 (Kanokkantapong et al., 2006). Dissolved organic nitrogenous materials eluted from these three resins are: hydrophobic neutral (HPON), hydrophobic base (HPOB), hydrophobic acid (HPOA), hydrophilic base (HPIB), hydrophilic acid (HPIA), and hydrophilic neutral (HPIN), as mentioned in previous report,25 as shown in Fig. 1. All fractionations eluted from resins were subjected to the chlorination by NaClO solution according to the ref. 22 to determine the concentration of dichloroacetamide (DCAcAm) generated. The above-mentioned fractionation was measured DOC, TDN, NO3, NO2, NH4+, and then DON concentration was calculated by the difference of TDN and DIN (as shown in eqn (2)).
 
DON = TDN − NO3 − NO2 − NH4+ (2)

image file: c6ra14912j-f1.tif
Fig. 1 Fractionation procedure of DON.
2.5.2. Molecular weight fractionation procedure of DOC or DON. Water samples were fractionated using two 400 mL commercial stirred cell units (Amicon8400, Millipore, Corp., MA) in parallel. Four types of regenerated cellulose membranes were used: (1) YM1, which has a nominal molecular weight cut-off = 1000 Da, (2) YM3, which has a nominal molecular weight cut-off = 3000 Da, (3) YM5, which has a nominal molecular weight cut-off = 5000 Da and (4) YM10, which has a nominal molecular weight cut-off = 10[thin space (1/6-em)]000 Da. The initial sample volume was 500 mL, which was filtrated through the cellulose membrane in sequence (as shown in Fig. 1). The composition of DOC or DON in molecular weight range was calculated as following eqn (3).
 
image file: c6ra14912j-t1.tif(3)
where Ci is the measured parameter of fraction i. In all samples tested, mass balances for DOC or DON before and after molecular weight fractionation were within ±10%.

All fractionations eluted from resins were subjected to the chlorination by NaClO solutions to determine the concentration of DCAcAm generated.

2.6. Toxicity bioassay

2.6.1. Water sample extraction and concentration. The 2 L water samples were taken from sand filter column, immediately acidified with hydrochloric acid to pH = 2, and then chlorinated with solution sodium hypochlorite for 24 hours. The excessive sodium thiosulfate was added to eliminate residual chlorine. Finally, water samples were concentrated using an Amberlite XAD-2 resin (Sigma) column at a filtration rate of 10–20 mL min−1. The resins were pre-treated by consecutive 2 h Soxhlet extractions with methanol, dichloromethane, hexane and acetone, and then stored in methanol at 4 °C prior to use. The elution of the adsorbed organics from the resin column was performed with 350 mL of hexane and acetone (hexane[thin space (1/6-em)]:[thin space (1/6-em)]acetone = 17[thin space (1/6-em)]:[thin space (1/6-em)]3) and 560 mL of dichloromethane.1 The extracts were evaporated to dryness with a rotary vacuum evaporator and then dissolved in 2 mL dimethylsulfoxide (DMSO) of 0.025%, finally stored at 20 °C until a bioassay test. The extract concentrations were expressed as to 1 L of water per 0.5 mL of DMSO.26,27
2.6.2. Toxicity immobilization tests. To minimize the variability in the measured biochemical parameters, D. magna specimens were obtained from Model Animal Research Center of Nanjing University. D. magna were cultured at 22 ± 1 °C with a 16[thin space (1/6-em)]:[thin space (1/6-em)]8 light[thin space (1/6-em)]:[thin space (1/6-em)]dark photoperiod in an illumination incubator.1 Those samples were placed into 500 mL glass breakers and fed daily with Scenedesmus subspicatus (corresponding to 2 mg C L−1). The culture densities were kept below 20 animals/500 mL. The dechlorinated tap water was used as the culture medium, which was changed every other day, and the offspring was removed within 24 h. In this study, D. magna neonates (<24 h) were used for the immobilization test and the juveniles (4–5 days old) were used for the enzyme activity test. No food was provided during the tests.28,29

Immobilization tests were employed to investigate the effects of different water sample extracts concentrations on the immobilization of D. magna. The 48 h static acute toxicity tests were conducted according to the Organization for Economic Cooperation and Development (OECD) standard procedures (OECD, 2004). D. magna neonates born from parthenogenetic females were randomly selected and used in this test. The concentrations of water extracts, 0.5, 1, 1.5, 2 L eq. mL−1, were studied in this research. Triplicate samples of each water extract and the DMSO (0.025%) control were prepared in 10 mL glass beakers, and 20 newly born D. magna neonates (<24 h old) were placed in each beaker. The toxicity end-point (EC50) was determined as the concentration of a different water sample that causes a 50% immobilization of D. magna. The immobilization of D. magna was monitored during 48 h of static exposure. The immobility was considered to have occurred if no movement was detected for 15 s after gentle shaking with glass rods. The number of living and dead neonates in each beaker was counted.17,30

2.6.3. Enzyme activity, superoxide dismutase (SOD) and catalase (CAT) assays. For the determination of SOD and CAT activity, triplicate samples of each water extract (0.5, 1, 1.5 or 2 L eq. per mL extract) and the DMSO (0.025%) control were prepared in 10 mL glass beakers, and 20 newly born D. magna juveniles (4–5 days old) were placed in each beaker. After 48 h of exposure, D. magna was transported to a 2 mL centrifuge tube on ice containing 1.5 mL 0.05 M Tris–HCl buffer with a pH value of 8.2. Then, the organisms were placed in an ultrasonic tissue destructor (Sonics Uibra Cell VCX105) on ice to obtain homogenates, followed by centrifuging at 10[thin space (1/6-em)]000 rpm for 20 min at 4 °C. The supernatant was used for the enzymatic assay. The SOD activity was measured using the reagent kit (Nanjing Jiancheng Bioengineering Institute, China). The SOD activity was determined using colorimetric methods with a spectrophotometer at 550 nm. The results of this enzymatic assay were given in units of SOD activity per milligram of protein (U per mg protein), and the protein contents were determined using the modified method of Lowry et al.31. The CAT activity was measured according to the method described by Claiborne.42 The results of enzymatic assay were given in units of CAT activity per milligram of protein (U per mg protein).32,33

2.7. Analytical methods

The water sample was filtrated through a pre-rinsed 0.45 μm cellulose filter (Cole-Parmer Nylon Membranes) to remove particles. DOC concentration was determined using a TOC-VCHP analyzer (Shimadzu Corporation, Kyoto, Japan). UV254 absorbance was measured using an HACH DR/4000 UV/VIS spectrophotometer (Hach Company, Loveland, CO) at a wavelength of 254 nm. The pH value was measured using a pH meter (PHS-3C, Leici Company, China). Measurements of three-dimensional EEM spectra were performed at room temperature (2–5 °C) using a fluorescence spectrophotometer with a xenon lamp light source (F-7000, Hitachi, Japan). The scanning rate for all samples was set to 1200 nm min−1. Excitation emission matrix plots were generated from fluorescence spectral data using the Surfer 8.01 software (Golden Software, Inc., 2002, Golden, CO). Electrophoretic mobility was measured using a CAD Zeta meter (Laval Lab Inc., Laval, Quebec) and these measurements were converted to zeta potentials (ZPs) using the Smoluchowski equation. THMs analysis was conducted according to U.S.EPA Method 551.

2.8. Statistical analysis

Statistical analysis was performed using SPSS 11.5. Results were expressed as mean ± standard deviation (SD). The differences of SOD and CAT activity were analyzed by one-way ANOVA, taking p < 0.05 as a significant difference.

3. Results and discussion

3.1. Water quality analysis of raw water and SFBW

A summary of the water quality analysis on the raw water and SFBW collected from the treatment facilities is presented in Table 1. The source waters had a moderate level of organic carbon concentration that was primarily in the dissolved fractions. The low value of DOC/DON in raw water was close to that of SFBW, which was characterized by more autochthonous nitrogenous organic matters rich in water sample. The specific UV254 absorbance (SUVA) of the source water was calculated to be 1.65 mg L−1 m−1, indicating that the raw water comprises dissolved organic compounds primarily with hydrophilic and low molecular weight species. The experimental result of dissolved organic nitrogen fractionation was in line with characteristics of dissolved organic carbon revealed by SUVA values of raw water and SFBW (Fig. S1 and S2). The low SUVA value of source waters and SFBW indicated a low removal efficiency of NOM in conventional water treatment process. Besides, the contour maps of EEMs also testified the existing low molecular weight protein-like compounds in raw water and SFBW (Fig. S3). It can be seen that the EEM spectra of tyrosine are characterized by a peak at Ex/Em = 235/350 nm (peak T). Previous studies have confirmed that tryptophan or tyrosine are the main precursors of nitrogenous disinfection by-products.22 Some researchers have suggested that the source water of Taihu Lake contained DON components, having more reactive in forming HAcAms than other source water.23,34

3.2. Recycle trials of sand filters backwash water

As presented in Fig. 2, the effluent organic carbon concentrations as quantified by DOC, CODMn and UV254 measurements were not negatively impacted with the SFBW recycling at rates of 5–20%. As presented in Fig. 3, the nitrogenous matter concentrations as quantified by TDN, NO3, NO2 and NH4+ measurements were not significantly impacted with the SFBW recycling at rates of 5–20%. Most of the values were lower or slightly higher than that without SFBW recycling process, and all evaluated indexes met the Drinking Water Sanitary Standard of China (GB5749-2006). When the recycling rate was more than 20%, there was a significant increase in the concentrations of DOC and DON. During the subsequent chlorination or chloramination, the components of DON in water could react with the disinfectant to form halogenated nitrogenous disinfection by-products (N-DBPs).8 For the low-turbidity source water evaluated in this study, the improved sedimentation performance in terms of DOC removal could be attained due to the increased number of particles introduced with the SFBW recycle stream. An increase in the number of collision sites for soluble NOM constituents, no being undergone coagulation–sedimentation–filtration process, with the destabilized SFBW particles could be responsible for the improvements in DOC removal. However, as shown in Table 2, when the recycling rate was more than 20%, the values of THMFPs and HAcAmsFPs in the recycling process were dramatically higher than that in the control trial without the SFBW recycling. The SFBW recycling at rates of 5–20% could be therefore used safely to conserve the available resources and decrease the costs in the actual process.
image file: c6ra14912j-f2.tif
Fig. 2 The variations of DOC, CODMn and UV254 in the effluent water treated by the bench-scale coagulation–sedimentation–filtration at different recycling rate of SFBW.

image file: c6ra14912j-f3.tif
Fig. 3 The variations of nitrogenous matters in the effluent water treated by the bench-scale coagulation–sedimentation–filtration at different recycling rate of SFBW.
Table 2 Chlorine disinfection by-products formation potentials of three HAcAms and THMFPsa,b
Water samples HAcAms (ng L−1) THMFPs (μg L−1)
Mono-HAcAms Di-HAcAms Tri-HAcAms
CAcAm DCAcAm TCAcAm
a The presented values in the table were averages of three observations. The relative standard deviation of replicate measurements (n = 3) for each HAcAm was all below 10%.b ()*: data ref. 23.
Raw water 73 (65)* 6425 (7130)* 1610 (1571)* 312.46
Recycling rate 0% 42 1380 448 168.55
5% 48 1910 566 234.16
10% 53 2831 714 279.63
15% 66 3675 1045 307.24
20% 78 5780 1250 457.72
25% 76 6472 1580 483.88
30% 80 7210 1632 506.11


The formation potentials of three HAcAms in the raw waters and recycling water sample due to chlorination are presented in Table 2. Di-HAcAms were the most abundant species of HAcAms formed during chlorination. It could be found that di-HAcAms (DCAcAm) accounted for the majority of HAcAms formed during chlorination, followed by tri-HAcAms and mono-HAcAms. This indicates that the HAcAms precursors in raw and recycling waters more easily form di-HAcAms. Previous study has proposed that seven of the 20 basic amino acids may form DCAcAm by initial substitution, elimination, and decarboxylation reactions, and further substitution reaction.23,34 Theoretically, the hydrogen atom in the intermediate product (R–CH2–CN) can be replaced by only one halogen and it is more likely to replace both of the two hydrogen atoms since chlorine are much adequate, as shown in Fig. S4.22 It is advocated to decrease the formation potential of disinfection by-products, especial nitrogenous matters like DCAcAm, as much as possible for the security of product water. DCAcAm is difficult to be removed from treated waters and research efforts have consequently focused on identifying methods to destroy and/or remove DCAcAm precursors.

3.3. Effect of water extracts concentration on the immobilization of D. magna

The water samples collected from sand filter column were evaluated by the immobilization of D. magna, and the results are shown in Fig. 4. The immobilization of D. magna increased with its exposure to increased water extracts concentration during a 48 h period. The high extract concentration exerted influence on the livability of D. magna. The immobilization of D. magna was less than 50% in the concentration range of 0 (DMSO) – 1 L eq. mL−1 at recycling rates of 0–30%, whereas it exceeded 50% in the presence of 1.5 and 2 L eq. per mL extract concentration even the recycling rate less than 15%. At the same extract concentration, the immobilization of D. magna exposed to water extracts from the water treated at 7th day was more than that at 0th day, suggesting that with the increase of recycling period, some harmful substances could accumulate in water treatment process. This result is similar to that research results by Chen.1
image file: c6ra14912j-f4.tif
Fig. 4 Immobilization comparison of D. magna exposed to different water extracts at different recycling rate between the trial on the 0th and 7th day.

The EC50 values obtained for D. magna exposed to the treated water at different recycling rate of SFBW are shown in Table 3, which also lists the correlation coefficient of immobilization versus different water extracts for the measurements. It could be found that the EC50 values declined with the increasing duration of exposure (0th and 7th day for D. magna) and recycling rate of SFBW (from 0% to 30%) in all water extracts. This indicated that an increase of recycling period could make some harmful substances accumulate in water treatment process.

Table 3 EC50 values (L eq. mL−1) for D. magna at different recycling rate of SFBW in different recycling perioda
Recycling rate% EC50 (L eq. mL−1) the 0th day EC50 (L eq. mL−1) the 7th day
a R2 is the correlation coefficient of immobilization vs. water extracts.
0 2.17 (R2 = 0.9454) 1.76 (R2 = 0.9766)
5 1.98 (R2 = 0.9704) 1.68 (R2 = 0.9724)
10 1.80 (R2 = 0.9850) 1.57 (R2 = 0.9561)
15 1.80 (R2 = 0.9347) 1.47 (R2 = 0.9886)
20 1.74 (R2 = 0.9715) 1.48 (R2 = 0.9750)
25 1.60 (R2 = 0.9832) 1.35 (R2 = 0.9976)
30 1.43 (R2 = 0.9878) 1.28 (R2 = 0.9893)


3.4. Effect of water extract concentration on the SOD and CAT activity of D. magna

The SOD and CAT activities are important antioxidant enzyme systems in invertebrate species, which were widely used as indicators for the toxicity of pollutants to organisms. To a certain extent, antioxidant enzyme activity represents the presence of toxic compounds in water.1 SOD is an important anti-oxidant enzyme, which catalyzes the dismutation of free superoxide anion radicals into hydrogen peroxide.35 CAT as a primary antioxidant defense components is responsible for catalyzing the decomposition of H2O2–H2O.14,36 In our research, the water samples were evaluated by SOD and CAT activity of D. magna, and the results are shown in Tables 4 and 5. There was an obvious dose–response effect between the enzyme activity (SOD and CAT) and water extract concentration, and all water samples showed significant differences (p < 0.05) in comparison to the blank control.
Table 4 The SOD activity assay for D. magna exposed to water sampled in bench-scale treatment at different recycling ratea
Control trials Water sample SOD activity (U per mg protein)
Concentration (L eq. mL−1)
0.5 1 1.5 2
a Statistical analysis was performed using Student's t-test after an ANOVA for SOD activity. The values are the means ± SD. “*” indicating a significant difference from control values (p < 0.05).
The 0th day DMSO 16.23 ± 1.01 16.23 ± 1.00 16.23 ± 1.01 16.23 ± 1.02
0% 48.37* ± 1.22 76.42* ± 2.31 87.39* ± 2.38 116.56* ± 3.07
5% 49.13 ± 1.24 77.25 ± 2.04 88.73 ± 2.14 117.78 ± 2.91
10% 50.71 ± 1.06 78.88* ± 1.91 89.33* ± 2.07 118.56* ± 2.56
15% 52.37* ± 1.22 79.81* ± 2.01 91.45* ± 2.12 110.92* ± 2.47
20% 56.09* ± 1.23 82.48* ± 1.79 95.24* ± 2.15 122.43* ± 2.83
25% 61.13* ± 1.17 87.35* ± 1.97 100.33* ± 2.06 126.29* ± 2.37
30% 67.38* ± 1.25 93.47* ± 1.87 106.27* ± 2.13 132.46* ± 2.75
The 7th day 0% 50.08* ± 1.32 78.84* ± 2.23 88.02* ± 2.31 119.37* ± 3.01
5% 51.26 ± 1.31 79.13 ± 2.02 90.25 ± 2.18 120.32 ± 2.97
10% 53.47* ± 1.27 81.23 ± 1.96 92.33* ± 2.05 122.45* ± 3.00
15% 56.58* ± 1.33 84.43* ± 2.04 96.18* ± 2.11 125.66* ± 3.02
20% 60.73* ± 1.24 88.82* ± 1.51 101.74 ± 1.88 129.25* ± 2.61
25% 65.09* ± 1.08 93.48* ± 1.92 104.38* ± 2.05 133.46* ± 2.46
30% 72.15* ± 1.13 99.45* ± 1.87 100.21* ± 2.03 139.43* ± 2.39


Table 5 The CAT activity assay for D. magna exposed to water sampled in bench-scale treatment at different recycling ratea
Control trials Water sample CAT activity (U per mg protein)
Concentration (L eq. mL−1)
0.5 1 1.5 2
a Statistical analysis was performed using Student's t-test after an ANOVA for SOD activity. The values are the means ± SD. “*” indicating a significant difference from control values (p < 0.05).
  DMSO 15.46 ± 1.04 15.46 ± 1.01 15.46 ± 1.02 15.46 ± 1.02
0% 119.37* ± 1.28 138.55* ± 2.12 182.68* ± 2.33 218.56* ± 2.86
5% 118.23 ± 1.08 137.25 ± 1.95 181.36 ± 2.03 217.45 ± 2.37
10% 117.55 ± 1.03 136.43* ± 1.83 180.28 ± 1.69 216.17* ± 1.34
The 0th day 15% 115.42* ± 1.16 134.82 ± 1.64 178.37* ± 1.48 214.33* ± 1.25
20% 111.20* ± 1.24 130.36* ± 1.72 174.29* ± 1.76 210.91* ± 1.51
25% 106.08* ± 1.22 125.82* ± 1.95 169.78* ± 1.84 205.53* ± 1.79
30% 100.46* ± 1.47 120.66* ± 1.78 183.23* ± 1.91 199.41* ± 2.16
The 7th day 0% 117.21* ± 1.37 136.28* ± 1.92 180.35* ± 2.06 216.37 ± 1.78
5% 116.33 ± 1.29 135.23 ± 1.57 179.44 ± 1.66 215.58* ± 1.94
10% 114.71 ± 1.49 133.76* ± 1.69 177.39 ± 1.82 213.48* ± 1.78
15% 111.18* ± 1.27 130.66* ± 1.58 174.24* ± 1.73 210.37* ± 1.59
20% 107.33* ± 1.46 126.52* ± 1.62 170.50* ± 1.61 206.32* ± 1.71
25% 102.17* ± 1.32 121.57* ± 1.66 166.91* ± 1.35 201.13* ± 1.86
30% 97.55* ± 1.42 116.27* ± 1.74 160.22* ± 1.85 198.37* ± 2.16


As present in Tables 4 and 5, the SOD and CAT activities of D. magna showed a opposite varying pattern. When the SFBW recycling rate was less than 15%, SOD activity of D. magna increased slowly with the increasing recycling rate, whereas the CAT activity had a slightly decrease. This experimental phenomena showed that with the increase of recycle ratio, toxic substances in the treated water increased very slightly, won't appear water quality safety problems at recycling rate below 15%. When the SFBW recycling rate was more than 15%, the SOD activity of D. magna increased significantly (approximate 40%), indicating an increased production of superoxide anions and H2O2 in D. magna. In general, these powerful and potentially harmful oxidizing agents could be metabolized by CAT into harmless agents, including H2O and O2.14,37 However, the CAT activities were inhibited in this study, which reflected a damaged defense chain caused by the highly toxic substances including HCAcAms. The SOD of D. magna exposed to water extracts at 7th day exceeded that at 0th day. It further suggested that the toxic substances accumulated in the treated water with the increase of recycling period, which is in agreement with other research results.38,39

3.5. Correlation of enzyme activity and DON concentration

As shown in Tables 4 and 5, a low dose of water extracts could stimulate the SOD activity of D. magna, whereas a high dose would inhibit the CAT activity. However, it is unknown what concentrations of these organic compounds are responsible for the immobilization of SOD and CAT activity. Thus, a further research is required to testify the effect of concentration of organics on immobilization, SOD and CAT activity. Chen1 has studied the correlation between DOC, UV254 and SOD, CAT activity of D. magna, indicating that the enzyme activity of D. magna along with DOC and UV254 demonstrates a strong concentration–effect relationship.

During chlorination, the components of the DON in water could react with the disinfectant to form halogenated nitrogenous disinfection by-products (N-DBPs), which is less investigated in previous study. Therefore, it is essential to explore the effect of DON concentration on the immobilization of SOD and CAT activity due to the formation potential of N-DBPs during chlorination. In this research, the different concentrations (0–3 mg N L−1, increment = 0.2 mg N L−1) of DON solution prepared by the ultrapure water mixed with tyrosine, which was selected as a representative of DON due to its popular occurrence in both the raw water and sand filter backwash water. The chlorination experiments were carried out according to the procedure in Section of 2.4. The different concentrations of water extracts (0.5, 0.75, 1, 1.25, 1.5, 1.75, 2, 2.25, 2.5, 2.75 and 3 L eq. mL−1) were carried out according to the method described in Section of 2.6.1.

As shown in Fig. 5, the enzyme activity of SOD initially increased and then declined to a plateau as the immobilization increased. The enzyme activity of CAT demonstrated a similar trend along with immobilization. Specifically, the enzyme activity of SOD could be up to 60 U per mg protein at the immobilization below 50%, and it began to fall after the immobilization reached 50–70%. The enzyme activity of CAT was apparently higher than that of SOD. The highest enzyme activity of CAT appeared near 50% immobilization and then reduced significantly.


image file: c6ra14912j-f5.tif
Fig. 5 Relationship between enzyme activity and immobilization of D. magna.

As the concentration of DON increased in the range of 0–3 mg L−1, the SOD and CAD activity increased as well (as present in Fig. 6). This demonstrates a strong concentration–effect relationship between DON as precursors of N-DBPs in chlorination and the enzyme activity of D. magna. As shown in Fig. 6, there was a strong linear correlation between DON concentration as precursors of N-DBPs and SOD or CAT (R2 = 0.933 and 0.871, respectively). This result further testifies that the increasing concentrations of DON in treated water are responsible for the immobilization of SOD and CAT activity due to the increasing toxicity of N-DBPs during chlorination. Therefore, it is essential to focus on the characteristics of N-DBPs precursors relevant with DON.


image file: c6ra14912j-f6.tif
Fig. 6 Relationship between enzyme activity and DON concentration as precursors of N-DBPs due to chlorination.

3.6. The precursors of THMs and DCAcAm

According to the above results in Section 3.2., DCAcAm was the most abundant species in the formation potentials of N-DBPs. Therefore, DCAcAm as representative of N-DBPs and THMs as representative of C-DBPs were selected in the investigations on precursors of disinfection by-products. In order to determine the main precursors of disinfection by-products, organic matter or organic nitrogen of SFBW was separated into different fractions through resins or the molecular weight cut-off membrane. The contribution of each fraction for the formation potentials of THMs and DCAcAm is present in Tables 6 and 7.
Table 6 Characteristics of SFBW organic fractions and its disinfection by-products
  DON (mg L−1) DOC (mg L−1) DON/DOC (—) THMFPs (μg L−1) DCAcAmFP (μg L−1)
SFBW 0.42 3.46 0.12 315 3.65
HPOA 0.1 0.89 0.11 70 0.25
HPOB 0.02 0.19 0.11 26 0.28
HPON 0.04 0.36 0.11 42 0.36
HPIA 0.07 0.52 0.13 56 0.96
HPIB 0.03 0.26 0.12 29 0.62
HPIN 0.16 1.24 0.13 92 1.18


Table 7 Characteristics of SFBW organic fractions and its disinfection by-products
  DON (mg L−1) DOC (mg L−1) DON/DOC (—) THMFPs (μg L−1) DCAcAmFP (μg L−1)
SFBW 0.42 3.46 0.12 315 3.65
<1k Da 0.16 1.25 0.13 83 1.24
1–3k Da 0.11 0.92 0.12 86 1
3–5k Da 0.03 0.28 0.11 50 0.42
5–10k Da 0.03 0.27 0.11 36 0.44
>10k Da 0.09 0.74 0.12 60 0.55


As shown in Table 6, the main contributors for THMFPs were hydrophilic neutral (HPIN) and hydrophobic acid (HPOA) fractions, which are mainly humic or fulvic acids of natural organic matters. This is consistent with previous reports.41 However, for DCAcAm formation potentials, hydrophilic neutral (HPIN) and hydrophilic acid (HPIA) were the main contributors, suggesting that the characteristics of the DON, and not simply the concentration of DON, influenced the formation of DCAcAm. These contributors are mainly involved with proteins, amino acids, organic amine-like DON.23,40 As shown in Table 7, the fractions with molecular weight <3k Da had a higher contribution for the formation potentials of both THMFPs and DCAcAm. In all, a higher DON/DOC ratio in the different fractions of SFBW led to a higher DCAcAmFPs. These observations suggest that the major precursors of DCAcAm are probably the autochthonous DOM associated with SMPs, proteins and amino acids. DCAcAm were significantly produced in the chlorinated water from the effluent of process with recycling SFBW, containing autochthonous organic matters.7,16 Therefore, the reduction of autochthonous nitrogenous organic matters may be a strategy to prevent the formation of certain N-DBP types of DCAcAm.

4. Conclusions

The purification efficiency and water quality evaluation were investigated in a DWTP with a direct recycling of SFBW at recycling rates of 0–30%. The concentrations of DOM, DON and the formation potentials of carbonated or nitrogenous disinfection by-products did not obviously increase or were even lower than typical values without recycling when the recycling rate of SFBW was less than 20%. When the recycling rate was higher than 20%, there was a statistically significant difference (p > 0.05) between the recycling rate of SFBW and the toxicity effect of water sample extracts on D. magna, which was mainly suffered from a damaged defense caused by chlorinated and nitrogenous disinfection by-products. The DCAcAm accounted for the majority of HAcAms formed in chlorinated water. The main precursors of DCAcAm were hydrophilic and low molecules weight fractions of dissolved organic nitrogen.

Abbreviations

D. magnaDaphnia magna
SFBWSand filters backwash water
DCAcAmDi-haloacetamides
HAcAmsHaloacetamides
SODSuperoxide dismutase
THMsTrihalomethanes
TCAcAmTri-haloacetamides

Acknowledgements

Financial support was received from the National Natural Science Foundation of China (Project 51438006), Fundamental Research Funds for the Central Universities (Project 2014B07714), the funds sponsored by the Qing Lan Project and A Project Funded by the Priority Academic Program Development of Jiangsu Higher Education Institutions.

References

  1. T. Chen and Y. P. Xu, et al., Combining physico-chemical analysis with a Daphnia magna bioassay to evaluate a recycling technology for drinking water treatment plant waste residuals, Ecotoxicol. Environ. Saf., 2015, 122, 368–376 CrossRef CAS PubMed.
  2. W. Walaszek and P. Ay, Porosity and interior structure analysis of pellet-flocs, Colloids Surf., A, 2006, 280, 155–162 CrossRef CAS.
  3. J. Cristale, A. García Vázquez, C. Barata and S. Lacorte, Priority and emerging flame retardants in rivers: occurrence in water and sediment, Daphnia magna toxicity and risk assessment, Environ. Int., 2013, 59, 232–243 CrossRef CAS PubMed.
  4. A. Gottfried, A. D. Shepard, K. Hardiman and M. E. Walsh, Impact of recycling filter backwash water on organic removal in coagulation–sedimentation processes, Water Res., 2008, 4683–4691 CrossRef CAS PubMed.
  5. M. E. Walsh and G. A. Gagnon, Blending membrane treated WTP waste residuals with finished water: impacts to water quality and biofilm formation, J. Water Supply: Res. Technol.--AQUA, 2006, 55(5), 321–334 CrossRef CAS.
  6. A. Buschini, et al., Cytotoxic and genotoxic potential of drinking water: a comparison between two different concentration methods, Water Res., 2008, 42, 1999–2006 CrossRef CAS PubMed.
  7. P. Westerhoff and H. Mash, Dissolved organic nitrogen in drinking water supplies: a review, J. Water Supply: Res. Technol.--AQUA, 2002, 51, 415–448 CAS.
  8. S. D. Richardson, M. J. Plewa, E. D. Wagner, R. Schoeny and D. M. DeMarini, Occurrence, genotoxicity, and carcinogenicity of regulated and emerging disinfection by-products in drinking water: a review and roadmap for research, Mutat. Res., 2007, 636, 178–242 CAS.
  9. M. J. Plewa, E. D. Wagner, P. Jazwierska, S. D. Richardson, P. H. Chen and A. B. McKague, Halonitromethane drinking water disinfection byproducts: chemical characterization and mammalian cell cytotoxicity and genotoxicity, Environ. Sci. Technol., 2004, 38, 62–68 CrossRef CAS PubMed.
  10. M. G. Muellner, E. D. Wagner, K. McCalla, S. D. Richardson, Y. T. Woo and M. J. Plewa, Haloacetonitriles vs. regulated haloacetic acids: are nitrogen-containing DBPs more toxic?, Environ. Sci. Technol., 2007, 41, 645–651 CrossRef CAS PubMed.
  11. S. D. Richardson and T. A. Ternes, Water analysis: emerging contaminants and current issues, Anal. Chem., 2011, 83, 4614–4648 CrossRef CAS PubMed.
  12. M. J. Plewa, M. G. Muellner, S. D. Richardson, F. Fasano, K. M. Buettner, Y.-T. Woo, A. B. McKague and E. D. Wagner, Occurrence, synthesis, and mammalian cell cytotoxicity and genotoxicity of haloacetamides: an emerging class of nitrogenous drinking water disinfection byproducts, Environ. Sci. Technol., 2008, 42, 955–961 CrossRef CAS PubMed.
  13. F. Yang, J. Zhang, W. H. Chu, D. Q. Yin and M. R. Templeton, Haloactamides versus halomethanes formation and toxicity in chloraminated drinking water, J. Hazard. Mater., 2014, 274, 156–163 CrossRef CAS PubMed.
  14. S. L. Yu, T. Lin, W. Chen and H. Tao, The toxicity of a new disinfection by-product, 2,2-dichloroacetamide (DCAcAm), on adult zebrafish (Danio rerio) and its occurrence in the chlorinated drinking water, Chemosphere, 2015, 139, 40–46 CrossRef CAS PubMed.
  15. S. W. Krasner, H. S. Weinberg, S. D. Richardson, S. J. Pastor, R. Chinn, M. J. Sclimenti, G. D. Onstad and A. D. Thruston Jr, Occurrence of a new generation of disinfection byproducts, Environ. Sci. Technol., 2006, 40, 7175–7185 CrossRef CAS PubMed.
  16. W. H. Chu and N.-Y. Gao, et al., Formation of nitrogenous disinfection by-products from pre-chloramination, Chemosphere, 2011, 85, 1187–1191 CrossRef CAS PubMed.
  17. Y. Zeng, et al., The effects of residual chlorine on the behavioural responses of Daphnia magna in the early warning of drinking water accidental events, Procedia Environ. Sci., 2012, 13, 71–79 CrossRef CAS.
  18. Z. H. Yan, X. F. Yang and G. H. Lu, et al., Potential environmental implications of emerging organic contaminants in Taihu Lake, China: comparison of two ecotoxicological assessment approaches, Sci. Total Environ., 2014, 470–471, 171–179 CrossRef CAS PubMed.
  19. M. D. Pavlaki, et al., Changes of chemical chronic toxicity to Daphnia magna under different food regimes, Ecotoxicol. Environ. Saf., 2014, 109, 48–55 CrossRef CAS PubMed.
  20. S. W. Krasner, M. J. Sclimenti, Y. C. Guo, C. J. Hwang and P. Westerhoff, Development of DBP and nitrosamine formation potential tests for treated wastewater, reclaimed water, and drinking water, in AWWA Water Quality Technology Conference, AWWA, Publishing, Denver, CO, 2004 Search PubMed.
  21. S. W. Krasner, M. J. Sclimenti, W. Mitch, P. Westerhoff and A. Dotson, Using formation potential tests to elucidate the reactivity of DBP precursors with chlorine versus with chloramines, in AWWA Water Quality Technology Conference, AWWA, Publishing, Denver, CO, 2007 Search PubMed.
  22. W. H. Chu and N. Y. Gao, et al., Ozone-biological activated carbon integrated treatment for removal of precursors of halogenated nitrogenous disinfection by-products, Chemosphere, 2012, 86, 1087–1091 CrossRef CAS PubMed.
  23. W. H. Chu and N.-Y. Gao, et al., Formation and speciation of nine haloacetamides, an emerging class of nitrogenous DBPs, during chlorination or chloramination, J. Hazard. Mater., 2013, 260, 806–812 CrossRef CAS PubMed.
  24. V. Kanokkantapong, et al., FTIR evaluation of functional groups involved in the formation of haloacetic acids during the chlorination of raw water, J. Hazard. Mater., 2006, 136, 188–196 CrossRef CAS PubMed.
  25. T. F. Marhaba and T. F. D. Van, Chlorinated disinfection by-product formation potential of dissolved organic matter fractions at an ozonation water treatment plant, Adv. Environ. Res., 1999, 3(3), 255–268 Search PubMed.
  26. F. Maffei, et al., Drinking water quality: an in vitro approach for the assessment of cytotoxic and genotoxic load in water sampled along distribution system, Environ. Int., 2009, 35, 1053–1061 CrossRef CAS PubMed.
  27. Y. Shi, et al., In vitro toxicity of surface water disinfected by different sequential treatments, Water Res., 2009, 43, 218–228 CrossRef CAS PubMed.
  28. L. Hernández Leal, et al., Ecotoxicological assessment of grey water treatment systems with Daphnia magna and Chironomus riparius, Water Res., 2012, 46, 1038–1044 CrossRef PubMed.
  29. J. Kim, et al., Phototoxicity and oxidative stress responses in Daphnia magna under exposure to sulfathiazole and environmental level ultraviolet B irradiation, Aquat. Toxicol., 2009, 91, 87–94 CrossRef CAS PubMed.
  30. X. Zhang, et al., Enhancement of toxic effects of phenanthrene to Daphnia magna due to the presence of suspended sediment, Chemosphere, 2014, 104, 162–169 CrossRef CAS PubMed.
  31. O. H. Lowry, N. J. Rosenbrough, A. L. Farr and R. J. Randall, Protein measurement with the Folin–Ciocalteu reagent, J. Biol. Chem., 1951, 193, 265–271 CAS.
  32. S.-B. Kim, et al., Identification of multi-level toxicity of liquid crystal display wastewater toward Daphnia magna and Moina macrocopa, J. Hazard. Mater., 2012, 327–333 CrossRef PubMed.
  33. M. Yu, et al., Effects of the 1-alkyl-3-methylimidazolium bromide ionic liquids on the antioxidant defense system of Daphnia magna, Ecotoxicol. Environ. Saf., 2009, 72, 1798–1804 CrossRef CAS PubMed.
  34. W. H. Chu, N. Y. Gao, Y. Deng and S. W. Krasner, Precursors of dichloroacetamide, an emerging nitrogenous DBP formed during chlorination or chloramination, Environ. Sci. Technol., 2010, 44, 3908–3912 CrossRef CAS PubMed.
  35. A. E. Heink, A. N. Parrish, G. H. Thorgaard and P. A. Carter, Oxidative stress among SOD-1 genotypes in rainbow trout (Oncorhynchus mykiss), Aquat. Toxicol., 2013, 144–145 Search PubMed.
  36. C. Wang, G. H. Lu and P. F. Wang, et al., Assessment of environmental pollution of Taihu Lake by combining active biomonitoring and integrated biomarker response, Environ. Sci. Technol., 2011, 45, 3746–3752 CrossRef CAS PubMed.
  37. D. J. Huang, Y. M. Zhang, G. Song, J. Long, J. H. Liu and W. H. Ji, Contaminants induced oxidative damage on the carp Cyprinus carpio collected from the upper Yellow River, China, Environ. Monit. Assess., 2007, 128, 483–488 CrossRef CAS PubMed.
  38. T. H. Le, et al., Proteomic analysis in Daphnia magna exposed to As(III), As(V) and Cd heavy metals and their binary mixtures for screening potential biomarkers, Chemosphere, 2013, 93, 2341–2348 CrossRef CAS PubMed.
  39. J. Yoo, et al., Identification of toxicity variations in a stream affected by industrial effluents using Daphnia magna and Ulva pertusa, J. Hazard. Mater., 2013, 260, 1042–1049 CrossRef CAS PubMed.
  40. W. H. Chu, C. J. Li and N. Y. Gao, et al. Terminating pre-ozonation prior to biological activated carbon filtration results in increased formation of nitrogenous disinfection by-products upon subsequent chlorination, Chemosphere, 2015, 121, 33–38 CrossRef CAS PubMed.
  41. W. H. Chu, et al., Formation of halogenated C-, N-DBPs from chlor(am)ination and UV irradiation of tyrosine in drinking water, Environ. Pollut., 2012, 161, 8–14 CrossRef CAS PubMed.
  42. A. Claiborne, in Catalase Activity, ed. R. A. Greenwald, CRC Press, Boca Raton, 1985, pp. 283–284 Search PubMed.

Footnote

Electronic supplementary information (ESI) available. See DOI: 10.1039/c6ra14912j

This journal is © The Royal Society of Chemistry 2016
Click here to see how this site uses Cookies. View our privacy policy here.