DOI:
10.1039/C6RA14823A
(Paper)
RSC Adv., 2016,
6, 69124-69134
Effect of MIL-53 on phase inversion and gas separation performance of mixed matrix hollow fiber membranes
Received
7th June 2016
, Accepted 8th July 2016
First published on 8th July 2016
Abstract
In this paper the θ-composition for the Ultem®1000/NMP/EtOH ternary phase system was determined firstly and based on this, membranes with different non-solvent ratios (lower, slightly lower, and larger than the θ-composition) were prepared. It was found that dopes with a non-solvent ratio slightly lower than the θ-composition gave membranes the most attractive gas separation performance. Then the metal–organic framework (MOF) of MIL-53 was incorporated into Ultem®1000 to fabricate asymmetric mixed matrix hollow fiber membranes (MMHFMs). MIL-53, which was grouped with EtOH as a non-solvent, turned out to influence the phase inversion more significantly than EtOH did. Similar to the pure Ultem®1000 membrane, MMHFMs formed with the dopant close to the θ-condition for the Ultem®1000/MIL-53/NMP/EtOH phase system possessed the best permeation performance: MMHFMs with 5 wt% MIL-53 loading exhibited an O2 and CO2 permeance of 8.1 GPU and 27.9 GPU, an increase of 138% and 129% respectively compared with the pure Ultem membrane. Meanwhile, the O2/N2 and CO2/CH4 selectivity was almost unchanged. Moreover, the rule was also embodied in MMHFMs with different filler loadings. This study quantitatively revealed the pseudo non-solvent effect of MOFs, which offers an effective method for the fabrication of MMHFMs with a low MOF loading but high performance.
1. Introduction
Membrane gas separation has received considerable attention because of its obvious advantages such as lower energy cost, being easy to scale up, and environmental sustainability over other conventional methods such as cryogenic distillation, solvent adsorption and pressure swing adsorption.1–3 The trade-off effect between permeability and selectivity as proposed by Robeson,4 however, has restricted the gas separation properties of polymeric membranes. Currently, although modifying the structure of existing polymeric materials and developing new membrane materials have been investigated, such as for thermally rearranged (TR) polymers and polymers of intrinsic microporosity (PIMs),5–8 their industrial applications encounter serious problems because of fatal drawbacks, e.g. deteriorated mechanical properties for TR polymers and poor solubility for PIMs.9–11 These disadvantages make them difficult to process into cost-effective hollow fiber membranes. Compared with polymers, inorganic membranes prepared from ceramics, molecular sieves or pyrolyzed carbons possess separation efficiency and chemical inertness.12,13 Nevertheless, they are limited to small-scale applications, because these materials are fragile, difficult to process and expensive to fabricate.14,15
To overcome these limitations, mixed matrix membranes (MMMs) that combine inorganic materials with a polymer matrix have emerged as a promising approach in membrane technology.16 Various materials have been explored as the filler, including clay,16,17 mesoporous silica,18 zeolites,19,20 and carbon nanotubes.21 However, it turns out to be quite difficult to fabricate well-dispersed and defect-free MMMs because of particle aggregation and poor distribution in the polymer matrix.1,13,22,23 Metal organic frameworks (MOFs) have recently attracted a lot of attention as potential filler materials to provide better wetting and dispersion since the pioneering work by Yehia et al.24 Since then, more attempts to improve the performance of MMMs have been reported such as with Matrimid®5218/ZIF-8,25,26 PSF/Cu3(BTC)2,27 PMMA/CAU-1-NH2,28 6FDA-DAM/ZIF-90,29 and so on, which have shown potential applications in gas separation. Unfortunately most of these works focus on dense flat membranes with only several exceptions. For example, Hu et al. prepared polyimide-based hollow fiber membranes by embedding dispersed Cu3(BTC)2 to improve the H2 separation performance,30 and Koros’ group successfully spun dual-layer polyetherimide/ZIF-8 and 6FDA-DAM/ZIF-8 MMHFMs which enhanced the gas permeance and selectivity.31,32 These limited studies have translated an attractive gas separation performance into a better scalable membrane geometry (hollow fiber), but there are still many challenges, such as the instability of MMHFMs with a high loading of MOFs, the influence of MOFs on the phase inversion process, the complexity of fabrication processes, and so on. These challenges compel researchers to deeply understand the interaction between fillers and the polymer matrix, utilize a low MOF loading to prominently enhance the gas permeation performance of MMHFMs without mechanical strength loss, and simplify the procedure for membrane fabrication.
As we know, proper selection of dispersed particles and a polymer matrix combination is a key factor for high performance MMM preparation.33 The polymer matrix used in this study is a commercially available polyetherimide, Ultem®1000, which has excellent mechanical, thermal and chemical stability. It is more economical than other small-batch polymers and has a relatively high selectivity due to the rigid backbone and fused rings.34,35 In spite of these excellent properties, the permeance of Ultem®1000 needs to be improved substantially in order to compete with traditional separation processes. On the other hand, among versatile MOFs, the MIL series of MOFs pioneered by Férey and co-workers36,37 exhibits attractive characteristics with high pore volumes and large surface areas.36,38 MIL-53(Al) is composed of AlO4(OH)2 octahedra chains by corner-sharing, linked to terephthalate ligands to form three-dimensional structures. Its framework contains uni-directional diamond-shaped channels, and possesses a unique structure–breathing property and a high gas adsorption capacity.36,39 Qian et al. reported the structural stability of MIL-53(Al) in different pH aqueous solutions from room temperature to 100 °C,40 which ensures the structural integrity during the hollow fiber spinning process. Additionally, the bridging –OH group between two AlO6 octahedra of MIL-53(Al) would interact with the C![[double bond, length as m-dash]](https://www.rsc.org/images/entities/char_e001.gif) O group of the Ultem®1000 molecules,39,41,42 meanwhile the terephthalate ligands also enhance the compatibility with the polymer matrix. Moreover, MIL-53(Al) is constructed by aluminium metal clusters and inexpensive organic ligands, and therefore shows promising industrial applications. As far as we know, there is no documentation on the use of MIL-53 incorporated into a polymer matrix for MMHFM fabrication.
O group of the Ultem®1000 molecules,39,41,42 meanwhile the terephthalate ligands also enhance the compatibility with the polymer matrix. Moreover, MIL-53(Al) is constructed by aluminium metal clusters and inexpensive organic ligands, and therefore shows promising industrial applications. As far as we know, there is no documentation on the use of MIL-53 incorporated into a polymer matrix for MMHFM fabrication.
In order to fully investigate the influence of MOFs on the phase inversion, avoid the instability of MMMs, and simplify the spinning processes, we used a glassy polymer Ultem®1000 to fabricate mixed matrix hollow fiber membranes with a low MIL-53 loading (less than 10 wt%) via the dry-wet phase inversion method. Herein the θ-composition for the Ultem®1000/NMP/EtOH ternary phase system was determined using turbidimetric titration data. Then the influence of the non-solvent ratio on the gas separation properties was investigated to guide the MMHFM fabrication. In order to get high gas separation performance MMHFMs with low MOF loading, the pseudo non-solvent effect of MIL-53 was taken into consideration for dopant preparation. The effect of MIL-53 on the phase inversion and gas separation performance of MMHFMs was investigated systematically by adjusting the non-solvent ratio of the dopes, and the θ-composition for the phase system with MIL-53 was determined. Moreover, the gas separation performance of MMHFMs containing different amounts of filler was also measured to further confirm the non-solvent effect of MIL-53.
2. Experimental
2.1. Materials
Ultem®1000 polymer (Fig. 1) was purchased from GE Plastics in pellet form and was dried at 140 °C for 12 hours before use. Terephthalic acid (H2BDC, AR) was purchased from Sinopharm Chemical Reagent Co., Ltd. N,N-Dimethylformamide (DMF), N-methyl-2-pyrrolidone (NMP), n-hexane, petroleum ether, and anhydrous ethanol (EtOH) were purchased from Kemiou Chemical Reagent Co., Ltd (Tianjin, China). Al(NO3)3·9H2O was provided by Guangfu Technology Development Co., Ltd. Polydimethylsiloxane (PDMS, Sylgard 184) was produced by Dow Chemicals.
 |
| | Fig. 1 Chemical structure of polyetherimide, Ultem®1000. | |
2.2. Cloud point measurement
Cloud point experiments were conducted at 25 °C for the Ultem/NMP/EtOH ternary system. Only low polymer concentrations were used in the titration experiments because cloud point data become unreliable when the viscosity of the solution is higher. The cloud point compositions were mapped on the ternary phase diagram (Fig. 2) in order to determine the non-solvent/solvent θ-composition, as the references reported.43–45
 |
| | Fig. 2 Polymer precipitation curve of the ternary system Ultem®1000/NMP/EtOH at 25 °C. | |
2.3. Synthesis of MIL-53(Al)
MIL-53(Al) was synthesized according to a slightly modified recipe described by the reported literature.46,47 4.22 g Al(NO3)3·9H2O and 1.245 g H2BDC were added into the mixed solvent of 20 mL water and 55 mL DMF to prepare MIL-53(Al). After magnetic stirring for 40 minutes, the mixture was transferred into a Teflon-lined steel autoclave and heated in an air oven at 150 °C for 48 hours. The product was filtered by centrifugation and washed with deionized water to remove the nitric acid formed during the synthesis. The residual terephthalic acid was extracted by immersing it in boiling DMF with stirring for 6 hours. Then the white powder was filtered from the DMF and dried in an air oven at 150 °C for 12 hours. Finally, the powdered MIL-53(Al) was further activated at 180 °C under vacuum for 12 hours.
2.4. Mixed matrix hollow fiber membrane preparation
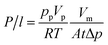
2.4.1. Dopant preparation. The dopes without MIL-53 were formulated by adding 33 wt% Ultem polymer into the NMP/EtOH mixture with different mass ratios. The polymer was dissolved with vigorous stirring at 60 °C for 12 hours. After the polymer was completely dissolved, the dopant was degassed under vacuum prior to spinning.For the MMHFMs, the dopes were prepared as follows: MIL-53 was added to a portion of the required NMP with sonication and mechanical stirring alternatively for 45 minutes to obtain a well-dispersed suspension. Then the filler MIL-53 was primed by the addition of a dilute polymer solution into the suspension in order to combine the Ultem polymer with MIL-53 compatibly. This mixture was stirred for 2–3 hours and sonicated for 45 minutes until a uniform consistency was obtained. All of the required EtOH was then added with the remaining NMP into the suspension. The remaining polymer pellet was gradually added to the mixture to increase the dopant viscosity. After all of the components were added, the solution was stirred at 60 °C for about 12 hours to fully dissolve the Ultem®1000 polymer. The dopant was finally degassed under vacuum for at least 12 hours prior to spinning. The hybrid hollow fiber membranes with different MOF loadings were prepared by adjusting the amount of MIL-53, and the loading was determined by:
| |
 | (1) |
The effect of the non-solvent ratio in the dopant on the gas separation performance was investigated in the present work which is defined as:
| |
 | (2) |
2.4.3. Solvent exchange and post-treatment. The hollow fiber membranes were rinsed in the flowing tap water for at least 24 hours to remove the remaining solvent. Then the fibers were solvent exchanged by immersing in three successive aliquots of ethanol for 30 minutes, followed by 30 minutes immersion in three successive aliquots of n-hexane. The fibers were dried in an oven at 70 °C for 3 hours.The surface coating procedure was applied to seal the pinhole defects in the selective skin layer of the hollow fibers. In this study, 3 wt% Sylgard 184 solution in petroleum ether was prepared (10 wt% of cross-linking agent was added based on the weight of Sylgard 184), then the membrane modules containing fibers were completely immersed in the silicon rubber solution separately for 30 minutes. Later, the modules were placed into an oven and cured at 70 °C for 3 hours after petroleum ether evaporation. The coated membrane modules were measured to evaluate the gas separation performance.
2.5. Characterizations
MIL-53 and variable Ultem/MIL-53 MMHFMs were characterized by powder X-ray diffraction (XRD) using a PANalytical Empyrean diffractometer with Cu Kα radiation (λ = 0.15406 nm). The basal spacing was calculated using Bragg’s equation:| |
nλ = 2d![[thin space (1/6-em)]](https://www.rsc.org/images/entities/char_2009.gif) sinθ sinθ
| (3) |
Scanning electron microscopy (SEM, SUPRA™ 55 SAPPHIRE) was performed to examine the shape and size of the crystal MIL-53, and the surface and cross-section morphologies of the hollow fiber membranes. All the membrane samples were frozen and broken off in liquid nitrogen, and then sputtered with gold before SEM testing.
The thermal stability of the synthesized MIL-53 and Ultem/MIL-53 MMHFMs series was measured by thermogravimetric analysis (TGA) using NETZSCH STA449F3. The samples were heated at a rate of 10 °C min−1 from room temperature to 800 °C under nitrogen atmosphere.
The nitrogen adsorption–desorption isotherm of MIL-53 was recorded using an Autosorb iQ analyzer at 77 K in liquid nitrogen to calculate its surface area and total pore volume. The sample used in the measurement was degassed at 120 °C under vacuum.
2.6. Gas permeation measurement
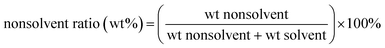
The pure gas permeation experiments were conducted at 35 °C with an operation pressure of 0.50 MPa. The permeation flow rate was measured with a soap bubble flow meter and the permeance (P/l) was calculated using the following equation:| |
 | (4) |
where pp is the pressure of the permeate side (cmHg), Vp is the volume of permeate gas during the test duration (cm3), Vm is the molar volume of ideal gas at standard conditions (cm3 (STP) per mol), R is the universal gas constant, T is the absolute temperature (K), A is the permeation area (cm2), and t is the test duration (s), Δp is the trans-membrane pressure difference (cmHg). The permeance (P/l) is commonly reported in the gas permeation unit (GPU), which is defined as 1 GPU = 1 × 10⁻⁶ cm3 (STP) per (cm2 s cmHg).
The ideal selectivity of gases i and j is defined as eqn (5):
| |
 | (5) |
For each fiber sample, at least three membrane modules were prepared and then tested to guarantee the reliability of results. Average values were recorded in this paper and the relative deviations were no higher than 6%.
3. Results and discussion
3.1. Calculation of the non-solvent/solvent θ-composition
As we know the polymer-dissolving power of the solvent will be reduced when a non-solvent is added to a polymer solution. Once the non-solvent/solvent mixture reaches the θ-composition, the polymer macromolecule will turn into an unperturbed conformation because at this point the interaction between macromolecular chains will be balanced by its interaction with solvent molecules.45,48,49 So determination of the θ-composition for the currently investigated dopant system is very important45 and should be studied first. In this work, ethanol was chosen as the non-solvent to titrate the polymer solution to its precipitation point at 25 °C.
This θ-composition of a solvent mixture for a polymer could be determined by the method of Elias43 using the turbidimetric titration data at a constant temperature. Table 2 lists the cloud point composition of Ultem/NMP/EtOH at different initial polymer concentrations, which was obtained from the polymer precipitation curve in Fig. 2. The volumes of components were obtained by dividing by density and the volume fractions were calculated on the assumption that component volumes are additive.45 The volume fraction of the non-solvent, ΦEtOH, at a precipitation point was plotted against the natural logarithm of the corresponding polymer volume fraction, lnΦUltem. The θ-composition of the non-solvent/solvent mixture, ΦEtOHθ, was obtained by extrapolating the plot to 100% polymer, namely with lnΦUltem equal to zero. As can be seen in Fig. 4, the estimated θ-composition (the mass ratio of non-solvent to non-solvent/solvent mixture) of the ternary system in this work is 16.1%.
Table 2 Cloud point compositions of the Ultem/NMP/EtOH ternary phase system with different Ultem concentrations
| Ulteminitial (wt%) |
Ultem (vol%) |
NMP (vol%) |
EtOH (vol%) |
| 2.0 |
1.23 |
76.04 |
22.73 |
| 3.0 |
1.85 |
75.62 |
22.53 |
| 4.0 |
2.55 |
75.12 |
22.33 |
| 6.0 |
3.80 |
74.15 |
22.05 |
| 8.0 |
5.14 |
73.22 |
21.64 |
| 10.0 |
6.49 |
72.28 |
21.23 |
| 15.0 |
9.95 |
69.61 |
20.44 |
| 20.0 |
13.48 |
66.65 |
19.87 |
 |
| | Fig. 4 Volume fraction of EtOH, ΦEtOH vs. lnΦUltem, natural logarithm of volume fraction of Ultem at the precipitation point. | |
3.2. Pure Ultem hollow fiber membrane fabrication and performance
3.2.1. Influence of non-solvent ratio on membrane morphology. Three kinds of the same polymer concentration dopant solutions with different non-solvent ratios were spun under the same extrinsic conditions to ensure that the only variable among them was the composition of the non-solvent and solvent. Herein, the effect of the non-solvent ratio on the micromorphology and gas permeation of the fabricated pure Ultem HFMs was investigated. The skin layer and the substrate structure of the pure Ultem HFMs spun from the dopant with different mass ratios of the non-solvent to solvent are shown in Fig. 5. It can be clearly seen that the skin layer of the fibers was more smooth (Fig. 5B-II) when the non-solvent ratio was slightly lower than the θ-composition (expressed as NS% ≈ θ). A closer examination of the outer part of the cross-section shows that an even denser top layer was generated accompanied by a more distinct transition layer (Fig. 5B-IV). However, the skin (Fig. 5C-II) became rougher when the amount of non-solvent in the dopant solution increased to surpass the non-solvent/solvent θ-composition. Whereas on the other hand, when the amount of non-solvent was reduced to 13.4%, which was much below the θ-composition, the defects were also obvious in the skin as shown in Fig. 5A-II. Additionally, with an increase of the non-solvent content, the phase separation of the membrane sub-layer tended to delay de-mixing,50 which restricted macro-void formation and generated denser sponge-like pores.
 |
| | Fig. 5 SEM images of pure Ultem HFMs (A: NS% < θ; B: NS% ≈ θ; C: NS% > θ), I: fiber overview, II: fiber skin layer top view, III: fiber substrate, IV: a close-up of the skin layer side view. | |
3.2.2. Influence of the non-solvent ratio on gas permeation performance. Table 3 illustrates the effect of the non-solvent ratio on the pure gas permeation properties of the corresponding fibers. It can be seen that the fiber prepared from the dopant with the non-solvent ratio approximately equal to the θ-composition possessed the best gas separation performance. When the non-solvent ratio was much lower than the θ-composition, the polymer concentration in the outermost region of the nascent membrane was not high enough to form a defect-free skin due to less ethanol evaporation during the air gap, which made the gas separation property unsatisfactory even after the coating process.
Table 3 The gas permeance and ideal selectivity of pure Ultem HFMs (35 °C, 0.50 MPa)
| Sample |
Ultema% |
NSb% |
Permeance (GPU) |
Selectivity |
| O2 |
CO2 |
O2/N2 |
CO2/CH4 |
| The concentration of Ultem, Ultem% = wt Ultem/(wt Ultem + wt NMP + wt EtOH) × 100%. NS% = wt EtOH/(wt NMP + wt EtOH) × 100%. |
| NS% < θ |
33.0% |
13.4% |
6.6 ± 0.2 |
17.1 ± 0.4 |
1.8 ± 0.1 |
3.4 ± 0.1 |
| (After coating) |
4.9 ± 0.2 |
14.6 ± 0.6 |
5.4 ± 0.2 |
19.1 ± 0.8 |
| NS% ≈ θ |
33.0% |
15.9% |
4.8 ± 0.2 |
14.5 ± 0.6 |
3.1 ± 0.1 |
8.5 ± 0.4 |
| (After coating) |
3.4 ± 0.1 |
12.2 ± 0.4 |
6.9 ± 0.2 |
30.2 ± 1.6 |
| NS% > θ |
33.0% |
17.3% |
4.4 ± 0.1 |
13.1 ± 0.7 |
2.2 ± 0.1 |
4.9 ± 0.2 |
| (After coating) |
3.0 ± 0.1 |
10.3 ± 0.4 |
6.0 ± 0.2 |
23.9 ± 0.8 |
On the other hand, the permeance of O2 and CO2 decreased from 3.4 GPU to 3.0 GPU, and 12.2 GPU to 10.3 GPU respectively when the non-solvent ratio surpassed the θ-composition due to the thicker skin layer formed from the dopant with excessive non-solvent. The selectivity of O2/N2 and CO2/CH4, however, decreased although the skin layer became thicker which was contrary to the literature.50 One important thing we should notice was that in this condition the amount of non-solvent was too large, which caused the dopant solution to be close to the binodal curve. During the air gap, the dopant composition very easily triggered early phase separation by the adsorption of moisture. This indicated that the non-solvent tolerance of the dopant solution was very low which could not guarantee that the composition of the outermost region of the nascent membrane came towards the vitrification region without crossing the phase boundary like a path in Fig. 6. Early phase separation (Fig. 6, path b) would lead to a relatively thick but not dense enough skin layer and an inconspicuous transition layer, as can be seen in Fig. 5, which resulted in disappointing gas permeance and selectivity.
 |
| | Fig. 6 Ternary phase diagram illustrating the formation of hollow fiber membranes during the dry-wet spinning process. | |
3.3. Characterization of MIL-53 and mixed matrix hollow fiber membranes
3.3.1. XRD analysis. The X-ray diffractograms for MIL-53 and the Ultem/MIL-53 MMHFM series are displayed in Fig. 7. MIL-53 showed three well-defined peaks below 20° which was consistent with the form of MIL-53, in good agreement with the reported literature.51–53 In contrast, pure Ultem hollow fiber membranes did not exhibit any obvious diffraction peaks. Nevertheless, Ultem/MIL-53 mixed matrix fibers showed new peaks around 9.1° and 17.9° which indicated the presence of MIL-53 particles in the Ultem matrix. The peak around 12.5° did not emerge in the Ultem/MIL-53 mixed matrix fibers due to the breathing behavior of MIL-53. MIL-53 was present in the large-pore (lp) form after activation, and the pores deformed to a narrow-pore (np) form due to hydrogen bonding interactions between oxygen atoms of the solvent NMP and the bridging –OH group between two AlO6 octahedra of MIL-53 during the dopant preparation.39,54,55 Additionally, we could also observe the characteristic band of amorphous Ultem around 16.1° that corresponded to a d-spacing value of 5.5 Å. The band of the Ultem/5% MIL-53 fiber was slightly shifted to a lower angle from 16.1° to 15.4° and had a larger d-spacing value than that of Ultem. This d-spacing shift was attributed to the interaction between the filler MIL-53 and the Ultem matrix. This result demonstrated that the arrangement of the polymer chain packing in the vicinity of MIL-53 was disrupted and the space between polymer chains was extended by the presence of MIL-53 which could lead to higher gas permeance.
 |
| | Fig. 7 XRD diffractograms of MIL-53, pure Ultem HFMs and Ultem/MIL-53 MMHFMs. | |
3.3.2. Thermal properties. The thermal stability of MIL-53, pure Ultem and Ultem/MIL-53 membranes were measured by thermogravimetric analysis. As shown in Fig. 8, the weight loss of MIL-53 before 100 °C was assigned to the dehydration process caused by the evaporation of adsorbed water on the outer surface of MIL-53. The departure of the free BDC acid and BDC molecules encapsulated within the pores occurred within the range 220–520 °C. Above 520 °C, the BDC linkers were eliminated from the framework and MIL-53 was transformed into Al2O3. With the addition of MIL-53 into the matrix, even with a low loading, the Ultem/5% MIL-53 fibers presented a higher decomposition temperature around 504 °C, while the onset of degradation of unfilled Ultem fibers apparently occurred at a lower temperature around 448 °C. The increase in decomposition temperature indicated that the existence of MIL-53 within the Ultem matrix imparted better thermal stability. The improvement of thermal stability could be attributed to the interaction between the polymer and filler which increased the energy needed for polymer chain movement or segmentation.42 The shield effect of the filler would also enhance the thermal stability.56 The heat could be absorbed by the MIL-53 particles resulting in a relatively higher decomposition temperature.
 |
| | Fig. 8 TGA curves of MIL-53, pure Ultem HFMs and Ultem/MIL-53 MMHFMs. | |
3.3.3. MIL-53 structure and MOF-filled MMHFM morphology. Fig. 9 reveals that MIL-53 follows a type I isotherm without hysteresis upon desorption, indicating high microporosity in the structure. The measured BET surface area was 696 m2 g−1, and the Langmuir surface area was estimated to be 923 m2 g−1. The pore volume of MIL-53 was very large (1.16 cm3 g−1). Additionally, sample images for MIL-53 and the fiber incorporating 5 wt% MIL-53 particles are shown in Fig. 10. The crystal size of the synthesized MIL-53 was around 200 nm and did not aggregate generally (Fig. 10A). From the Ultem/MIL-53 fiber cross-section (Fig. 10C), neither filler particle agglomeration nor isolation from the polymer matrix could be observed, implying that the polymer and well-dispersed MIL-53 particles were well compatible. In addition, the prepared MMHFMs showed a typical asymmetric structure of a gas separation membrane and the supporting layer of the fiber was comprised of a sponge-like structure and finger-like pores (Fig. 10B).
 |
| | Fig. 9 Nitrogen adsorption and desorption isotherms of MIL-53. | |
 |
| | Fig. 10 SEM images of (A) MIL-53 and (B and C) MMHFM cross-section (red circles represent the presence of MIL-53 particles). | |
3.4. Pseudo non-solvent effect of MIL-53 on MMHFM fabrication
3.4.1. Gas permeation performance of MMHFMs and analysis. A certain amount of MIL-53 was added into the above dopant with the non-solvent ratio approaching the θ-composition for the pure Ultem polymer and the spinning condition did not change. The gas separation properties of the corresponding fibers are presented in Table 4. It can be clearly seen that their selectivity behaviors after coating were not satisfactory, since there is quite a large difference between them and the selectivity of the pure Ultem fiber for both O2/N2 and CO2/CH4 gas pairs. From the SEM morphologies in Fig. 11, we could also see obvious defects on the surface of the Ultem/MIL-53 MMHFMs. As we have proven above, the non-solvent ratio could affect the gas separation performance. It can be deduced that MIL-53 particles would change the phase behavior and non-solvent ratio of the dopant, and then influence the phase inversion significantly during the MMHFM spinning process. Therefore, it was essential to consider the non-solvent effect of MOF fillers for MMHFM fabrication.
Table 4 The gas permeance and ideal selectivity of Ultem/MIL-53 MMHFMs fabricated from dopes with the same non-solvent ratio (35 °C, 0.50 MPa)
| MOF loading |
Permeance (GPU) |
Selectivity |
| O2 |
N2 |
CO2 |
CH4 |
O2/N2 |
CO2/CH4 |
| 0 wt% |
3.4 ± 0.1 |
0.49 ± 0.02 |
12.2 ± 0.4 |
0.40 ± 0.02 |
6.9 ± 0.2 |
30.2 ± 1.6 |
| 2 wt% |
5.0 ± 0.2 |
0.81 ± 0.03 |
16.9 ± 0.7 |
0.71 ± 0.03 |
6.2 ± 0.2 |
23.9 ± 1.1 |
| 5 wt% |
6.8 ± 0.3 |
1.23 ± 0.04 |
24.4 ± 0.7 |
1.24 ± 0.05 |
5.5 ± 0.2 |
19.7 ± 0.7 |
| 8 wt% |
9.2 ± 0.3 |
1.83 ± 0.05 |
34.3 ± 1.5 |
1.92 ± 0.06 |
5.0 ± 0.1 |
17.9 ± 0.7 |
 |
| | Fig. 11 Skin layer morphologies of Ultem/MIL-53 MMHFMs (A: Ultem/2% MIL-53, B: Ultem/5% MIL-53, C: Ultem/8% MIL-53). | |
3.4.2. Estimation of MIL-53 pseudo non-solvent effect. The amount of non-solvent in the dopant solution had a great effect on the gas permeation properties of the hollow fiber membranes as illustrated above. We have proven that the structure of the fibers, a dense thin skin layer and a porous supporting layer, could be better prepared when the non-solvent ratio was slightly lower than the θ-composition, which we assume should also apply to the Ultem/MIL-53 MMHFMs. So the pseudo non-solvent effect of the filler MIL-53 was also taken into consideration for the θ-composition calculation. Comparing the gas permeation results in Table 5, there are quite large differences among the MMHFMs prepared from dopes with the same polymer concentration but different non-solvent ratios. It can be seen that the fibers prepared from the dopant with NS% (non-solvent ratio) equal to 12.8% (or NS%M equal to 14.9%) possessed the best gas separation performance, with an O2 and CO2 permeance of 8.1 GPU and 27.9 GPU, and O2/N2 and CO2/CH4 selectivity of 7.0 and 29.7 respectively. Based on the θ-composition for the Ultem/NMP/EtOH ternary phase system, the θ-composition for the system with 5% MIL-53 addition occurred at a lower non-solvent concentration of about 12.8%. The Ultem/5% MIL-53 MMHFM prepared from this dopant solution gave a smooth and dense skin layer and a fine sponge-like structure gradually progressed from the outer part to the inner part of the fiber as shown in Fig. 12.
Table 5 The gas permeance and ideal selectivity of Ultem/5% MIL-53 MMHFMs fabricated from dopes with different non-solvent ratios (35 °C, 0.50 MPa)
| Sample |
NS% |
NS%Ma |
Permeance (GPU) |
Selectivity |
| O2 |
N2 |
CO2 |
CH4 |
O2/N2 |
CO2/CH4 |
| NS%M = (wt EtOH + wt MIL-53)/(wt NMP + wt EtOH + wt MIL-53) × 100%. |
| 1 |
9.4% |
11.6% |
12.3 ± 0.3 |
2.27 ± 0.10 |
30.3 ± 1.2 |
1.89 ± 0.08 |
5.4 ± 0.2 |
16.0 ± 0.7 |
| 2 |
11.6% |
13.8% |
7.1 ± 0.2 |
1.12 ± 0.05 |
24.3 ± 0.5 |
0.98 ± 0.04 |
6.3 ± 0.2 |
24.7 ± 0.5 |
| 3 |
12.8% |
14.9% |
8.1 ± 0.3 |
1.16 ± 0.03 |
27.9 ± 1.1 |
0.94 ± 0.03 |
7.0 ± 0.2 |
29.7 ± 1.1 |
| 4 |
13.8% |
16.0% |
6.7 ± 0.2 |
1.08 ± 0.04 |
22.9 ± 1.2 |
0.89 ± 0.05 |
6.2 ± 0.2 |
25.9 ± 1.4 |
| 5 |
15.2% |
17.3% |
7.2 ± 0.3 |
1.24 ± 0.06 |
25.7 ± 1.1 |
1.16 ± 0.04 |
5.8 ± 0.3 |
22.1 ± 0.9 |
| 6 |
16.0% |
18.1% |
6.8 ± 0.3 |
1.23 ± 0.04 |
24.4 ± 0.7 |
1.24 ± 0.05 |
5.5 ± 0.2 |
19.7 ± 0.7 |
 |
| | Fig. 12 SEM images of Ultem/5% MIL-53 MMHFMs prepared from the dopant with NS% = 12.8% (I: fiber skin layer, II: fiber cross-section, III: a close-up of the skin layer). | |
If the effect of MIL-53 was not taken into consideration, namely NS% = 16.0%, the gas separation performance of the corresponding fibers became degraded. The O2 and CO2 permeance was 6.8 GPU and 24.4 GPU, but the O2/N2 and CO2/CH4 selectivity decreased to 5.5 and 19.7 respectively. The result could be explained by the fact that early phase separation (Fig. 6, path b) would occur to form a rough and relatively thick skin layer, once the non-solvent content was too high. It was indicated that the non-solvent effect of MIL-53 had a great impact on the gas separation properties. It could also be found that the selectivity property was still unsatisfactory when the non-solvent effect of MIL-53 was treated like EtOH (NS%M equal to 16.0%), which implied that MIL-53 influenced the phase inversion more significantly than EtOH. On the other hand, when NS% decreased to 9.4%, the selectivity of the corresponding fiber was reduced dramatically to 5.4 and 16.0 for O2/N2 and CO2/CH4 respectively.
3.4.3. MMHFMs with different MOF loadings. In order to further confirm the pseudo non-solvent effect of MIL-53, the separation performance of MMHFMs with different MIL-53 loadings was also investigated (Table 6). Similar to the case of Ultem/5% MIL-53, Ultem/2% MIL-53 and Ultem/8% MIL-53 MMHFMs possessed the best combination of permeance and selectivity, when the non-solvent ratios of the dopant were 14.6% and 11.0% respectively where the θ-composition for these systems occurred. The O2/N2 and CO2/CH4 selectivity is 6.9 and 29.2 for 2% MIL-53 loading, and 6.7 and 28.5 for 8% loading. If the NS% was higher or lower than the θ-composition for their respective phase system, the gas separation performance of the corresponding MMHFMs became much worse. Therefore, the concern about the non-solvent effect of MOFs is of great value and necessity for MMHFM fabrication.
Table 6 The gas permeance and ideal selectivity of MMHFMs with different MIL-53 loadings (35 °C, 0.50 MPa)
| MOF loading |
NS% |
NS%Ma |
Permeance (GPU) |
Selectivity |
| O2 |
N2 |
CO2 |
CH4 |
O2/N2 |
CO2/CH4 |
| NS%M = (wt EtOH + wt MIL-53)/(wt NMP + wt EtOH + wt MIL-53) × 100%. |
| 2 wt% |
11.5% |
13.7% |
7.6 ± 0.3 |
1.34 ± 0.06 |
26.9 ± 0.9 |
1.24 ± 0.06 |
5.7 ± 0.2 |
21.7 ± 1.0 |
| 2 wt% |
14.6% |
15.5% |
6.3 ± 0.3 |
0.91 ± 0.03 |
21.1 ± 1.0 |
0.72 ± 0.03 |
6.9 ± 0.3 |
29.2 ± 1.6 |
| 2 wt% |
15.6% |
16.4% |
5.2 ± 0.2 |
0.81 ± 0.03 |
17.7 ± 1.0 |
0.68 ± 0.02 |
6.4 ± 0.3 |
25.9 ± 0.7 |
| 8 wt% |
9.6% |
13.1% |
10.9 ± 0.3 |
1.94 ± 0.07 |
38.6 ± 1.3 |
1.87 ± 0.05 |
5.6 ± 0.2 |
20.7 ± 0.6 |
| 8 wt% |
11.0% |
14.4% |
9.5 ± 0.5 |
1.41 ± 0.04 |
32.6 ± 1.4 |
1.14 ± 0.04 |
6.7 ± 0.3 |
28.5 ± 1.0 |
| 8 wt% |
12.7% |
16.1% |
7.9 ± 0.3 |
1.29 ± 0.05 |
28.1 ± 0.8 |
1.13 ± 0.05 |
6.1 ± 0.3 |
24.8 ± 0.9 |
3.5. Comparison with literature data for MMHFMs
From Table 7, it can be seen that the fiber without MIL-53 addition exhibited 3.4 CPU and 12.2 GPU for the O2 and CO2 permeance respectively. When 5 wt% MIL-53 was incorporated in MMHFMs, the O2 and CO2 permeance increased significantly to 8.1 GPU and 27.9 GPU respectively, which is an enhancement of 138% and 129%. Meanwhile, the O2/N2 and CO2/CH4 selectivity was almost unchanged. Compared with the reported literature about hybrid fibers using polyetherimide as the polymer matrix in Table 7, the gas permeance of the mixed matrix hollow fiber membranes prepared in this work was improved most prominently even with a filler loading as low as 5 wt%. Another advantage of this MMHFM preparation was that instead of adding more volatile solvent such as tetrahydrofuran (THF), the only solvent we used in fabricating Ultem/MIL-53 MMHFMs was N-methyl-2-pyrrolidone (NMP), with a good solubility for polymers and high boiling point, which could enlarge the practical application possibility and is more suitable in long-term industrial production.
Table 7 Comparison of pure gas permeation performance with literature data for MMHFMs with a polyetherimide matrix
| Membrane |
Solvent |
PO2 (GPU) |
PCO2 (GPU) |
PO2/PN2 |
PCO2/PCH4 (PCO2/PN2) |
Reference |
| Values of the CO2/CH4 selectivity. Values of the CO2/N2 selectivity. |
| Ultem |
NMP |
3.4 |
12.2 |
6.9 |
30.2a |
This work |
| 5 wt% MIL-53 |
8.1 (138%) |
27.9 (129%) |
7.0 |
29.7a |
| PEI |
NMP |
1.85 |
— |
4.40 |
— |
57 |
| 4 wt% MWCNTs |
3.02 (63%) |
— |
4.38 |
— |
| Ultem |
NMP/THF |
3.00 |
11.30 |
7.26 |
36.0a |
58 |
| 13 wt% HSSZ-13 |
3.26 (9%) |
11.69 (3%) |
7.7 |
39.6a |
| Ultem |
NMP/THF |
— |
14 |
— |
30b |
31 |
| 17 vol% ZIF-8 |
— |
26 (86%) |
— |
36b |
This work was measured with pure O2, N2, CH4, and CO2 (0.50 MPa) at 35 °C, ref. 57 was measured with pure O2 and N2 (0.40 MPa) at 25 °C, ref. 58 was measured with pure O2, N2, CH4 (0.80 MPa) and pure CO2 (0.16 MPa) at 35 °C, and ref. 31 was measured with pure N2 and CO2 (0.70 MPa) at 35 °C.
The gas permeation enhancement in our work was attributed to the filler MIL-53. When MIL-53 was incorporated in the matrix, the micropores of MIL-53 offered extra permeation channels especially in the skin layer to reduce the permeation resistance, which was equivalent to decreasing the thickness of the separation layer. Another important reason should be also considered. The migration of hydrophobic MIL-53 particles stretched the finger-like pores under the skin layer which was accompanied by more and smaller sponge-like pores generated in the finger-like pore walls (Fig. 12III). This distinct morphology could reduce the gas transport resistance to a large extent, resulting in an increase of the gas permeance.
4. Conclusions
The pure Ultem HFMs fabricated from a dopant close to the θ-condition that was determined by the turbidimetric titration data possessed the best gas separation performance. A typical flexible MOF MIL-53 incorporated into the polymer matrix influenced the phase inversion more significantly than EtOH during the fabrication of Ultem/MIL-53 MMHFMs. By varying the non-solvent ratio of the dopant, the membrane structure was successfully optimized and the pseudo non-solvent effect of MIL-53 was also estimated. The Ultem/5% MIL-53 MMHFMs fabricated from the dopant with the non-solvent ratio equal to 12.8% possessed excellent gas permeation properties: the O2 and CO2 permeance was 8.1 GPU and 27.9 GPU respectively, which is 138% and 129% higher than that of hollow fiber membranes without MIL-53 incorporation, and the O2/N2 and CO2/CH4 selectivity was almost unchanged. This was attributed to the super-thin skin and high porosity of the substructure which played an important role in reducing the gas transport resistance. Moreover, the gas separation performance of MMHFMs containing different amounts of MIL-53 was also measured to further confirm the non-solvent effect of MIL-53 and determine the θ-condition for each dopant phase system. In conclusion, this study has provided an effective method to illustrate the pseudo non-solvent effect of the MOF filler which could improve the permeation performance of MMHFMs remarkably even with a low loading. This work also gives evidence that MMHFMs hold great application potential for large-scale gas separation.
Acknowledgements
The authors sincerely acknowledge the financial support from National Natural Science Foundation of China (No. 21436009).
References
- W. J. Koros, AIChE J., 2004, 50, 2326–2334 CrossRef CAS.
- R. W. Baker, Ind. Eng. Chem. Res., 2002, 41, 1393–1411 CrossRef CAS.
- W. H. Lin and T. S. Chung, J. Membr. Sci., 2001, 186, 183–193 CrossRef CAS.
- L. M. Robeson, J. Membr. Sci., 2008, 320, 390–400 CrossRef CAS.
- H. B. Park, S. H. Han, C. H. Jung, Y. M. Lee and A. J. Hill, J. Membr. Sci., 2010, 359, 11–24 CrossRef CAS.
- N. Du, H. B. Park, G. P. Robertson, M. M. Dal-Cin, T. Visser, L. Scoles and M. D. Guiver, Nat. Mater., 2011, 10, 372–375 CrossRef CAS PubMed.
- D. F. Sanders, Z. P. Smith, R. Guo, L. M. Robeson, J. E. McGrath, D. R. Paul and B. D. Freeman, Polymer, 2013, 54, 4729–4761 CrossRef CAS.
- M. Carta, R. Malpass-Evans, M. Croad, Y. Rogan, J. C. Jansen, P. Bernardo, F. Bazzarelli and N. B. McKeown, Science, 2013, 339, 303–307 CrossRef CAS PubMed.
- H. Wang, D. R. Paul and T. S. Chung, Polymer, 2013, 54, 2324–2334 CrossRef CAS.
- P. Budd, K. Msayib, C. Tattershall, B. Ghanem, K. Reynolds, N. McKeown and D. Fritsch, J. Membr. Sci., 2005, 251, 263–269 CrossRef CAS.
- P. M. Budd, N. B. McKeown and D. Fritsch, Macromol. Symp., 2006, 245–246, 403–405 CrossRef.
- M. G. Buonomenna, W. Yave and G. Golemme, RSC Adv., 2012, 2, 10745–10773 RSC.
- M. A. Aroon, A. F. Ismail, T. Matsuura and M. M. Montazer-Rahmati, Sep. Purif. Technol., 2010, 75, 229–242 CrossRef CAS.
- D. Q. Vu, W. J. Koros and S. J. Miller, J. Membr. Sci., 2003, 211, 311–334 CrossRef CAS.
- D. Q. Vu, W. J. Koros and S. J. Miller, J. Membr. Sci., 2003, 211, 335–348 CrossRef CAS.
- T. S. Chung, L. Y. Jiang, Y. Li and S. Kulprathipanja, Prog. Polym. Sci., 2007, 32, 483–507 CrossRef CAS.
- P. Bernardo, E. Drioli and G. Golemme, Ind. Eng. Chem. Res., 2009, 48, 4638–4663 CrossRef CAS.
- J. Ahn, W. J. Chung, I. Pinnau and M. D. Guiver, J. Membr. Sci., 2008, 314, 123–133 CrossRef CAS.
- O. G. Nik, X. Y. Chen and S. Kaliaguine, J. Membr. Sci., 2011, 379, 468–478 CrossRef CAS.
- T. Pechar, S. Kim, B. Vaughan, E. Marand, M. Tsapatsis, H. Jeong and C. Cornelius, J. Membr. Sci., 2006, 277, 195–202 CrossRef CAS.
- S. Kim, L. Chen, J. K. Johnson and E. Marand, J. Membr. Sci., 2007, 294, 147–158 CrossRef CAS.
- R. Mahajan, R. Burns, M. Schaeffer and W. J. Koros, J. Appl. Polym. Sci., 2002, 86, 881–890 CrossRef CAS.
- C. M. Zimmerman, A. Singh and W. J. Koros, J. Membr. Sci., 1997, 137, 145–154 CrossRef CAS.
- H. Yehia, T. J. Pisklak, J. P. Ferraris, K. J. Balkus and I. H. Musselman, Abstracts of Papers of the American Chemical Society, 2004, 227, U351 Search PubMed.
- M. J. C. Ordoñez, K. J. Balkus, J. P. Ferraris and I. H. Musselman, J. Membr. Sci., 2010, 361, 28–37 CrossRef.
- Q. Song, S. K. Nataraj, M. V. Roussenova, J. C. Tan, D. J. Hughes, W. Li, P. Bourgoin, M. A. Alam, A. K. Cheetham, S. A. Al-Muhtaseb and E. Sivaniah, Energy Environ. Sci., 2012, 5, 8359 CAS.
- A. Car, C. Stropnik and K.-V. Peinemann, Desalination, 2006, 200, 424–426 CrossRef CAS.
- L. Cao, K. Tao, A. Huang, C. Kong and L. Chen, Chem. Commun., 2013, 49, 8513–8515 RSC.
- T. H. Bae, J. S. Lee, W. Qiu, W. J. Koros, C. W. Jones and S. Nair, Angew. Chem., Int. Ed., 2010, 49, 9863–9866 CrossRef CAS PubMed.
- J. Hu, H. P. Cai, H. Q. Ren, Y. M. Wei, Z. L. Xu, H. L. Liu and Y. Hu, Ind. Eng. Chem. Res., 2010, 49, 12605–12612 CrossRef CAS.
- Y. Dai, J. R. Johnson, O. Karvan, D. S. Sholl and W. J. Koros, J. Membr. Sci., 2012, 401–402, 76–82 CrossRef CAS.
- C. Zhang, K. Zhang, L. Xu, Y. Labreche, B. Kraftschik and W. J. Koros, AIChE J., 2014, 60, 2625–2635 CrossRef CAS.
- S. Keskin and D. S. Sholl, Energy Environ. Sci., 2010, 3, 343–351 CAS.
- S. Saimani, A. Kumar, M. M. Dal-Cin and G. Robertson, J. Membr. Sci., 2011, 374, 102–109 CrossRef CAS.
- S. Saimani and A. Kumar, J. Appl. Polym. Sci., 2008, 110, 3606–3615 CrossRef CAS.
- G. Férey, M. Latroche, C. Serre, F. Millange, T. Loiseau and A. Percheron-Guégan, Chem. Commun., 2003, 2976–2977 RSC.
- C. Serre, F. Millange, C. Thouvenot, M. Nogues, G. Marsolier, D. Louer and G. Férey, J. Am. Chem. Soc., 2002, 124, 13519–13526 CrossRef CAS PubMed.
- G. Férey, C. Mellot-Draznieks, C. Serre, F. Millange, J. Dutour, S. Surble and I. Margiolaki, Science, 2005, 309, 2040–2042 CrossRef PubMed.
- T. Loiseau, C. Serre, C. Huguenard, G. Fink, F. Taulelle, M. Henry, T. Bataille and G. Férey, Chem.–Eur. J., 2004, 10, 1373–1382 CrossRef CAS PubMed.
- X. Qian, B. Yadian, R. Wu, Y. Long, K. Zhou, B. Zhu and Y. Huang, Int. J. Hydrogen Energy, 2013, 38, 16710–16715 CrossRef CAS.
- M. Meilikhov, K. Yusenko and R. A. Fischer, J. Am. Chem. Soc., 2009, 131, 9644–9645 CrossRef CAS PubMed.
- F. Dorosti, M. Omidkhah and R. Abedini, J. Nat. Gas Sci. Eng., 2015, 25, 88–102 CrossRef CAS.
- H. G. Elias, Makromol. Chem., 1961, 50, 1–19 CrossRef CAS.
- W. W. Y. Lau, M. D. Guiver and T. Matsuura, J. Appl. Polym. Sci., 1991, 42, 3215–3221 CrossRef CAS.
- W. W. Y. Lau, M. D. Guiver and T. Matsuura, J. Membr. Sci., 1991, 59, 219–227 CrossRef CAS.
- D. Xuan-Dong, H. Vinh-Thang and S. Kaliaguine, Microporous Mesoporous Mater., 2011, 141, 135–139 CrossRef.
- M. Zhou, Y. N. Wu, J. Qiao, J. Zhang, A. McDonald, G. Li and F. Li, J. Colloid Interface Sci., 2013, 405, 157–163 CrossRef CAS PubMed.
- R. M. Boom, T. Vandenboomgaard, J. W. A. Vandenberg and C. A. Smolders, Polymer, 1993, 34, 2348–2356 CrossRef CAS.
- S. M. Lambert, Y. H. Song and J. M. Prausnitz, Macromolecules, 1995, 28, 4866–4876 CrossRef CAS.
- A. F. Ismail and P. Y. Lai, Sep. Purif. Technol., 2003, 33, 127–143 CrossRef CAS.
- P. Rallapalli, D. Patil, K. P. Prasanth, R. S. Somani, R. V. Jasra and H. C. Bajaj, J. Porous Mater., 2009, 17, 523–528 CrossRef.
- T. Lescouet, E. Kockrick, G. Bergeret, M. Pera-Titus and D. Farrusseng, Dalton Trans., 2011, 40, 11359–11361 RSC.
- A. Lyubchyk, I. A. A. C. Esteves, F. J. A. L. Cruz and J. P. B. Mota, J. Phys. Chem. C, 2011, 115, 20628–20638 CAS.
- W. P. Mounfield and K. S. Walton, J. Colloid Interface Sci., 2015, 447, 33–39 CrossRef CAS PubMed.
- P. L. Llewellyn, S. Bourrelly, C. Serre, Y. Filinchuk and G. Férey, Angew. Chem., Int. Ed., 2006, 45, 7751–7754 CrossRef CAS PubMed.
- A. K. Zulhairun, B. C. Ng, A. F. Ismail, R. S. Murali and M. S. Abdullah, Sep. Purif. Technol., 2014, 131, 1–12 CrossRef.
- P. S. Goh, B. C. Ng, A. F. Ismail, M. Aziz and Y. Hayashi, J. Colloid Interface Sci., 2012, 386, 80–87 CrossRef CAS PubMed.
- S. Husain and W. J. Koros, J. Membr. Sci., 2007, 288, 195–207 CrossRef CAS.
|
| This journal is © The Royal Society of Chemistry 2016 |
Click here to see how this site uses Cookies. View our privacy policy here. 


