
TiO2 nanosheet-anchoring Au nanoplates: high-energy facet and wide spectra surface plasmon-promoting photocatalytic efficiency and selectivity for CO2 reduction†
Abstract
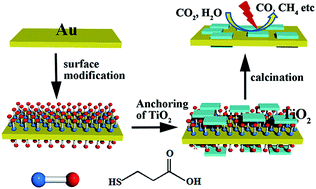
An Au–TiO2 nanocomposite consisting of (001) exposed TiO2 nanosheet-anchored Au nanoplates was successfully fabricated using bifunctional linker molecules and applied for the photocatalytic reduction of CO2 into hydrocarbon fuels. This unique nanocomposite benefits from the combination of the higher photocatalytic activity of TiO2 (001) and the visible to near-infrared region plasma resonances of anisotropic Au nanostructures. Several carbon fuels were selectively produced over the Au–TiO2 nanocomposite, including CO, CH4, CH3OH and CH3CH2OH, under different forms of light irradiation and in different reaction systems. Both photoresponse testing and electrochemical impedance spectroscopy measurements confirm the importance of the Au surface plasmon for the photocatalytic activity.
 Please wait while we load your content...

