
A highly sensitive fluorescent probe for detection of hydrazine in gas and solution phases based on the Gabriel mechanism and its bioimaging†
Rajkishor Majia,
Ajit Kumar Mahapatra*a,
Kalipada Maitia,
Sanchita Mondala,
Syed Samim Alia,
Prithidipa Sahoob,
Sukhendu Mandalc,
Md Raihan Uddinc,
Shyamaprosad Goswamia,
Ching Kheng Quahd and
Hoong-Kun Funde
aDepartment of Chemistry, Indian Institute of Engineering Science and Technology, Shibpur, Howrah-711103, West Bengal, India. E-mail: mahapatra574@gmail.com; Fax: +91 3326684564
bDepartment of Chemistry, Visva-Bharati (A Central University), Santiniketan 731235, India
cDepartment of Microbiology, University of Calcutta, Kolkata-700019, India
dX-ray Crystallography Unit, School of Physics, Universiti Sains Malaysia, 11800 USM, Penang, Malaysia
eDepartment of Pharmaceutical Chemistry College of Pharmacy, King Saud University, P.O. Box. 2457, Riyadh 11451, Kingdom of Saudi Arabia
First published on 15th July 2016
Abstract
A new probe 2-benzo[1,2,5]thiadiazol-4-yl-isoindole-1,3-dione (BTI) based on the Gabriel reaction mechanism was synthesized and characterized for the specific detection of hydrazine with high selectivity against other amines in an organo-aqueous solution. Upon hydrazinolysis of BTI in the presence of hydrazine in a H2O–DMSO (4![[thin space (1/6-em)]](https://www.rsc.org/images/entities/char_2009.gif) :6, v/v) solution (10 mM HEPES buffer, pH 7.4) at room temperature, the chemosensor produces fluorescent aminobenzthiadiazole with a maximum emission at 498 nm along with a color change from colorless to green, allowing selective colorimetric and fluorometric detection of hydrazine by the naked eye. Probe BTI was also successfully applied in vapor phase hydrazine detection into a solid state over other interfering volatile analytes. Furthermore, the probe BTI coated with silica gel TLC plates could act as a visual and fluorimetric probe for hydrazine vapor detection. The experimental detection limit of hydrazine is 2.9 ppb, which is well below the accepted limit (10 ppb) for hydrazine set by the U.S. Environmental Protection Agency (EPA). DFT and TDDFT calculations were performed in order to demonstrate the sensing mechanism and the electronic properties of probe and hydrazinolysis products. Additionally, probe BTI could also be applied for the imaging of hydrazine in living cells.
:6, v/v) solution (10 mM HEPES buffer, pH 7.4) at room temperature, the chemosensor produces fluorescent aminobenzthiadiazole with a maximum emission at 498 nm along with a color change from colorless to green, allowing selective colorimetric and fluorometric detection of hydrazine by the naked eye. Probe BTI was also successfully applied in vapor phase hydrazine detection into a solid state over other interfering volatile analytes. Furthermore, the probe BTI coated with silica gel TLC plates could act as a visual and fluorimetric probe for hydrazine vapor detection. The experimental detection limit of hydrazine is 2.9 ppb, which is well below the accepted limit (10 ppb) for hydrazine set by the U.S. Environmental Protection Agency (EPA). DFT and TDDFT calculations were performed in order to demonstrate the sensing mechanism and the electronic properties of probe and hydrazinolysis products. Additionally, probe BTI could also be applied for the imaging of hydrazine in living cells.
Introduction
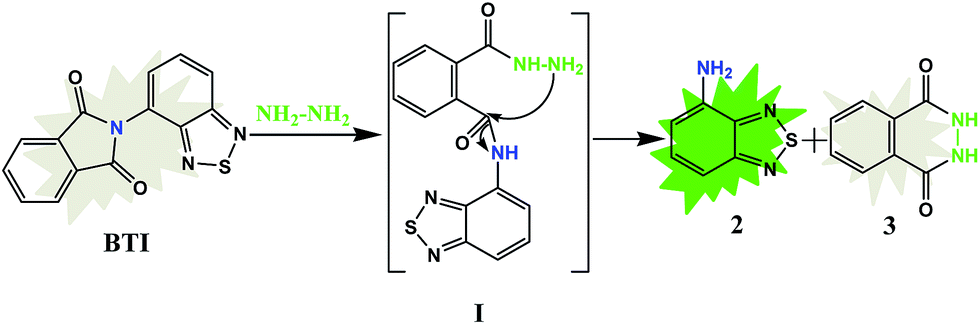
Much attention has been focused in the last few years on the development of small molecular fluorescent probes for hydrazine (H2N–NH2) because of its wide application and toxicity.1 Hydrazine and its derivatives are commonly known fuels in explosives, antioxidants, rocket propellants, blowing agents, photographic chemicals, corrosion inhibitors, insecticides, and plant growth regulators.2–4 In spite of these, it is commonly known as a neurotoxin, carcinogenic, mutagenic, hepatotoxic and very harmful to human life.5,6 It is highly toxic and easily absorbed by oral, breathing routes of exposure or even introduced to the skin, which mostly affect the lungs, kidney, liver and central nervous system of living organisms. Moreover, it can seriously affect the reproductive system in animals after the hydrazine inhalation. It has also been identified as a carcinogenic agent by U.S. Environmental Protection Agency (EPA) and the estimated inhalation unit risk is 4.9 × 10⁻³ (μg m−3)−1. Hence, hydrazine has been classified as a carcinogenic substance by the same agency with allowable threshold limit value (TLV) of 10 ppb,7,8 which provides an incentive to research for new analytical approaches capable of determining trace level of hydrazine.Various traditional analytical techniques for the detection of hydrazine are available, including electrochemical analysis9 and chromatography,10 including gas chromatography,11 HPLC,12 coulometry,13 potentiometry,14 titrimetry,15 capillary electrophoresis16 and electroanalysis.17 Spectrophotometry using colored derivatives, such as p-dimethylaminobenzaldehyde18 and chlorosalicylaldehyde,19 are also used to detect hydrazine. However, these methods are not only complex and time consuming, but also impractical for in vivo hydrazine analysis because of their post-mortem processing and destruction of tissues and cell contents. Among several detection strategies, fluorescent techniques are extremely attractive due to their high sensitivity, low cost, easy implementation, and real-time detection.20,21 Till now, only a few fluorescent chemodosimeters for hydrazine have been reported, and almost all of them were designed based on the deprotection or chemical transformation of a protecting group by a specific deprotecting agent or analyte.22–26 For example, the fluorescent sensing system developed by Chang et al.,27 showed the selective deprotection of levulinated coumarin in presence of hydrazine in DMSO–water. The sensing system reported by Peng et al.,28 showed a ratiometric hydrazine-selective NIR probe based on cyanine dye via deprotection of acetyl group in aqueous-organic solvent. Therefore, it still remains a challenge to develop effective hybrid fluorescent probes with suitable reactive zone that can act as good chemodosimeter for the recognition of molecular species, though such systems are limited in literature in case of hydrazine sensing. Furthermore, fewer sensors have been applied to vapor sensing.29,30 Cui et al.29 have reported an efficient fluorescent chemodosimeter which employs a naphthalic anhydride fluorophore. It senses hydrazine in an elegant manner by the Gabriel reaction. Keeping this in mind, we have envisioned a chemodosimeter which contains benzothiadiazole fluorophore which incorporates excellent turn-on fluorescence properties along with enhanced bio-compatibility. Some of the current probes could only be utilized at low pH (pH < 5) conditions31,32 which would limit their application in physiological conditions. Thus, developing a new fluorescence method of monitoring hydrazine in living cells or sensing vapor phase hydrazine remains a significant challenge.
In continuation of our research work in the development of various fluorescent chemosensors for important toxic analytes, herein, we disclose the design and synthesis of a fluorescence sensor based on phthalimide–benzothiadiazole molecular hybrid, which can selectively detect hydrazine in aqueous-DMSO media. The selection of the hybrid phthalimide–benzothiadiazole platform is due to favorable photophysical properties of aminobenzothiadiazole including high quantum yields, high extinction coefficient, and emission maximum beyond 450 nm in the visible region. We recently reported the selective detection of biothiols and hydrazine using benzothiadiazole, BODIPY–pyrene and carbazole based chemosensor.33–35 Therefore, it is of prime interest to develop phthalimide–benzothiadiazole-based hybrid reactive molecular systems to provide better sensitivity and selectivity toward sensing of toxic molecules. However, a benzothiadiazole-based fluorescent probe for hydrazine detection has not been widely reported. To our knowledge, there are very few reports36–38 of selective hydrazine fluorescent probes based on Gabriel phthalimide type moiety. It is important to note that our new probe, 2-benzo[1,2,5]thiadiazol-4-yl-isoindole-1,3-dione (BTI) is highly sensitive to hydrazine with detection limit of 8.47 × 10⁻⁸ M.
Fluorescent hydrazine probe has been constructed by exploiting the high nucleophilic reactivity of the hydrazine molecule. In this work, we judiciously designed probe BTI (Scheme 1) as a new type of selective hydrazine fluorescent probe based on the Gabriel type hydrazinolysis of benzothiadiazole derivative of phthalimide. Probe BTI contains a aminobenzothiadiazole moiety which acts as fluorescent signal transducer and a phthalimide moiety for reacting zone. It is known that in Gabriel method N-substituted phthalimide reacts with hydrazine via simultaneous substitution–elimination process twice gives phthalhydrazide and free primary amine. Due to a photoinduced electron transfer (PET) process from the electron donor, fluorophore to the electron accepter phthalimide(isoindole-1,3-dione) moiety, probe BTI is non-fluorescent (Φ = 0.067). However, when treated with hydrazine, it exhibits a relatively rapid, time-dependent enhancement of its fluorescence signal (Φ = 0.704). Such finding suggests that hydrazine selectively reacts with phthalimide moiety in probe BTI, thus eliminating PET-induced fluorescence quenching and we should observe a substantial fluorescence turn-on response due to free aminobenzothiadiazole moiety.
 | ||
| Scheme 1 Schematic representation of synthesis of compound BTI. | ||
Experimental section
General information and materials
Unless otherwise mentioned, materials were obtained from commercial suppliers and were used without further purification. 1H and 13C NMR spectra were recorded on a Brucker 400 MHz instrument. For NMR spectra, CDCl3 and DMSO-d6 were used as solvent using TMS as an internal standard. Chemical shifts are expressed in δ ppm units. UV-visible and fluorescence spectra measurements were performed on a JASCO V530 and a Perkin Elmer LS55 spectrofluorimeter respectively. Single crystal X-ray diffraction data for BTI were collected on Bruker SMART APEX II DUO CCD area-detector diffractometer at 100 K temperature. Elemental analysis of the compounds was carried out on Perkin-Elmer 2400 series CHNS/O Analyzer. Chemicals and solvents used for the synthesis of receptor were purchased from Sigma Aldrich Chemical Co. (USA) and used without further purification. Salts of different cations, anions and amines were purchased from Spectrochem Pvt Ltd. (India). The following abbreviations are used to describe spin multiplicities in 1H NMR spectra: s = singlet; d = doublet; dd = double doublet; t = triplet.General method of UV-vis and fluorescence titration
For UV-vis and fluorescence titrations, stock solution of sensor BTI was prepared (c = 1 × 10⁻⁶ mL−1) in H2O–DMSO (4:6, v/v) solution (10 mM HEPES buffer, pH 7.4). The solutions of the guest cations, anions and primary amines in the order of 1 × 10⁻⁵ mL−1 were also prepared in H2O–DMSO (4:6, v/v) solution (10 mM HEPES buffer, pH 7.4). The test solution of sensor BTI was prepared by proper dilution method. The spectra of these solutions were recorded by means of UV-vis and the fluorescence methods. All the solvents were purchased from local suppliers and were distilled by standard procedure before use.
Determination of quantum yield
For measurement of the quantum yields of BTI and BTI–N2H4, we recorded the absorbance of the compounds in DMSO solution. The emission spectra were recorded using the maximal excitation wavelengths, and the integrated areas of the fluorescence-corrected spectra were measured. The quantum yield of BTI and BTI–N2H4 were then calculated by comparison with anthracene (Φs = 0.28 in EtOH) as reference using the following equation.| Φx = Φs(Fx/Fs)(As/Ax)(nx2/ns2) |
Cell culture
Vero cell (very thin endothelial cell) (Vero 76, ATCC no. CRL-1587) lines were prepared from continuous culture in Dulbecco's modified Eagle's medium (DMEM, Sigma Chemical Co., St. Louis, MO) supplemented with 10% fetal bovine serum (Invitrogen), penicillin (100 μg mL−1), and streptomycin (100 μg mL−1). The Vero 76 were obtained from the American Type Culture Collection (Rockville, MD) and maintained in DMEM containing 10% (v/v) fetal bovine serum and antibiotics in a CO2 incubator. Cells were initially propagated in 75 cm2 polystyrene, filter-capped tissue culture flask in an atmosphere of 5% CO2 and 95% air at 37 °C in CO2 incubator. When the cells reached the logarithmic phase, the cell density was adjusted to 1.0 × 10⁵ per well in culture media. The cells were then used to inoculate in a glass bottom dish, with 1.0 mL (1.0 × 10⁴ cells) of cell suspension in each dish. After cell adhesion, culture medium was removed. The cell layer was rinsed twice with phosphate buffered saline (PBS), and then treated according to the experimental need.Cellular imaging methodology
For fluorescence imaging studies Vero cells, 1 × 10⁴ cells in 1000 μL of medium, were seeded on sterile 35 mm Petri dish, glass bottom culture dish (ibidi GmbH, Germany), and incubated at 37 °C in a CO2 incubator for 10 hours. Then cells were washed with 500 μL DMEM followed by incubation with final concentration of 1.0 × 10⁻⁶ M BTI probe dissolved in 500 μL DMEM at 37 °C for 1 h in a CO2 incubator and observed under an Olympus IX71 microscope. Images analyzed by Image-pro plus (version 6.3) with excitation at nearby 405 nm FITC filter, and emit at nearby 513 nm. The cells were again washed thrice with phosphate buffered saline PBS (pH 7.4) to remove any free BTI probe and incubated in PBS containing NH2–NH2 to a final concentrations of 1.0 × 10⁻⁵ M, incubated for 30 min followed by washing with PBS three times to remove excess NH2–NH2 outside the cells and images were captured.Cytotoxicity assay
The cytotoxic effects of probe BTI and BTI–N2H4 were determined by an MTT [3-(4,5-dimethylthiazol-2-yl)-2,5-diphenyltetrazolium bromide] assay following the manufacturer's instruction (MTT 2003, Sigma-Aldrich, MO). Vero cells were cultured into 96-well plates (104 cells per well) for 24 h. After overnight incubation, the medium was removed, and various concentrations of BTI, N2H4 and BTI–N2H4 (0, 5, 20, 30 and 50 μM) made in DMEM were added to the cells and incubated for 24 h. Control experiments were set with DMSO, cells without any treatment and cell-free medium were also included in the study. Following incubation, the growth medium was removed, and fresh DMEM containing MTT solution was added. The plate was incubated for 3–4 h at 37 °C. Subsequently, the supernatant was removed, the insoluble colored formazan product was solubilized in DMSO, and its absorbance was measured in a microplate reader (Perkin-Elmer) at 570 nm. The assay was performed in triplicate for each concentration of BTI, N2H4 and BTI–N2H4. The OD value of wells containing only DMEM medium was subtracted from all readings to get rid of the background influence. The cell viability was calculated by the following formula: (mean OD in treated wells/mean OD in control wells) × 100.Synthesis of compound (BTI)
A mixture of 4-amino-2,1,3-benzothiadiazole (2) (377.98 mg, 2.5 mmol) and phthalic anhydride (1) (300 mg, 2.03 mmol) in glacial acetic acid (10 mL) was heated to reflex with stirring for 12 hours in a nitrogen atmosphere. The suspension was poured into ice-water (50 mL) and filtered to give solid residues. Then the residues were purified by column chromatography (silica gel, 10% EtOAc in hexane) to afford compound BTI as a pale yellow solid (yield 611.8 mg, 87% with respect to 4-amino-2,1,3-benzothiadiazole). Mp above 250 °C. 1H NMR (CDCl3, 400 MHz) δ (ppm): 8.1178 (d, 1H, Ar-H, J = 8.8 Hz), 8.0116 (dd, 2H, Ar-H, J = 5.32 Hz, 3.04 Hz), 7.8335 (dd, 2H, Ar-H, J = 5.32 Hz, 3.04 Hz), 7.7391 (t, 1H, Ar-H, J = 7.2 Hz), 7.6262 (d, 1H, Ar-H, J = 7.08 Hz). 13C NMR (DMSO-d6, 100 MHz) δ (ppm): 167.42, 155.85, 151.98, 136.09, 132.43, 131.08, 130.65, 124.76, 123.27, 117.08. ESI LCMS, m/z = 282.1 [M + 1]+; calculated, 281.2894 anal. cald for C14H7N3O2S; C, 59.78; H, 2.51; N, 14.94; S, 11.39 found: C, 59.94; H, 2.35; N, 14.97; S, 11.36%.Results and discussion
The chemosensor molecule, BTI, was readily synthesized in one step based on the methodology39 outlined in Scheme 1, and the structure of the probe was characterized by 1H NMR, 13C NMR, LC-MS (Fig. S1–S3 in the ESI†) and single-crystal XRD analysis (Fig. 1). | ||
| Fig. 1 (a) ORTEP diagram for the stereo view of the molecular structure as obtained from the single crystal XRD of BTI. (b) The crystal packing, viewed along the b axis, showing the molecules are linked into two-dimensional planes. | ||
Indeed, as designed, probe BTI is essentially weak-fluorescent (Φ = 0.067) in the neutral aqueous conditions H2O–DMSO (4:6, v/v) solution (10 mM HEPES buffer, pH 7.4), whereas aminobenzothiadiazole 2 is highly fluorescent (Φ = 0.704) around 498 nm in the same aqueous buffer. Thus, it is apparent that compound BTI is promising as a fluorescence turn-on probe for hydrazine provided that compound BTI could be converted by hydrazine to give fluorescent free amine 2.
A summary of the crystallographic data is given in Table S1 in the ESI.† The BTI molecule, Fig. 1a, is twisted with a dihedral angle between the benzothiadiazole (S1/N2/N3/C10–C14, r.m.s. deviation = 0.009 Å) and isoindole ring systems (N1/C1–C18, r.m.s. deviation = 0.022 Å) is 51.61(5)°. In the crystal (Fig. 1b), the molecules are linked by intermolecular C–H⋯O and C–H⋯N hydrogen bonds (Table S2 in the ESI†) and resulting in two-dimensional planes parallel to (011) (Fig. 1b). The molecular structure is further stabilized by weak aromatic π–π stacking interactions between the benzene and thiadiazole rings of adjacent molecules [centroid–centroid separation = 3.7002(10) Å].
Refinement parameters of BTI (Cambridge Crystallographic Data Centre as entry CCDC 1479814†):
The sensitivity of BTI toward different amines and their preferential selectivity toward hydrazine over the other amines has been studied by absorption and fluorescence titrations. We found that the addition of trace amounts of hydrazine causes the absorption and fluorescence signal to change rapidly, which is very important for real-time detection. Therefore, the following titration experiments were carried out after adding varying concentrations of hydrazine (Fig. 2) to a fixed concentration of BTI in H2O–DMSO (4:6, v/v) solution (10 mM HEPES buffer, pH 7.4).
 | ||
| Fig. 2 Changes in the UV/vis absorption spectra of sensor BTI (c = 1 × 10⁻⁶ mL−1) in H2O–DMSO (4:6, v/v) solution (10 mM HEPES buffer, pH 7.4) (a) in the presence of hydrazine (1.5 equivalents) inset: the relative absorbance (A/A0) as a function of [N2H4]/[BTI] mole ratio and (b) other representative cations (Cu2+, Hg2+, Zn2+, Cd2+, Mg2+, Fe3+, Al3+ and Ag+), anions (F−, Cl−, Br−, I−, CN−, PO43−, NO3−, S2− and SO42−) and primary amines (ethylenediamine, 1,3-diaminopropane, o-phenylenediamine, ammonia, hydroxylamine, cysteine, homocysteine, urea and thiourea) (50 equivalents each) inset: color changes of the sensor BTI with the addition of hydrazine. | ||
In a UV-vis absorption spectrum, the solution of BTI showed dual absorption bands at 306 and 313 nm which may be attributed to π–π* as well as vibronic transitions. Upon the addition of hydrazine, the dual absorption bands gradual decreases with a concomitant growth of a new structureless band at 395 nm, therefore induce a color change from colorless to yellow (Fig. 2). The presence of clear isosbestic point at 362 nm implies that it transforms quantitatively to a new species.
The probe BTI exhibit very weak emission at ∼498 nm when excited at 313 nm in H2O–DMSO (4:6, v/v) solution (10 mM HEPES buffer, pH 7.4).
Addition of increasing concentrations of hydrazine to the probe BTI results in the enhancement of fluorescence intensity at 498 nm as a function of the added hydrazine concentration, and the fluorescence enhancement at 498 nm was up to 9.05-fold (Fig. 3). Furthermore, the introduction of hydrazine turned the visual emission of the probe BTI solution from dark to bright green (Fig. 3a, inset), which further supports the fluorescence turn-on response.
 | ||
| Fig. 3 (a) Fluorescence spectra (excitation at 313 nm) of sensor BTI (c = 1 × 10⁻⁶ mL−1) in H2O–DMSO (4:6, v/v) solution (10 mM HEPES buffer, pH 7.4) in the presence of 0–1.5 equiv. of hydrazine. Inset: the fluorescence change of the sensor BTI with the addition of hydrazine. (b) Relative fluorescence responses of sensor BTI (c = 1 × 10⁻⁶ mL−1) in H2O–DMSO (4:6, v/v) solution (10 mM HEPES buffer, pH 7.4) to hydrazine (1.5 equivalents) and other various representative species and primary amines (50 equivalents each): (1) blank; (2) hydrazine; (3) ethylenediamine; (4) 1,3-diaminopropane; (5) o-phenylenediamine; (6) ammonia; (7) hydroxylamine; (8) cysteine; (9) homocysteine; (10) urea; (11) thiourea; (12) mixture [BTI + analytes (tested amines) + N2H4]. Inset: the relative fluorescence intensity (I/I0) as a function of [N2H4]/[BTI] mole ratio. | ||
The changes in the fluorescence spectrum stopped when the amount of added hydrazine reached 1.5 equivalent of the probe. A plot of fluorescence intensity as a function of added [hydrazine]/[BTI] mole ratio (Fig. 3b, inset) shows a stoichiometry of 1:1 between the probe and hydrazine and the intensity goes to highest value at ≥1 equiv. A linear relationship was observed between the fluorescence intensity and hydrazine amount in the range of 0.025–1.5 μM. The detection limit of probe BTI towards hydrazine was calculated to be 8.47 × 10⁻⁸ M (2.9 ppb) (Fig. S5 in the ESI†) which was lower enough than that of the TLV (10 ppb) recommended by the EPA and WHO.
To confirm that the fluorescence sensing response of the probe to hydrazine is indeed due to the conversion of probe BTI to compound 2, the reaction product of probe BTI with hydrazine was isolated by column chromatography. The 1H NMR spectrum of the isolated product is essentially identical with that of the standard compound 2 (Fig. S6 in the ESI†), in good agreement with the formation of compound 2. On the basis of these experiments and reported literatures,36–38 we speculate that the carbonyl position of phthalimide in the BTI was selected as the reaction site and the proposed reaction mechanism of BTI with hydrazine is illustrated in Scheme 2 involving two steps. At first the nucleophilic addition–elimination to the carbonyl group at the phthalimide in the BTI resulted in the intermediate I and then the second nucleophilic addition–elimination to the another carbonyl group by –NH2 in I resulted amide ring formation that leads to phthalhydrazide and release the aminobenzthiadiazole (2), which carry out a unique chromogenic response. To confirm the validity of the proposed sensing mechanism, a solution of probe BTI was analyzed by 1H NMR in the absence and presence of hydrazine, as displayed in Fig. 4.
 | ||
| Scheme 2 Proposed hydrazinolysis mechanism of sensor BTI to hydrazine. | ||
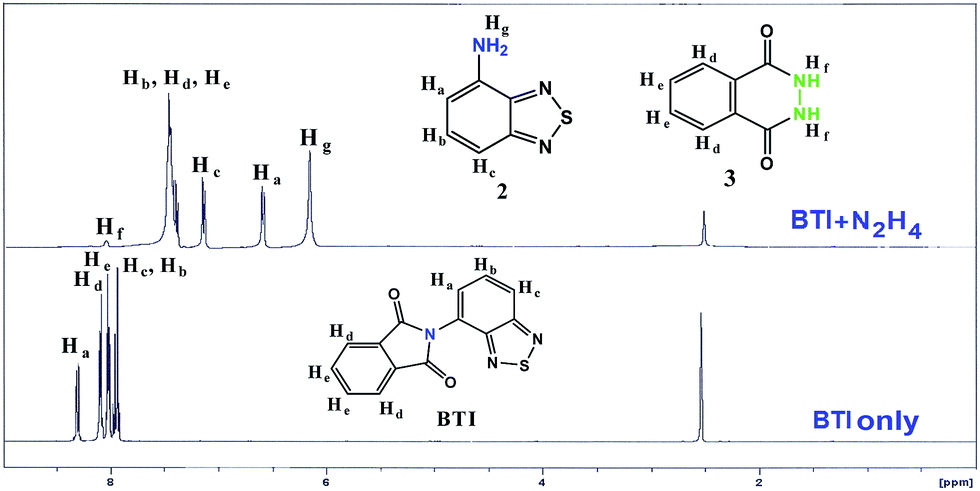 | ||
| Fig. 4 Partial 1H NMR (400 MHz) spectra of BTI only and [BTI + N2H4]. [BTI] = 1 × 10⁻³ M, [hydrazine] = 1 × 10⁻² M in D2O/DMSO-d6 (4:6, v/v). | ||
After hydrazine was added, the protons Ha and Hc of probe BTI moved up field from 8.305, 7.939 to 6.597 and 7.143 ppm respectively, which was almost identical to that of aminobenzthiadiazole (2) (Fig. S6 in the ESI†). A new peak at 6.164 ppm also appeared, assignable to the corresponding –NH2 protons (Hg) of 2. In addition, the characteristic NH proton resonances of the reaction product phthalhydrazide was also clearly observed at 8.028 ppm (Fig. 4) indicating the hydrazinolysis of phthalimide moiety. To further understand the mechanism of probe BTI with hydrazine, LCMS was used to test the solutions containing BTI and 2 equiv. hydrazine, and the peak at 163.2 instead of 282.1 proved that the benzthiadiazole group had been removed and generation of new peak at 169.3 corresponds to aminobenzthiadiazole (2) (Fig. S7 in the ESI†). Thus, the extensive studies of NMR, mass spectrometry, absorption, emission, and excitation spectroscopy corroborate that indeed, as designed, nonfluorescent probe BTI was transformed by hydrazine to afford strongly fluorescent compound 2 for a fluorescence turn-on response (Scheme 2).
In order to check the practical utility of BTI to detect hydrazine selectively even in the presence of common anions and cations, redox molecules and amines competitive analyte titrations were carried out. The BTI fluorescent probe displayed a large fluorescence turn-on response to hydrazine (Fig. 3). By contrast, representative species such as F−, Cl−, Br−, I−, CN−, PO43−, NO3−, S2− and SO42− (as their sodium salts), and amines (ethylenediamine, 1,3-diaminopropane, o-phenylenediamine, ammonia, hydroxylamine, cysteine, homocysteine, urea and thiourea) exhibited almost no changes in emission behaviour. Meanwhile, the commonly encountered cations [Cu2+, Hg2+, Zn2+, Cd2+, Mg2+, Fe3+, Al3+ and Ag+ (as their chloride salts)] did not cause any change to the fluorescence of probe BTI (Fig. S8 in the ESI†).
However the absorption and fluorescence titration carried out with all the other common cations and anions as well as redox anions showed no significant change, indicating their noninteractive nature with BTI (Fig. 2b and 5a). Even the different amines do not react to BTI at room temperature (Fig. 3b and 5b). The results indicate that the probe BTI has high selectivity for hydrazine over other species. This may be attributed to the unique chemical reaction between phthalimide and hydrazine. Fluorescence spectra were also recorded for the titration of probe BTI against hydrazine in the presence of 50 equiv. of common anions and cations, redox anions and amines. None of these analyte significantly affect the emission intensity of BTI upon the addition of hydrazine, and the titration profile is similar to that obtained for simple hydrazine titration (Fig. 3b and 5a). Therefore, it can be concluded that probe BTI selectively reacts hydrazine even in the presence of other analytes.
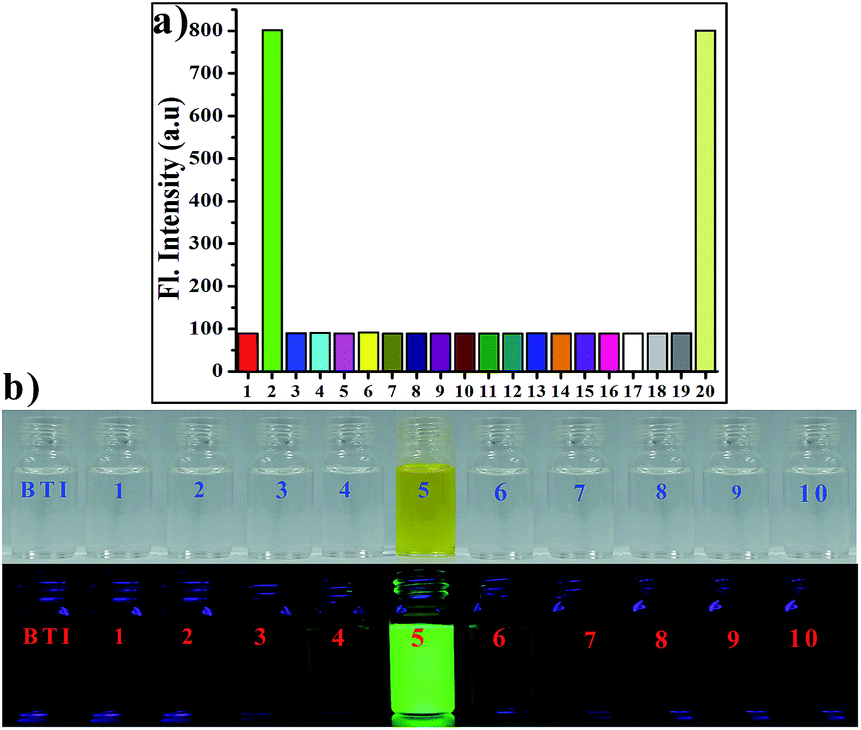 | ||
| Fig. 5 (a) Relative fluorescence responses of sensor BTI (c = 1 × 10⁻⁶ mL−1) in H2O–DMSO (4:6, v/v) solution (10 mM HEPES buffer, pH 7.4) to hydrazine (1.5 equivalents) and other various relevant analytes (50 equivalents each): (1) blank; (2) hydrazine; (3) F−; (4) Cl−; (5) Br−; (6) I−; (7) CN−; (8) PO43−; (9) NO3−; (10) S2−; (11) SO42−; (12) Cu2+; (13) Hg2+; (14) Zn2+; (15) Cd2+; (16) Mg2+; (17) Fe3+; (18) Al3+; (19) Ag+; (20) mixture [BTI + analytes (tested anions & cations) + N2H4] and (b) the photograph of visible color (top) under ambient light and visual fluorescence color (bottom) changes of sensor BTI (c = 1 × 10⁻⁶ mL−1) with various relevant analytes in H2O–DMSO (4:6, v/v) solution (10 mM HEPES buffer, pH 7.4) under a hand-held UV lamp (366 nm): BTI only; (1) ethylenediamine; (2) 1,3-diaminopropane; (3) o-phenylenediamine; (4) ammonia; (5) hydrazine; (6) hydroxylamine; (7) cysteine; (8) homocysteine; (9) urea; (10) thiourea. | ||
The time course of the fluorescence intensity of the probe BTI (c = 1 × 10⁻⁶ mL−1) in the absence or presence of hydrazine (1.5 equiv.) in H2O–DMSO (4:6, v/v) solution (10 mM HEPES buffer, pH 7.4) is displayed in Fig. S9 in the ESI.† The free probe BTI exhibited no noticeable changes in the emission intensity at 498 nm. However, upon introduction of hydrazine, a significant enhancement in the emission intensity was observed within minutes, and the emission intensity essentially reached the maximum in 20 minutes. To be useful in biological applications, it is necessary for a probe to function over a suitable range of pH, in particular at physiological pH. So, the effect of pH on the fluorescence response of BTI to hydrazine was investigated. As shown in Fig. S10 in the ESI† in the absence of hydrazine, almost no change in fluorescence intensity was observed in the free chemosensor over a wide pH range of 1.0–11.0, indicating that the free chemosensor was stable in the wide pH range. Therefore, considering the environmental and biological applications, all studies were carried out at the physiologically relevant pH of 7.4 for the detection of hydrazine.
To get insight into the optical response of probe BTI to hydrazine, probe BTI and the corresponding product after reaction with hydrazine 2 and 3 were examined by density function theory (DFT) and time-dependent density function theory (TDDFT) calculations using a TDDFT//B3LYP/6-31+G(d,p) + solv (SMD) level of the Gaussian 09 program.40 Geometries have been optimized in presence of solvent water. Solvent effects were incorporated using SMD solvent model. The optimized geometries and calculated electron distributions in the frontier molecular orbitals of BTI, 2 and 3 are shown in Fig. S12 in the ESI.†
In addition, we also performed time-dependent density function theory (TDDFT) calculations for the reactant as well as both the product also. The vertical transitions i.e., the calculated λmax, main orbital transition, and oscillator strength (f) are listed in Tables S3 and S4 (ESI†). In the case of the BTI probe, TDDFT calculations provided absorption band at ∼336 nm belonging to the S0 → S2 (f = 0.3052) energy state. This value is consistent with the absorbance band at 313 nm (ε = 3.78 × 10⁵ M−1 cm−1) obtained experimentally. Furthermore, the energy gap between the HOMO and LUMO of 2 was smaller than that of probe BTI, in good agreement with the apparent red shift (∼395 nm) in the absorption observed upon the treatment of probe BTI with hydrazine. The calculated band at ∼466 nm of 2 is assigned to the vertical major transition of HOMO → LUMO, S0 → S1 (∼98.80%) that results from an n → π* transition within the amino-benzothiadiazole moiety of 2, which mainly corresponds to the experimentally observed absorbance band at 395 nm (Table 1).
| Molecules | Electronic transition | Experimentally obtained (λmax) | Theoretically obtained (λmax) | fb |
|---|---|---|---|---|
| BTI | S0 → S2 | 313 nm | 336.87 nm | 0.3052 |
| 2 | S0 → S1 | 395 nm | 466.37 nm | 0.0571 |
| 3 | S0 → S1 | 315 nm | 290.97 nm | 0.0647 |
To be useful in practical applications, we further tested whether probe BTI could be applied for the detection of gas state hydrazine. To make the detection experiments easy to perform and practical, silica gel TLC plates were used. Prior to detection, silica gel TLC plates (silica layer of thickness 0.2 mm on aluminium foil) were prepared by immersing the TLC plates into a CHCl3 solution of probe BTI (c = 1 × 10⁻³ mL−1) and then dried. The probe-loaded TLC plates were covered on the top of jars that contained different hydrazine solution concentrations (blank, 0.01%, 0.1%, 0.5%, 1%, 5%, 10%, 20%, 25%, 30% and 40% in water) for 15 min at room temperature before it was ready to observe. As shown in Fig. 6, the change in the color of the fluorescence from colorless to green was observed using a hand-held UV lamp with excitation at 366 nm.
 | ||
| Fig. 6 Fluorescence color changes of probe BTI (c = 1 × 10⁻³ mL−1) coated silica gel TLC plates (silica layer of thickness 0.2 mm on aluminium foil) after exposure to different concentrations of hydrazine aqueous solution. The fluorescence color changes were collected using a hand-held UV lamp (366 nm). | ||
The gas state hydrazine detection limit of probe BTI concentration is as low as 0.1%, which is considerably more sensitive than the recently developed hydrazine probes.29,30 It is noteworthy that the probe has high potential applications in hydrazine detection. Hydrazine in gaseous form often threatens human life, so our designed probe has more application potential.
We further tested whether probe BTI could be applied for the detection of hydrazine in solution. To make the detection experiments easy to perform and practical a TLC plate was used. Prior to detection, a silica gel TLC plate (silica layer of thickness 0.2 mm on aluminium foil) was firstly immersed into H2O–DMSO (4:6, v/v) solution (10 mM HEPES buffer, pH 7.4) solution of BTI (c = 1 × 10⁻³ mL−1) and dried, then the probe-loaded TLC plate was sink into a beaker containing hydrazine solution for 1.0 min at r.t. before it was ready to observe. As shown in Fig. 7, the change in the color of the fluorescence from dark to green was observed using a hand-held UV lamp with excitation at 366 nm.
 | ||
| Fig. 7 (a) Naked eye detection under ambient lighting conditions and (b) fluorescence color changes visualized on TLC plate strips of sensor BTI (c = 1 × 10⁻³ mL−1) in the presence of hydrazine (c = 1 × 10⁻⁴ M) in H2O–DMSO (4:6, v/v) solution (10 mM HEPES buffer, pH 7.4). | ||
We also explored opportunities for probe BTI to analyze hydrazine in aqueous solution for practical applications. Because hydrazine has carcinogenic properties, and has been widely used in a variety of industrial processes, hydrazine detection in aqueous samples is of interest. Prior to living cell imaging, probe BTI was used to detect hydrazine in tap water and distilled water. An aliquot of hydrazine was added to water and the recoveries obtained by BTI signals were compared in tap water and distilled water (Fig. 8). The analysis of hydrazine in both solutions agreed well at hydrazine concentrations up to 10 μM. The results show that probe BTI can detect hydrazine in real water samples quantitatively.
 | ||
| Fig. 8 Fluorescence detection of hydrazine in distilled water and tap water by BTI. [BTI] = 1.0 × 10⁻⁶ mL−1, [hydrazine] = from 0 to 1.0 × 10⁻⁵ mL−1 in H2O–DMSO (4:6, v/v) solution (10 mM HEPES buffer, pH 7.4) [λexc = 313 nm]. | ||
To further demonstrate the application potential of probe BTI in living cells, the probe was applied in Vero cells for fluorescence imaging of hydrazine. Prior to investigating the suitability of the probe BTI for imaging hydrazine in living cells, it is necessary to evaluate its cytotoxicity. The standard MTT assays suggest that the probe BTI does not exert any adverse effect on cell viability (Fig. S13 in the ESI†). Now the stage was set for cell imaging of hydrazine. The living cells were treated with the probe BTI in the absence or presence of hydrazine. Vero cells incubated with BTI (10 μM) for 20 min at 37 °C in PBS buffer with 0.5% DMSO showed nonfluorescent as shown in Fig. 9. By contrast, cells pre-loaded with the probe BTI and further incubated with hydrazine for further 10 min displayed green fluorescence (Fig. 9) inside Vero cells, as observed earlier in solution studies. These findings open up the avenue for future in vivo biomedical applications of the sensor. Thus, BTI is cell membrane permeable and capable of fluorescence imaging of hydrazine in the living cells.
 | ||
| Fig. 9 Confocal fluorescence microscopic images in Vero 76 cells (Vero 76, ATCC no. CRL-1587): (A) bright field image of the cells, pretreated with probe BTI, (B) only probe BTI at 1.0 × 10⁻⁶ M concentration, (C) bright field image of the cells treated with N2H4 at concentration 1.0 × 10⁻⁵ M, (D) cells treated with probe BTI at concentration 1.0 × 10⁻⁶ M, N2H4 at 1.0 × 10⁻⁵ M, and switch-on fluorescence signal is detected. All images were acquired with a 40× confocal objective lens. λex = 405 nm, λem = 513 nm. | ||
Conclusion
In this paper, we report a new fluorescent probe BTI for selective detection of hydrazine both in gas-phase and aqueous solution based on Gabriel's primary amine synthesis. The probe which is equipped with a designed phthalimide framework could selectively react with hydrazine, resulting in an OFF–ON fluorescence signal change at 498 nm accompanied by a color change from colorless to green at room temperature. The selectivity and sensitivity was demonstrated on the basis of fluorescence, absorption, and 1H NMR spectroscopy, ESI mass spectrometry, and visual fluorescent color changes. The solution detection limit of BTI was found to be 8.47 × 10⁻⁸ M (2.9 ppb), which is lower than the EPA standard (10 ppb). Importantly, probe BTI was successfully applied for the discrimination of different concentrations of hydrazine vapor even at a concentration as low as 0.1% within a few minutes at 25 °C when exposed to a silica gel plate dipped in BTI solution. The structural and electronic properties of BTI and its reaction products have been demonstrated using DFT computational calculations. Finally, the living cell imaging of hydrazine further proved the great potential of the probe for practical utilization.Acknowledgements
We thank the DST-New Delhi [Project file no. SR/S1/OC-44/2012] for financial support. SM thanks UGC, New Delhi, India for a fellowship. We also thank Dr Debasish Mandal for his valuable inputs.Notes and references
- S. Garrod, M. E. Bollard, A. W. Nicholls, S. C. Connor, J. Connelly, J. K. Nicholson and E. Holmes, Chem. Res. Toxicol., 2005, 18, 115–122 CrossRef CAS PubMed.
- S. D. Zelnick, D. R. Mattie and P. C. Stepaniak, Aviat., Space Environ. Med., 2003, 74, 1285–1291 CAS.
- A. Umar, M. M. Rahman, S. H. Kim and Y. B. Hahn, Chem. Commun., 2008, 166–168 RSC.
- H. W. Schiessl, Kirk-Othmer Encyclopedia of Chemical Technology, John Wiley & Sons, Incorporation, NJ USA, 2000, pp. 562–607 Search PubMed.
- G. Wang, C. Zhang, X. He, Z. Li, X. Zhang, L. Wang and B. Fang, Electrochim. Acta, 2010, 55, 7204–7210 CrossRef CAS.
- J.-W. Mo, B. Ogorevc, X. Zhang and B. Pihlar, Electroanalysis, 2000, 12, 48–54 CrossRef CAS.
- G. Choudhary and H. Hansen, Chemosphere, 1998, 37, 801–843 CrossRef CAS PubMed.
- U.S. Environmental Protection Agency (EPA), Integrated Risk Information System (IRIS) on Hydrazine/Hydrazine Sulfate, National Center for Environmental Assessment, Office of Research and Development, Washington, DC, 1999 Search PubMed.
- C. Batchelor-McAuley, C. E. Banks, A. O. Simm, T. G. J. Jones and R. G. Compton, Analyst, 2006, 131, 106–110 RSC.
- D. P. Elder, D. Snodin and A. Teasdale, J. Pharm. Biomed. Anal., 2011, 54, 900–910 CrossRef CAS PubMed.
- M. Sun, L. Bai and D. Q. Lui, J. Pharm. Biomed. Anal., 2009, 49, 529–533 CrossRef CAS PubMed.
- H. Bhutani, S. Singh, S. Vir, K. K. Bhutani, R. Kumar, A. K. Chakraborti and K. C. Jindal, J. Pharm. Biomed. Anal., 2007, 43, 1213–1220 CrossRef CAS PubMed.
- E. C. Olson, Anal. Chem., 1960, 32, 1545–1547 CrossRef CAS.
- J. R. Stetter, K. F. Blurton, A. M. Valentine and K. A. Tellefsen, J. Electrochem. Soc., 1978, 125, 1804–1807 CrossRef CAS.
- H. E. Malone, Anal. Chem., 1961, 33, 575–577 CrossRef CAS.
- J. Liu, W. Zhou, T. You, F. Li, E. Wang and S. Dong, Anal. Chem., 1996, 68, 3350–3353 CrossRef CAS PubMed.
- J. Wang and Z. Lu, Electroanalysis, 1989, 1, 517–521 CrossRef CAS.
- M. George, K. S. Nagaraja and N. Balasubramanian, Talanta, 2008, 75, 27–31 CrossRef CAS PubMed.
- X. Chen, Y. Xiang, Z. Li and A. Tong, Anal. Chim. Acta, 2008, 625, 41–46 CrossRef CAS PubMed.
- D. T. Quang and J. S. Kim, Chem. Rev., 2010, 110, 6280–6303 CrossRef CAS PubMed.
- A. P. Demchenko, Advanced Fluorescence Reporters in Chemistry and Biology II, Springer, New York, 2010, vol. 9 Search PubMed.
- G. E. Collins and S. L. Rose-Pehrsson, Analyst, 1994, 119, 1907–1913 RSC.
- Y. D. Lin and T. J. Chow, RSC Adv., 2013, 3, 17924–17929 RSC.
- M. H. Lee, B. Yoon, J. S. Kim and J. L. Sessler, Chem. Sci., 2013, 4, 4121–4126 RSC.
- S. Goswami, S. Das, K. Aich, B. Pakhira, S. Panja, S. K. Mukherjee and S. Sarkar, Org. Lett., 2013, 15, 5412–5415 CrossRef CAS PubMed.
- M. D. Sun, J. Guo, Q. B. Yang, N. Xiao and Y. X. Li, J. Mater. Chem. B, 2014, 2, 1846–1851 RSC.
- M. G. Choi, J. Hwang, J. O. Moon, J. Sung and S.-K. Chang, Org. Lett., 2011, 13, 5260–5263 CrossRef CAS PubMed.
- C. Hu, W. Sun, J. F. Cao, P. Gao, J. Y. Wang, J. L. Fan, F. L. Song, S. G. Sun and X. J. Peng, Org. Lett., 2013, 15, 4022–4025 CrossRef CAS PubMed.
- L. Cui, Z. Peng, C. Ji, J. Huang, D. Huang, J. Ma, S. Zhang, X. Qian and Y. Xu, Chem. Commun., 2014, 50, 1485–1487 RSC.
- L. Xiao, J. Tu, S. Sun, Z. Pei, Y. Pei, Y. Pang and Y. Xu, RSC Adv., 2014, 4, 41807–41811 RSC.
- J. Fan, W. Sun, M. Hu, J. Cao, G. Cheng, H. Dong, K. Song, Y. Liu, S. Sun and X. Peng, Chem. Commun., 2012, 48, 8117–8119 RSC.
- M. G. Choi, J. O. Moon, J. Bae, J. W. Lee and S. K. Chang, Org. Biomol. Chem., 2013, 11, 2961–2965 CAS.
- A. K. Mahapatra, S. S. Ali, K. Maiti, S. K. Manna, R. Maji, S. Mondal, M. R. Uddin, S. Mandal and P. Sahoo, RSC Adv., 2015, 5, 81203–81211 RSC.
- A. K. Mahapatra, R. Maji, K. Maiti, S. K. Manna, S. Mondal, S. S. Ali, S. Manna, P. Sahoo, S. Mandal, M. R. Uddin and D. Mandal, RSC Adv., 2015, 5, 58228–58236 RSC.
- A. K. Mahapatra, J. Roy, P. Sahoo, S. K. Mukhopadhyay, A. Banik and D. Mandal, Tetrahedron Lett., 2013, 54, 2946–2951 CrossRef CAS.
- F. Ali, H. A. Anila, N. Taye, D. G. Mogare, S. Chattopadhyay and A. Das, Chem. Commun., 2016, 52, 6166–6169 RSC.
- L. Cui, C. Ji, Z. Peng, L. Zhong, C. Zhou, L. Yan, S. Qu, S. Zhang, C. Huang, X. Qian and Y. Xu, Anal. Chem., 2014, 86, 4611–4617 CrossRef CAS PubMed.
- M. V. R. Raju, E. C. Prakash, H.-C. Chang and H.-C. Lin, Dyes Pigm., 2014, 103, 9–20 CrossRef.
- S. Nagarajan, S. Majumder, U. Sharma, S. Rajendran, N. Kumar, S. Chatterjee and B. Singh, Bioorg. Med. Chem. Lett., 2013, 23, 287–290 CrossRef CAS PubMed.
- M. J. Frisch, G. W. Trucks, H. B. Schlegel, G. E. Scuseria, M. A. Robb, J. R. Cheeseman, G. Scalmani, V. Barone, B. Mennucci, G. A. Petersson, H. Nakatsuji, M. Caricato, X. Li, H. P. Hratchian, A. F. Izmaylov, J. Bloino, G. Zheng, J. L. Sonnenberg, M. Hada, M. Ehara, K. Toyota, R. Fukuda, J. Hasegawa, M. Ishida, T. Nakajima, Y. Honda, O. Kitao, H. Nakai, T. Vreven, J. A. Montgomery Jr, J. E. Peralta, F. Ogliaro, M. Bearpark, J. J. Heyd, E. Brothers, K. N. Kudin, V. N. Staroverov, R. Kobayashi, J. Normand, K. Raghavachari, A. Rendell, J. C. Burant, S. S. Iyengar, J. Tomasi, M. Cossi, N. Rega, J. M. Millam, M. Klene, J. E. Knox, J. B. Cross, V. Bakken, C. Adamo, J. Jaramillo, R. Gomperts, R. E. Stratmann, O. Yazyev, A. J. Austin, R. Cammi, C. Pomelli, J. W. Ochterski, R. L. Martin, K. Morokuma, V. G. Zakrzewski, G. A. Voth, P. Salvador, J. J. Dannenberg, S. Dapprich, A. D. Daniels, Ö. Farkas, J. B. Foresman, J. V. Ortiz, J. Cioslowski and D. J. Fox, Gaussian 09, Revision D.01, Gaussian, Inc, Wallingford CT, 2009 Search PubMed.
Footnote |
| † Electronic supplementary information (ESI) available. CCDC 1479814. For ESI and crystallographic data in CIF or other electronic format see DOI: 10.1039/c6ra14212e |
| This journal is © The Royal Society of Chemistry 2016 |