DOI:
10.1039/C6RA13854C
(Paper)
RSC Adv., 2016,
6, 95780-95788
Chronopharmacokinetics and mechanisms of gefitinib in a nude mice model of non-small cell lung cancer
Received
28th May 2016
, Accepted 11th September 2016
First published on 12th September 2016
Abstract
Circadian rhythms may influence the pharmacokinetics of drugs. This study aimed to investigate the pharmacokinetic characteristics of gefitinib at different dosing times and the underlying mechanisms. The Balb/c nude mice were housed under a constant 12 h light/dark cycle (lights period 7:00 to 19:00) with food and water available ad libitum. The tumor-bearing nude mice model was established and all the mice were randomly divided into six groups and gavaged with gefitinib. The plasma and liver tissues were obtained for pharmacokinetics analysis and used to examine the mRNA expression of metabolic enzymes and its upstream signal. AUC(0–24 h) and MRT(0–24 h) of 1 h and 17 h after light onset (HALO) gefitinib groups were higher. Clearance (CL) in 1 and 17 HALO gefitinib groups were lower and the highest was found in 9 and 13 HALO gefitinib groups. The mRNA expressions of Cyp3a11, Cyp3a13, pregnenolone X receptor (PXR), constitutive androstane receptor (CAR) and brain and muscle ARNT-like-1 (Bmal1) were higher during the late light phase and the early dark phase, while the mRNA expressions of period 1 (Per 1) and period 2 (Per 2) were lower in the same time. These results show that the pharmacokinetic characteristics of gefitinib have significant circadian rhythms, which may be correlated with rhythmic expressions of metabolic enzymes and their upstream signal. This study may provide experimental evidences for clinical pharmacological research.
Introduction
Lung cancer is one of the most common malignant tumors, of which 85% are non-small cell lung cancers (NSCLC). A type of NSCLC called adenocarcinoma, which has epidermal growth factor receptor (EGFR) mutation, account for 40% of lung cancer.1 Gefitinib, a small molecular targeted anti-tumor drug, has been used to treat the EGFR-mutated NSCLC. It is a chemotherapeutic agent that specifically targets the cancer with higher efficacy and smaller adverse reactions.2
The 24 h circadian rhythm exists in organisms, including humans, mammals, and plants. Endogenous rhythms dominate in blood pressure, sleep-wake, activity, hormone secretion, cellular proliferation, apoptosis and metabolism.3–5 In addition, circadian rhythms are related with the occurrence and development of tumors.6 Certain principles of chrono-oncology are applied in selecting optimal times of drug administration based on 24 h circadian rhythm or the differences between normal cells and cancer cells.7 Preclinical studies indicate that oxaliplatin, cisplain and doxorubicin manifest significant circadian rhythms in efficacy and adverse reactions when administrated at different times during 24 h period.8–10 Dihydropyrimidine dehydrogenase (DPD) has circadian rhythm in humans and its activity increases by 40% from midnight to 10:00 a.m. Due to the inhibition of DPD, the plasma concentration of 5-fluorouracil (5-FU) at 5:00 p.m. is higher than that at 5:00 a.m.11 In addition, the plasma granulocyte stimulating factor (G-CSF) levels are significantly higher at 7:00 p.m. than that at 7:00 a.m. in patients with chemotherapy induced leucopenia.12
It has been confirmed that the efficacy of erlotinib was higher when administrated at 8:00 than 20:00.13 However, the pharmacokinetic mechanisms have not been fully understood. This study aimed to explore the chronopharmacokinetic characteristics and underling mechanisms of gefitinib in treatment of NSCLC in nude mice model of NSCLC.
Results
Specificity, limit of quantification (LOQ) and calibration curve
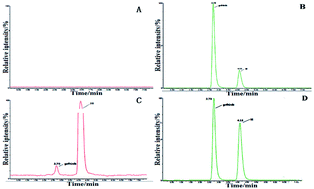
The ion chromatograms of blank plasma and plasma samples are shown in Fig. 1. The retention times of gefitinib and sorafenib were 2.73 and 4.13 min, respectively. They were well separated and had no significant interference by endogenous substances. The LOQ of gefitinib was 0.085 μg L−1.
 |
| Fig. 1 MRM chromatograms for gefitinib and sorafenib (internal standard); (A) blank nude mice plasma; (B) blank plasma containing gefitinib 200 μg L−1 and sorafenib (IS) 2.33 mg L−1; (C) limit of quantification (the concentration of gefitinib was 0.085 μg L−1 and that of sorafenib was 2.33 mg L−1); (D) plasma sample (3 h after oral administration of gefitinib at the dose of 1.0 mg kg−1 at 5 HALO, the concentration of gefitinib and IS were 75.40 μg L−1 and 2.33 mg L−1, respectively). | |
Calibration curve and matrix effect
The linear regression assay of gefitinib indicated that the coefficient index was larger than 0.99 between the linear range of 0.1–200 μg L−1.
The matrix effects of gefitinib were 94.5%, 99.6% and 91.1% at 0.2, 10.0, 200.0 μg L−1. Concerning IS, the matrix effects were 93.2%, 96.4%, and 92.0%. These matrix effects were higher than 90%. It indicated that matrix did not interfere with the ionization of gefitinib and IS.
Accuracy, precision, recovery and stability
Intra- and inter-day precision and accuracy of gefitinib are listed in Table 2. The stability of gefitinib is summarized in Table 3. The recoveries of gefitinib were 102.49 ± 6.19 (low QC sample), 102.00 ± 4.89 (medium QC sample), and 96.41 ± 4.33 (high QC sample), respectively.
Pharmacokinetic parameters
The plasma concentration–time curves of gefitinib of the six circadian groups are shown in Fig. 2. The pharmacokinetic parameters of 1, 5, 9, 13, 17 HALO and 21 HALO of the gefitinib groups were calculated by WinNonlin 6.3. The results are listed in Table 4. This research showed that AUC(0–24 h) and MRT(0–24 h) of 1 and 17 HALO gefitinib groups were higher than those of the other gefitinib groups. CL was lower in 1 and 17 HALO gefitinib groups than that in 5, 9, 13 and 21 HALO gefitinib groups, and it was the highest in 13 HALO gefitinib group.
 |
| Fig. 2 Plasma concentration–time curves of gefitinib in six gefitinib groups the plasma concerntration of gefitinib was detected by HPLC-MS/MS. Each value is the mean with S.D. of 4 mice. | |
Expression levels of metabolic enzymes, clock genes and nuclear receptors
Fig. 3 show the variation tendencies of gene expressions of the model groups during 24 h period. They show that the expression of Cyp3a11, Cyp3a13, PXR, CAR, Per1 and Per2 had significant circadian rhythms. The highest expression levels of Cyp3a11, PXR and CAR were found at 13 HALO (Fig. 3A). The expression of Cyp3a13 peaked at 9, 13 and 17 HALO (Fig. 3A). As for Per1 and Per2, 21 and 9 HALO gefitinib groups had higher expression level than other groups (Fig. 3B). For Bmal1, the peak expression level appeared at 13 and 21 HALO (Fig. 3B).
 |
| Fig. 3 Variation trend of Cyp3a11, Cyp3a13, PXR, CAR, Per1, Per2 and Bmal1 gene expressions in the model groups during 24 h period. The mRNA expression level is normalized by gapdh. Each value is the mean of triplicate wells with S.D. of 3 mice. The expressions of Cyp3a11, Cyp3a13, PXR, CAR, Per1, Per2 and Bmal1 present 24 h variations (P < 0.05, ANOVA). | |
The comparisons of overall gene expression levels among the six circadian groups are shown in Fig. 4. It demonstrated that the overall mRNA expressions of Cyp3a11, PXR and CAR were the highest in the 13 HALO gefitinib group. The mRNA expression level of Cyp3a13 peaked at 5 HALO. For Bmal1, the mRNA expression peaked at 13 HALO. In contrast, the overall mRNA expression of Per1 was the highest at 17 HALO and the lowest at 13 HALO. The overall mRNA expressions of Per 2 were higher in 1, 5 and 17 HALO gefitinib groups than in other gefitinib groups.
 |
| Fig. 4 Comparison of gene expressions among the six circadian groups the mRNA expression level is normalized by gapdh. Each value is the mean of triplicate wells of 3 mice. (A) Comparison of Cyp3a11 mRNA expressions among the six circadian groups; (B) comparison of Cyp3a13 mRNA expressions among the six circadian groups; (C) comparison of PXR mRNA expressions among the six circadian groups; (D) comparison of CAR mRNA expressions among the six circadian groups; (E) comparison of Per1 mRNA expressions among the six circadian groups; (F) comparison of Per2 mRNA expressions among the six circadian groups; (G) comparison of Bmal1 mRNA expressions among the six circadian groups. | |
Discussion and conclusions
Circadian rhythms of biochemical, physiological and behavioral processes which are under the control of clock genes are associated with the effectiveness and toxicity of many drugs which are vary with their dosing times.14,15 Due to the higher sensitivity of gefitinib to EGFR-mutant NSCLC,16 we chose HCC827 cell to establish the nude mice model of NSCLC. Gefitinib is mainly metabolized by CYP3A4 in human, while its homologs were Cyp3a11 and Cyp3a13 in rodents.17,18 In addition, PXR and CAR which target CYP3A4 have been shown to regulate the expression of genes which promote metabolism and elimination of drugs.1,19,20 Hurley (et al.)21 also found that clock genes had correlation with metabolic enzymes. Consequently, we detected the underlying mechanisms of the changes of dosing-time dependent plasma concentrations from the aspect of metabolic enzymes (Cyp3a11 and Cyp3a13) and their upstream signal pathways.
The present study demonstrated that pharmacokinetic characteristics of gefitinib varied with the dosing time in the nude mice model of NSCLC. AUC(0–24 h) and MRT(0–24 h) of 1 and 17 HALO gefitinib groups were higher than those of the other groups. CL of 13 and 9 HALO of gefitinib groups were higher. It suggesting that the elimination was slower and the action time in vivo was longer during the early light phase and the late dark phase.
In the previous chronopharmacological studies of erlotinib, the anti-tumor rate of 8:00 (1 HALO) erlotinib group was higher than that of 20:00 (13 HALO) erlotinib group,13 which was consistant with this study. The circadian rhythm of pharmacology may be related with the rhythmic expression of phosphorylated EGFR. In addition, it also may be related with the downstream signal pathways of EGFR. The pharmacological study and this study indicated that the drug efficacy was better when gavaged erlotinib or gefitinib at the early light phase and the late dark phase.
When comparing Cyp3a11 in the gefitinib groups with that in model groups, we found that they all reached the maximum level at 13 HALO. For Cyp3a13, the common climax time point was 5 HALO. Furthermore, the mRNA expression level of both PXR and CAR peaked at 13 HALO, indicating that the activities of Cyp3a11 and Cyp3a13 were enhanced when gefitinib was administrated at 13 HALO. Several studies also showed that some critical P450 enzymes have significant diurnal rhythm, with higher expression level at dark phase in mice,22 which is in line with our research. mRNA expression of Bmal1 peaked during the same time. It has been reported that Bmal1 and Clock bind to E-box element via D-site binding protein (DBP), thyrotroph embryonic factor (TEF) and hepatic leukemia factor (HIF) to activate Per and Cry. The activation was suppressed by their protein products.23–25 DBP, TEF and HIF influenced the expression of enzymes and regulators, such as cytochrome P450 enzymes and CAR.26,27 Therefore, one possible mechanism accounting for the dosing-time dependent pharmacokinetic changes is that the clock genes influenced the expression of Cyp3a enzyme.
In the current study, we found that the rhythm variation of Per1 and Per2 of gefitinib groups were contrary to that of the model groups. The expressions of Per1 and Per2 may be induced by gefitinib. We also found that the expressions of Per1 and Per2 of administration groups were contrary to those of Cyp3a11 and Cyp3a13. Per1 is tumor suppressor genes of NSCLC.28 Clinical investigation also showed that patients with higher expressions of Per1 and Per2 had a longer survival time than those with lower expressions.29 Thereby, Per1 and Per2 might cause a stronger inhibition on carcinoma cells during the early light phase and the late dark phase.
This study showed that the pharmacokinetic characteristics of gefitinib varied with dosing-times. Furthermore, the circadian rhythmic expressions of metabolic enzymes and its upstream signals (e.g. nuclear receptors and clock genes) seem to influence the dosing-time dependent changes of pharmacokinetics of gefitinib. Our results may provide rational support for clinical chronopharmacology research in gefitinib. In addition, chronopharmacokinetics of getitinib may be related with the organisms activities, the absorption, distribution and excretion of drugs, the blood flow rates of liver and kidney, hormone secretion and so on. Thus, we will perform more studies on the chronopharmacology of gefitinib in the future.
Materials and methods
Chemicals and reagents
Gefitinib (C22H24CIFN4O3, purity 98%) and sorafenib standard (C21H16CIF3N4O3, purity 98%) were purchased from Toronto Research Chemical Inc. (TRC, Toronto, Canda). HPLC-grade acetonitrile and methyl alcohol were purchased from SiYou chemical Co., Ltd. (Tianjin, China). Analytical grade ammonium acetate, sodium hydroxide and ethyl acetate were obtained from FuYu chemical Co., Ltd. (Tianjin, China). Gefitinib tablets (Chinese Drug Approval No. J20100014, 250 mg gefitinib/tablet) were provided by AstraZeneca Pharmaceutical Co., Ltd. Due to their insolubility in water, they were made into suspension with 1% Tween 80,30,31 which was purchased from Solarbio Biotechnology Co., Ltd. (Beijing, China). RPMI 1640, fetal bovine serum (FBS), trypsin and penicillin–streptomycin solution were purchased from HyClone (Beijing, China).
The animal mRNA kit, the Primescript®-RT reagent kit with gDNA Eraser, SYBR® Premix Ex Taq™ II, primer design and synthesis were provided by TaKaRa Biotechnology Co., Ltd. (Dalian, China).
Animals and cells
Specific pathogen-free (SPF) Balb/c nude mice (female, 4 weeks old, 12 ± 2 g) were provided by Vital River Laboratory Animal Technology Co., Ltd. (Beijing, China). The mice were housed 5–6 per cage under a constant 12 h light/dark cycle (lights period 7:00 to 19:00) at (24 ± 2) °C and (50 ± 10)% relative humidity with food and water available ad libitum. All the mice were adapted to their standardized light/dark cycle for two weeks before the experiment. All operations were performed in strict accordance with Animal Ethics Guidelines and approved by Institutional Review Board (IRB) of the No. 401 Hospital of Chinese People's Liberation Army.
HCC827 cells were purchased from cell bank of Chinese Academy of Sciences (Shanghai, China), and maintained at 37 °C in 5% CO2 in RPMI 1640 medium supplemented with 10% fetal bovine serum (FBS) and 1% penicillin–streptomycin solution. Two weeks later, NSCLC model was established by subcutaneous injection of 1.0 × 10⁷ viable HCC827 cells into the right flank of the nude mice.
Experimental design
To investigate the circadian rhythm of the pharmacological effect of gefitinib, 216 female tumor-bearing nude mice (gefitinib group) were randomly divided into 6 groups and given a single dose of 1 mg kg−1 gefitinib suspension at different times (1, 5, 9, 13, 17 and 21 HALO). Thirty female tumor-bearing nude mice which administration of nothing (model group) and 18 female normal nude mice (normal control group) were also randomly assigned into 6 groups. To study the plasma concentration of gefitinib, the mice in each gefitinib group were randomly divided into 9 subgroups. Whole blood specimens were collected into 1.5 mL anticoagulated tube at different time intervals after administration of gefitinib (e.g. 0 h, 15, 30 min, 1, 3, 5, 7, 9, 16, 24 h) and the plasma was stored at −86 °C after centrifugation at 3500 rpm/4 °C until analysis. All the mice were humanly sacrificed after the collection of blood. The livers were collected at 1, 3, 5, 7, 9, 16 and 24 h after administration of gefitinib and taken from normal control group or model group at different gefitinib groups (1, 5, 9, 13 and 21 HALO)on the same day (n = 3 from each group or subgroup).32 The livers were frozen in liquid nitrogen immediately and stored at −86 °C.
Pharmacokinetics
Chromatography and HPLC-MS/MS method. The separation of gefitinib and sorafenib (internal standard, IS) was optimized by adjusting the ratio of acetonitrile and ammonium acetate. When the ratio of acetonitrile and 20 mM ammonium acetate was 65
:
35 (v/v), a perfect peak shape and separation were acquired with a retention time at 2.73 min for gefitinib and 4.13 min for IS. The chromatographic column was XTerraR MS C18 (2.1 × 150 mm, 5 μm, waters) and the mobile phase was delivered at flow rate at 30 °C. The flow rate was detected by API triple quadrupole mass spectrometer (Waters, USA). The MS condition were as follows: the source temperature of electron spray ionization (ESI) was set to 110 °C and the desolvation temperature was set to 150 °C with a desolvation gas flow at 550 L h−1. The capillary voltage was 3 V. The extractor was 2 V and the RF lens was 0.2 V. The optimized cone energies of gefitinib and IS were 25 V and 40 V, respectively. Multiple reaction monitoring (MRM) was used to monitor the parent ion and daughter ion. The parent ion (m/z 447.0) of gefitinib was broken into daughter ion (m/z 99.7) with the collision energies of 50 V. The parent ion (m/z 465.0) of IS was broken into daughter ion (m/z 270.0) with the collision energies of 24 V.
Stock and working standard solutions. Stock solutions containing 0.94 g L−1 gefitinib and 0.067 mg mL−1 sorafenib (IS) were prepared by methyl alcohol. Solutions of gefitinib were diluted into standard curve samples and quality control (QC) samples by 50% methyl alcohol. Solution of IS was diluted into 0.035 g L−1 IS solution. These solutions were stored at −20 °C. The concentrations of QC samples were 0.2 μg L−1 (low QC), 10.0 μg L−1 (medium QC), and 200.0 μg L−1 (high QC) and the concentrations of standard curve samples were 0.1, 0.5, 2.0, 10.0, 50.0, 100.0, and 200.0 μg L−1.
Sample preparation. Plasma samples were thawed to ambient temperature. A 150 μL aliquot of plasma was transferred into 1.5 mL polypropylene microcentrifuge tube. The plasma specimens were spiked with 10 μL IS (0.035 g L−1) as internal reference followed by 50 μL NaOH (0.1 N). The tube was vortexed for 30 s. Next, 1 mL ethyl acetate was added and mixed for 5 min in the vortex mixer. The plasma sample was centrifuged at 15
000 rpm/4 °C for 10 min. Then, the supernatant liquid was transferred into 1.5 mL polypropylene microcentrifuge tube and evaporated to dryness by nitrogen at 45 °C. Mobile phase (150 μL) was added into the tube and mixed for 3.5 min to obtain the solution for HPLC-MS/MS injection.
qRT-PCR analysis. Frozen liver tissue 100 mg was homogenized in 1 mL RNAiso Plus reagent and extracted by chloroform followed by the animal mRNA kit purification. The total RNA was reverse transcribed into cDNA by the Primescript®-RT reagent kit with gDNA Eraser. Then, according to the specification of SYBR® Premix Ex Taq™ II kit, the expressions of metabolic enzymes, clock genes and nuclear receptors were detected by qRT-PCR. The primer sequences are listed in Table 1. The specificity of PCR amplification was detected by the solubility curve. Each sample was detected three times and the mean Ct was obtained. The relative expression levels of genes were presented by the formula 2−ΔΔCt, where ΔΔCt = ΔCt (gefitinib group or model group) −ΔCt (control group) (ΔCt = Cttarget gene − CtGAPDH).
Table 1 Primer sequences used for the qRT-PCR
Gene |
Accession no. |
Primer sequence |
Length (mer) |
GAPDH |
NM_008084.2 |
F:5ʹ-AAATGGTGAAGGTCGGTGTGAAC-3ʹ |
23 |
R:5ʹ-CAACAATCTCCACTTTGCCACTG-3ʹ |
23 |
Cyp3a11 |
NM_007818.3 |
F:5ʹ-CCCTCAGATTATATCCCATTGCT-3ʹ |
23 |
R:5ʹ-CTGCCCTTGTTCTCCTTGCT-3ʹ |
20 |
Cyp3a13 |
NM_007819.4 |
F: 5ʹ-CCCTGCTGTCTCCAACCTTC-3ʹ |
20 |
R: 5ʹ-ATGCTGGTGGGCTTTCCTT-3ʹ |
19 |
PXR |
NM_010936.3 |
F:5ʹ-GATAGCCAACAACGCCCTCT-3ʹ |
20 |
R:5ʹ-CCCTCCTCTCCCACCTAACA-3ʹ |
20 |
CAR |
NM_0098035 |
F:5ʹ-ACAACAGTCTCGGCTCCAAAGTC-3ʹ |
23 |
R:5ʹ-CCTCCAAGCGCTGAAGTTCATA-3ʹ |
22 |
Per1 |
NM_011065.4 |
F:5ʹ-CAGCCGTGCTGCCTACTCATT-3ʹ |
21 |
R:5ʹ-AGAGGCAGCTTGGTGTGTGTC-3ʹ |
21 |
Per2 |
NM_011066.3 |
F:5ʹ-TGGTCTGGACTGCACATCTGG-3ʹ |
21 |
R:5ʹ-AGGTCACTTGACGTGGAGATGG-3ʹ |
22 |
Bmal1 |
NM_007489.4 |
F:5ʹ-CTACGAAGTCGATGGTTCAGTTTCA-3ʹ |
25 |
R:5ʹ-AGCATGCTGTCCATGCTGTG-3ʹ |
20 |
Table 2 Precision, accuracy and recovery for gefitinib
Nominal conc. (μg L−1) |
Intra-day precision (n = 6) |
Inter-day precision (n = 3) |
Recovery/% (n = 6) |
Quantified conc. (μg L−1) |
RSD/% |
RE/% |
Quantified conc. (μg L−1) |
RSD/% |
RE/% |
0.2 |
0.24 ± 0.05 |
19.38 |
118.36 |
0.24 ± 0.04 |
19.13 |
117.76 |
102.49 ± 6.19 |
10.0 |
9.30 ± 0.39 |
4.18 |
93.01 |
10.99 ± 1.60 |
14.56 |
109.87 |
102.00 ± 4.89 |
200.0 |
228.29 ± 2.37 |
1.04 |
114.14 |
227.12 ± 32.92 |
14.50 |
113.56 |
96.41 ± 4.33 |
Table 3 Sample stability for gefitinib (
± s, n = 6)
Nominal conc.(μg L−1) |
0.2 |
10.0 |
200.0 |
Temperature (20 °C) 24 h |
0.223 ± 0.04 |
8.52 ± 0.18 |
174.42 ± 11.49 |
RSD (%) |
19.29 |
2.09 |
6.59 |
RE (%) |
11.68 |
14.79 |
12.79 |
Autosampler (4 °C) 24 h |
0.22 ± 0.04 |
11.47 ± 0.19 |
185.33 ± 23.72 |
RSD (%) |
18.24 |
1.65 |
12.80 |
RE (%) |
7.37 |
14.69 |
−7.34 |
Freeze-thaw (−86 °C) |
0.24 ± 0.04 |
9.88 ± 0.58 |
225.66 ± 20.06 |
RSD (%) |
18.40 |
5.82 |
8.89 |
RE (%) |
19.58 |
−1.23 |
12.83 |
Temperature (−86 °C) 1 month |
0.23 ± 0.04 |
8.51 ± 0.72 |
173.22 ± 18.12 |
RSD (%) |
19.44 |
8.48 |
10.46 |
RE (%) |
12.64 |
−14.93 |
−13.39 |
Table 4 Plasma pharmacokinetic parameters of gefitinib in six gefitinib administration groups in xenograft-bearing nude mice (n = 4)a
Group |
1 HALO |
5 HALO |
9 HALO |
13 HALO |
17 HALO |
21 HALO |
Note: *P < 0.05, compared with 1 HALO gefitinib group; ΔΔP < 0.05, compared with 9 HALO gefitinib group; #P < 0.05, compared with 13 HALO gefitinib group; ΔP < 0.05, compared with 17 HALO gefitinib group; ▲P < 0.05, compared with 21 HALO gefitinib group. |
AUC(0–24 h) (μg L−1 h) |
618.24 ± 24.88 |
480.78 ± 55.23*# |
411.24 ± 70.58* |
388.42 ± 47.54* |
511.18 ± 59.19*# |
494.35 ± 53.24*# |
AUC(0–∞) (μg L−1 h) |
620.16 ± 22.79 |
484.34 ± 52.41*# |
425.69 ± 66.68* |
399.58 ± 41.32* |
515.63 ± 60.7*# |
503.00 ± 60.03*# |
MRT(0–24 h) (h) |
5.75 ± 0.20 |
4.99 ± 0.18*Δ |
5.01 ± 0.22*Δ▲ |
5.03 ± 0.84*Δ▲ |
5.74 ± 0.26 |
5.92 ± 0.58 |
MRT(0–∞) (h) |
5.93 ± 0.4 |
5.21 ± 0.26 |
6.15 ± 0.61 |
5.88 ± 1.09 |
5.86 ± 0.32 |
6.29 ± 0.74 |
Tmax (h) |
3 ± 0ΔΔ |
3 ± 0ΔΔ |
1.5 ± 1 |
2 ± 1.16 |
2 ± 1.16 |
3 ± 0 |
CLz/F (L h−1 kg−1) |
1.61 ± 0.06 |
2.08 ± 0.22*# |
2.40 ± 0.39* |
2.52 ± 0.27* |
1.98 ± 0.27#ΔΔ |
2.00 ± 0*#ΔΔ |
Cmax (μg L−1) |
78.38 ± 10.69 |
83.92 ± 14.29 |
83.50 ± 11.91 |
71.53 ± 13.41 |
79.11 ± 10.70 |
74.01 ± 12.92 |
Statistical analysis. The pharmacokinetic parameters of the six groups were calculated by WinNonlin 6.3. All the analysis was completed by using SPSS 16.0. The statistical significance among groups was determined by ANOVA and least-significant difference (LSD) test. All the data analyst were blinded. A probability level of less than 0.05 was considered to be significant.
Acknowledgements
We would like to thank Department of Pharmacy of the No. 401 Hospital for providing the valuable help. We would like to thank Prof. Linxiang Guo for providing language help and Prof. Zhaori for critical reading of the manuscript.
Notes and references
- H. Brody, Lung cancer, Nature, 2014, 513, S1 CrossRef CAS PubMed.
- M. Zaarour, C. Weerasinghe, B. Nazha, S. Hassan and J. P. Atallah, Epidermal growth factor receptor tyrosine kinase inhibitors in elderly patients with non-small cell lung cancer, Expert Rev. Anticancer Ther., 2015, 15, 1327–1336 CrossRef CAS PubMed.
- M. J. Kim, J. H. Lee and J. F. Duffy, Circadian Rhythm Sleep Disorders, J. Clin. Outcomes Manag., 2013, 20, 513–528 Search PubMed.
- Z. Xie, et al., Smooth-muscle BMAL1 participates in blood pressure circadian rhythm regulation, J. Clin. Invest., 2015, 125, 324–336 Search PubMed.
- U. S. Udoh, et al., Chronic ethanol consumption disrupts diurnal rhythms of hepatic glycogen metabolism in mice, Am. J. Physiol.: Gastrointest. Liver Physiol., 2015, 308, G964–G974 CrossRef PubMed.
- N. B. Zhao, H. Tang, K. Yang and D. Chen, Circadian rhythm characteristics of oral squamous cell carcinoma growth in an orthotopic xenograft model, OncoTargets Ther., 2013, 6, 41–46 CrossRef PubMed.
- G. Cornélissen, et al., Cancer chronomics II. Origins of timing cancer treatment, J. Exp. Ther. Oncol., 2006, 6, 63–72 Search PubMed.
- K. Yang, N. Zhao, D. Zhao, D. Chen and Y. Li, The drug efficacy and adverse reactions in a mouse model of oral squamous cell carcinoma treated with oxaliplatin at different time points during a day, Drug Des., Dev. Ther., 2013, 7, 511–517 CrossRef CAS PubMed.
- M. Kobayashi, et al., Effects of dosing time and schedule on cisplatin-induced nephrotoxicity in rats, J. Pharm. Pharmacol., 2000, 52, 1233–1237 CrossRef CAS PubMed.
- T. G. Granda, et al., Experimental chronotherapy of mouse mammary adenocarcinoma MA13/C with docetaxel and doxorubicin as single agents and in combination, Cancer Res., 2001, 61, 1996–2001 CAS.
- A. Kuwahara, et al., Effect of dose-escalation of 5-fluorouracil on circadian variability of its pharmacokinetics in Japanese patients with Stage III/IVa esophageal squamous cell carcinoma, Int. J. Med. Sci., 2010, 7, 48–54 CrossRef CAS PubMed.
- P. Zarogoulidis, et al., Targeted versus chrono-targeted chemotherapy for inhaled chemotherapy in non-small cell lung cancer, Transl. Lung Cancer Res., 2013, 2, E17–E22 CAS.
- P. P. Lin, et al., Chronopharmacodynamics and mechanisms of antitumor effect induced by erlotinib in xenograft-bearing nude mice, Biochem. Biophys. Res. Commun., 2015, 460, 362–367 CrossRef CAS PubMed.
- R. Li, S. Cheng and Z. Wang, Circadian Clock Gene Plays a Key Role on Ovarian Cycle and Spontaneous Abortion, Cell. Physiol. Biochem., 2015, 37, 911–920 CrossRef CAS PubMed.
- N. Matsunaga, Dosing time based on molecular mechanism of biological clock of hepatic drug metabolic enzyme, Yakugaku Zasshi, 2009, 129, 1357–1365 CrossRef CAS.
- L. Paz-Ares, et al., Pooled analysis of clinical outcome for EGFR TKI-treated patients with EGFR mutation-positive NSCLC, J. Cell. Mol. Med., 2014, 18, 1519–1539 CrossRef CAS PubMed.
- Y. Li, J. S. Ross-Viola, N. F. Shay, D. D. Moore and M. L. Ricketts, Human CYP3A4 and Murine Cyp3A11 are Regulated by Equol and Genistein via the Pregnane X Receptor in a Species-Specific Manner, J. Nutr., 2009, 139, 898–904 CrossRef CAS PubMed.
- H. Komura and M. Iwaki, In vitro and in vivo small intestinal metabolism of CYP3A and UGT substrates in preclinical animals species and humans: species differences, Drug Metab. Rev., 2011, 43, 476–498 CrossRef CAS PubMed.
- E. Q. Qiao, et al., Expression of the PXR gene in various types of cancer and drug resistance, Oncol. Lett., 2013, 5, 1093–1100 CAS.
- D. Li, et al., Genome-wide analysis of human constitutive androstane receptor (CAR) transcriptome in wild-type and CAR-knockout HepaRG cells, Biochem. Pharmacol., 2015, 98, 190–202 CrossRef CAS PubMed.
- J. M. Hurley, J. J. Loros and J. C. Dunlap, The circadian rhythm as an organizer of metabolism, Fungal Genet. Biol., 2015, 90, 39–43 CrossRef PubMed.
- Y. K. Zhang, R. L. Yeager and C. D. Klaassen, Circadian Expression Profiles of Drug-Processing Genes and Transcription Factors in Mouse Liver, Drug Metab. Dispos., 2009, 37, 106–115 CrossRef CAS PubMed.
- J. A. Ripperger and U. Schibler, Rhythmic CLOCK-BMAL1 binding to multiple E-box motifs drives circadian Dbp transcription and chromatin transitions, Nat. Genet., 2006, 38, 369–374 CrossRef CAS PubMed.
- M. Stratmann, D. M. Suter, N. Molina, F. Naef and U. Schibler, Circadian Dbp transcription relies on highly dynamic BMAL1-CLOCK interaction with E boxes and requires the Proteasome, Mol. Cell, 2012, 48, 277–287 CrossRef CAS PubMed.
- S. Ohdo, Chronopharmaceutics: pharmaceutics focused on biological rhythm, Biol. Pharm. Bull., 2010, 33, 159–167 CAS.
- F. Gachon, F. F. Olela, O. Schaad, P. Descombes and U. Schible, The circadian PAR-domain basic leucine zipper transcription factors DBP, TEF, and HLF modulate basal and inducible xenobiotic detoxification, Cell Metab., 2006, 4, 25–36 CrossRef CAS PubMed.
- S. Ohdo, Chronopharmacology Focused on Biological Clock, Drug Metab. Pharmacokinet., 2007, 22, 3–14 CrossRef CAS PubMed.
- S. Gery, et al., Epigenetic Silencing of the Candidate Tumor Suppressor Gene Per1 in Non-Small Cell Lung Cancer, Clin. Cancer Res., 2007, 13, 1399–1404 CrossRef CAS PubMed.
- B. Liu, K. Xu, Y. Jiang and X. Li, Aberrant expression of Per1, Per2 and Per3 and their prognostic relevance in non-small cell lung cancer, Int. J. Clin. Exp. Pathol., 2014, 7, 7863–7871 Search PubMed.
- J. W. Chang, et al., Bisphosphonate zoledronic acid enhances the inhibitory effects of gefitinib on EGFR-mutated non-small cell lung carcinoma cells, Cancer Lett., 2009, 278, 17–26 CrossRef CAS PubMed.
- Y. Chen, M. Z. Wang, W. Zhong and J. Zhao, Pharmacokinetic and pharmacodynamic study of Gefitinib in a mouse model of non-small cell lung cancer carcinoma with brain metastasis, Lung Cancer, 2013, 82, 313–318 CrossRef PubMed.
- J. S. Kloth, et al., Relationship between sunitinib pharmacokinetics and administration time: preclinical and clinical evidence, Clin. Pharmacokinet., 2015, 54, 851–858 CrossRef CAS PubMed.
Footnote |
† These two authors contributed equally to this work and should be considered as co-first authors. |
|
This journal is © The Royal Society of Chemistry 2016 |
Click here to see how this site uses Cookies. View our privacy policy here.