Fe, S co-doped anatase TiO2 nanotubes as anodes with improved electrochemical performance for lithium ion batteries

Jing Fangab, Wenwen Liub, Fan Yub, Furong Qinb, Mengran Wangb, Kai Zhangb and Yanqing Lai*b
aPowder Metallurgy Research Institute of Central South University, Changsha, 410083, China
bSchool of Metallurgy and Environment, Central South University, Changsha, 410083, China. E-mail: laiyanqingcsu@163.com

Received 28th May 2016 , Accepted 10th July 2016

First published on 11th July 2016


Abstract

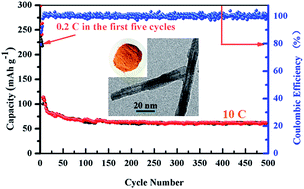
Fe, S co-doped anatase TiO2 nanotubes (FSTNTs), where all of the Fe atoms and most of the S atoms substitute for lattice Ti with only few sulfur atoms replacing with lattice O, are successfully prepared by a facile sol–gel process and subsequent chemical method. The as-prepared products are straight nanotubes with inner diameters of 5–8 nm and outer diameters of 10–30 nm. Owing to the enhancement of both thermodynamic and kinetic properties by the Fe, S dopant pair, the doping level and electrical conductivity of FSTNTs are greatly increased. When firstly used as anodes for lithium ion batteries, the FSTNTs electrodes exhibit excellent cycling stabilities (around 140 mA h g−1 at 4C after 50 cycles and 61.4 mA h g−1 at 10C after 500 cycles) and remarkable rate performances (88.4 mA h g−1 at 10C and 51.5 mA h g−1 at 20C).


Introduction

Transition metal oxides have been focused on as potential anode materials for lithium ion batteries (LIBs) for a long time, because of their ease of large-scale fabrication and high theoretical capacity.1–3 Among them, titanium dioxide (TiO2, titania) with multiple polymorphs (amorphous, anatase, bronze and rutile) has been particularly investigated, because of its natural abundance, low toxicity, small volume expansion and structural stability.4–8 Additionally, the operating voltage of TiO2-based materials is above 0.8 V vs. Li+/Li, where most electrolytes or solvents are not reduced, thus resulting in little formation of solid electrolyte interphase (SEI) film during the charge–discharge process. On the other hand, such a relatively high working voltage can effectively suppress the formation of Li dendrites. Therefore, it exhibits better safety performance than conventional graphite anodes.9,10 However, although the TiO2-based materials possess many advantages, they still face a big challenge because of their intrinsic poor electrical conductivity and low ion diffusion coefficients, which can lead to poor electrochemical performance, thus hindering their commercial application.11,12

Recently, many efforts have been developed to solve these problems, such as designing low-dimension TiO2 nanocomposites, hybridizing with conductive substances and doping with heterogeneous atoms.13,14 Among all the low-dimensional TiO2 nanostructures, nanotubes15–17 have attracted particular interest, as they generally offer high aspect ratio and high specific surface area which can facilitate Li+ transport and diffusion into the TiO2 host lattice. Moreover, introducing heteroatoms (including C,16 N,18 B,19 W,20 Sn21,22 and Fe23 et al.) into TiO2 nanoparticles has been confirmed to be a powerful way to stabilize structure, lower the electronic resistance and accelerate the electrochemical kinetics, which can directly improve the rate capabilities, cycling stability and specific capacities.24,25 Nevertheless, because of the extremely low thermodynamic solubility for most dopants, the single substitutional doping of TiO2 faces a challenging obstacle.26 Once the dopants locate at undesirable interstitial sites, it may not be helpful for them to provide mobile charge carriers. Therefore, a co-doping idea has been presented to circumvent such fundamental limitations.26,27 So far, only a few co-doping (including C, N;28,29 F, N;30 Cr, N26 and S, N31) of TiO2 nanoparticles have been used as anode materials in LIBs. According to the previous research in the photocatalysis field,32 it has been demonstrated that the Fe, S co-dopant pairs can substantially narrow the band gap and effectively modify the electronic structures of TiO2. However, as far as we have known, the Fe, S co-doped TiO2 nanotubes have not been applied in the lithium storage yet.

Hence, we firstly present a facile sol–gel process and subsequent chemical method to prepare Fe, S co-doped TiO2 nanotubes (FSTNTs), where all of Fe atoms and most of S atoms substitute for lattice Ti with only few S atoms replacing with lattice O, thus largely narrowing the band gap and enhancing the conductivity of TiO2. The as-prepared products are straight nanotubes with inner diameters of 5–8 nm and outer diameters of 10–30 nm in anatase-type. Because of the enhancement in electrical conductivity and lithium ion diffusion coefficient after Fe, S co-doping, together with the nanotube structures and small primary nanocrystals, the resultant FSTNTs show an improved electrochemical performance, including excellent cycling stabilities and remarkable rate performances.

Experimental

Preparation of Fe, S co-doped TiO2

Fe, S co-doped TiO2 (FST) was synthesized by a simple sol–gel method, using tetrabutyl titanate (TBOT), FeCl3·6H2O and thiourea as raw materials. All chemicals were used without any further purification. Typically, 5 ml of TBOT was homogenously dispersed in 20 ml of absolute ethanol, named as solution 1. Meanwhile, 0.48 g of FeCl3·6H2O and 0.274 g of thiourea were dissolved in another 20 ml of absolute ethanol under vigorous stirring until the mixture turned into clear and uniform solution, named as solution 2. Subsequently, the solution 2 was added dropwise into solution 1 with strong stirring for 2 h to form a homogenous sol. After that, the sol was placed at room temperature for 12 h and then transfer to an oven at 80 °C for another 12 h to remove the solvent, thus forming a fulvous gel. The gel was dried at 110 °C and subsequently crushed well in a agate mortar. Finally, the prepared powers were calcined in the muffle furnace at 500 °C for 3 h under air atmosphere. As comparison, the Fe-doped TiO2, S-doped TiO2 and pure TiO2 were prepared under otherwise identical conditions, only with 0.48 g of FeCl3·6H2O or 0.274 g of thiourea as additive or without any additive.

Preparation of Fe, S co-doped TiO2 nanotubes

The FST nanoparticles were converted into Fe, S co-doped TiO2 nanotubes (FSTNTs) by a chemical process, which is similar to the previous literature.33 Briefly, 0.5 g of FST powers were added into 100 ml of a 10 M NaOH aqueous solution in a 200 ml polytetrafluoroethylene beaker with vigorous stirring for 2 h to form a uniform mixture. Subsequently, the mixture was transferred into a 150 ml Teflon-lined autoclave under static conditions (150 °C) for another 24 h. After cooled down to room temperature, the powders were filtered and rinsed by distilled water and 0.1 M HCl several times until the pH value reached 7. Finally, after oven-drying, the solid samples were calcined in the muffle furnace at 500 °C for 3 h under air atmosphere. The preparation of Fe-doped TiO2 nanotubes (FTNTs), S-doped TiO2 nanotubes (STNTs) and pure TiO2 nanotubes (TNTs) were repeated as in the above mentioned process.

Materials characterization

The morphologies and particle sizes of the as-prepared samples was investigated by transmission electron microcopy (TEM, Tecnai G2 20ST). Energy-dispersive X-ray spectroscopy (EDS) was applied to identify the elements on the surfaces of the materials. The crystalline phase and chemical state of the whole samples were characterized by X-ray diffraction (XRD, Rigaku 3014) using Cu Kα radiation and X-ray photoelectron spectroscopy (XPS, ESCA LAB 250Xi), respectively. A Quantachrome instrument (Quabrasorb SI-3MP) was used to analyze the surface area and pore size distribution of FSTNTs by N2 adsorption–desorption measurements at 77 K.

Electrochemical measurements

In order to perform the electrochemical measurements, CR2025-type coins were assembled in a argon-filled glove box with lithium plates serving as the counter and reference electrodes. The working electrodes were prepared by mixing 70 wt% of active materials, 20 wt% of super p and 10 wt% of polyvinylidenefluoride in N-methyl pyrrolidinone. The resultant slurry was homogenously spread onto a copper foil with a blade. After drying at 80 °C overnight, the electrodes were cut into pellets and the average mass loading of the active materials is 1–1.2 mg cm−2. The electrolyte was 1 M LiPF6 in a 1[thin space (1/6-em)]:[thin space (1/6-em)]1[thin space (1/6-em)]:[thin space (1/6-em)]1 volume mixture of ethylene carbonate, ethyl methyl carbonate and dimethyl carbonate. The separator was Celgard-2400. Galvanostatic testing was carried out with LAND CT2001A battery-testing instrument over the potential range of 3 to 1 V (vs. Li+/Li). The electrochemical impedance spectroscopy (EIS) and cyclic voltammetry (CV) measurements were conducted using Solartron 1470e cell test system. All tests were operated at 25 °C.

Results and discussion

Fig. 1 shows the detailed synthetic procedure of FSTNTs. Typically, the hydrolysis of TBOT in absolute ethanol was carried out by introducing thiourea and FeCl3·6H2O solution into the reaction system under vigorous stirring. After still standing for 12 h at the room temperature, the as-prepared gel was dried and followed by calcining at 500 °C for 3 h under air atmosphere, forming fulvous FST solids. Next, the FST was treated with alkaline hydrothermal reaction followed by rinsing and air dying, and then, the antic orange FSTNTs were successfully synthesised. The X-ray diffraction (XRD) patterns of the whole materials are displayed in Fig. 2a. All the main reflections can be indexed to the anatase TiO2 phase (JCPDS no. 21-1272). Obviously, after Fe doping, the (101) diffraction peaks of FSTNTs and FTNTs shift to a lower angle (the inset of Fig. 2a) and the lattice parameters of d101 are increased slightly (Table S1), which is obtained by the larger ionic radius of doped Fe3+ (0.65 Å) than Ti4+ (0.606 Å), suggesting that the Fe atoms have been successfully incorporated into the crystal structure of TiO2. However, when TiO2 is only doped with sulfur, a minimal shift toward higher angle is observed in the (101) diffraction (the inset of Fig. 2a). This phenomenon can be attribute to the larger radius of Ti4+ (0.606 Å) than that of S4+ (0.37 Å) and S6+ (0.29 Å), which is in good agreement with the previous literature.34 Additionally, the diffraction (101) peaks of doped TiO2 are broader than that of pure TiO2, suggesting that smaller nanocrystals have formed because of doping. On the basis of the Scherrer formula,35 the average crystallite size of FSTNTs, FTNTs, STNTs and TNTs are estimated to be approximately 16.30, 17.31, 15.12, and 20.33 nm, respectively (Table S1). This is totally because that the addition of additives has a suppressive effect on the crystal growth of TiO2, just as Yu et al. reported.36
image file: c6ra13850k-f1.tif
Fig. 1 Schematic illustration of the synthesis processes of FSTNTs.

image file: c6ra13850k-f2.tif
Fig. 2 The XRD patterns (a) and high-resolution XPS spectra of pure and doped TiO2. Ti 2p (b); Fe 2p (c); S 2p (d).

X-ray photoelectron spectroscopy (XPS) analysis was employed to identify the valence states of the whole samples. As presented in Fig. 2b, the most intense peaks with binding energies at ∼458 and ∼464 eV correspond to Ti 2p1/2 and Ti 2p3/2 spin–orbit splitting peaks, which suggests Ti4+ is the predominant state of the Ti element.37,38 Moreover, in contrast with FTNTs and TNTs, both FSTNTs and STNTs have a Ti 2p shift toward lower energy after S doping, which is caused by the difference of ionization energy of Ti and S, and it is consistent with the previous report.39 Fig. S1 shows the O 1s XPS spectra of FSTNTs, which can be fitted as two peaks. The energy of the first accurate peak located at 530.4 eV is equal to the O 1s electron binding energy for TiO2.24 The other peak at 531.4 eV is ascribed to S–O–S bond, which confirms that the sulfur atoms replace with part of Ti sites.34 Fig. 2c shows the high-resolution XPS spectrum of Fe 2p, where the binding energy locating at 710.5 (Fe 2p3/2) and 720.4 (Fe 2p1/2) can be easily observed, indicating that the doped Fe is mainly in +3 oxidation state.40 Due to the similarities of the radius between Fe3+ (0.65 Å) and Ti4+ (0.606 Å), the Fe3+ can be incorporated into the lattice of TiO2 to form Ti–O–Fe bonds.41 The S 2p spectra (the inset of Fig. 2d) can be resolved as two pairs of S 2p3/2 and S 2p1/2 at 162.8/164 eV and 168.3/170 eV, corresponding to S2− and S6+, respectively.42 Obviously, the S atoms are doped mainly as S6+. This is totally because the substitution of Ti4+ by S6+ is easier than replacing O2− by S2−, if thiourea is used as sulfur precursor, just as the previous studies reported.43 According to the results of the XPS spectrum, the atom ratios of Fe, S, Ti and O in FSTNTs are approximately 2.23%, 3.09%, 30.14% and 64.54%, respectively.

The morphology and size of the FSTNTs (Fig. 3a) and FST (Fig. S2) samples were studied by TEM. As shown in Fig. S2, it is easily observed that the FST particles are granular crystals with diameter of 20–30 nm. After hydrothermal reaction in alkaline solution, a large number of the tubular crystals are observed in the FSTNTs samples (Fig. 3a). The as-prepared nanotubes are several hundred nanometers in length with inner and outer diameter of 5–8 nm and 10–30 nm. Moreover, these FSTNTs show a relatively high Brunauer–Emmett–Teller (BET) specific surface area of 83.42 m2 g−1 and the Barrett–Joyner–Halenda (BJH) adsorption average pore diameter is 16.05 nm (N2 adsorption–desorption isotherms are given in Fig. S3). The selected-area electron diffraction (SAED) patterns of FSTNTs sample are presented in Fig. S4, further indicating the polycrystalline nature of the FSTNTs sample and each of the diffraction rings can correspond to anatase TiO2, which agrees well with the XRD patterns (Fig. 2a). Additionally, there is no visible gap observing between the nanocrystals, implying a better mechanical integrity of the nanotubes.35 The high-resolution transmission electron microscopy (HRTEM) image of the FSTNTs sample (Fig. 2b) shows that the interference fringe spacing of the nanotubes is about 0.353 nm, which can be indexed to the interplanar distance of the (101) plane in anatase phase. The result of the energy-dispersive X-ray spectroscopy (EDS) analysis (Fig. S5) shows that the nanotubes contain the elements Ti, O, Fe and S. Additional Cu peaks are because of lacey support films which are used for fixing of the samples. Additionally, the EDS mapping images in Fig. S6a–e demonstrate that the Ti elemental mapping image overlaps with the O elemental mapping, further indicating the as-prepared product is TiO2. Moreover, it also confirms that the Fe, S atoms are homogeneously dispersed on/in the surface and bulk layer of the TiO2 particles. This remarkable structural stability is expected to be conducive to reversible lithium storage with excellent cycle performances.


image file: c6ra13850k-f3.tif
Fig. 3 The TEM images at different resolutions (a) and HRTEM (b) of FSTNTs.

In order to investigate the effect of co-doping in TiO2 on the electrochemical performances, galvanostatic charge–discharge cycling and cyclic voltammetry (CV) of pure and doped TiO2 electrodes were conducted using lithium half-cells. In principle, the reaction equation as follows can be used to express the lithium insertion and extraction in anatase TiO2 electrode:

 
TiO2 + nLi+ + ne ↔ LinTiO2 (1)

The theoretical capacity of anatase has been reported as 336 mA h g−1 (n = 1), while the maximum insertion coefficient n is known to be 0.5 for the fully reversible reaction, leading to a capacity of 168 mA h g−1.44–47 Fig. 4a exhibits the voltage profiles of the first cycle for all the electrodes in the range of 1–3 V vs. Li+/Li at 0.2C. Obviously, all of curves show two distinct plateaus, which correspond to lithium insertion and extraction in the anatase phase. Furthermore, in comparison with other three electrodes, the discharge plateau of the FSTNTs electrode is the highest (∼1.78 V), while its charge plateau is lowest (∼1.89 V), indicating the lowest electrochemical polarization and the best charge–discharge reversibility of TiO2-based electrode,16,26 which can be ascribed to the improvement of electronic conductivity by Fe, S co-doping.48,49 In addition, the sloping region for the FSTNTs electrode below the plateau corresponds to the pseudo-capacitive lithium storage in the surface area.29,44,50 The capacitance is given by

 
image file: c6ra13850k-t1.tif(2)


image file: c6ra13850k-f4.tif
Fig. 4 (a) The voltage profiles of the first cycle for all the electrodes in the range of 1–3 V vs. Li+/Li at a rate of 0.2C. The initial CV curves of the FSTNTs (b) and TNTs (c) electrodes at different scan rates.

It was reported44 that the specific capacity (dc) is proportional to the time interval (dt) for galvanostatic operation, therefore

 
image file: c6ra13850k-t2.tif(3)

This shows that the shallowest slope (dV/dc) observed with the FSTNTs electrode represents the highest capacitance values than the steep slopes from the other three kinds of electrodes, thus increasing the capacity of TiO2. Fig. 4b and c show the initial CV curves of the FSTNTs and TNTs electrodes at different scan rates in the range of 0.05–1 mV s−1, respectively, which is aimed to investigate the effect of the co-doping on the lithium ion diffusivity between FSTNTs and TNTs electrodes. The diffusion coefficient of lithium ion during the Li+ (de-)intercalation processes can be calculated according to the classic Randles–Sevcik equation (eqn (4))26 at room temperature, where n, A, C, D and v represent the charge-transfer number, the contact area between working electrode and electrolyte, the concentration of Li+, the diffusion coefficient of Li+ and the scan rate, respectively.

 
Ipeak = 269[thin space (1/6-em)]000n3/2AD1/2Cv1/2 (4)

Fig. S7a and b show the linear relationship between Ipeak and v1/2 for FSTNTs and TNTs electrodes, respectively. According to the slopes of the fitting lines, the diffusion coefficients of Li+ in FNTNTs electrode are calculated as 1.504 × 10⁻⁸ and 1.398 × 10⁻⁸ cm2 s−1 for extraction and insertion, respectively, which are around one hundred times higher than TNTs electrode (2.404 × 10⁻¹⁰ and 1.398 × 10⁻¹⁰ cm2 s−1 for extraction and insertion, respectively), suggesting that the diffusion of Li+ is greatly improved by co-doping with iron and sulfur. Therefore, the rate capacity of the FSTNTs electrode could be largely increased. Moreover, the CV curves at a scan rate of 0.2 mV s−1 of FSTNTs electrode (Fig. S8) are stable with almost overlaps from the second cycle, indicating excellent stability of FSTNTs electrode. Obviously, there is a slight shift of the cathodic peak occurring in the following four cycles owing to irreversible reactions between TiO2 and the electrolyte, which is common in most TiO2-based anodes for LIBs.51,52

Fig. 5a shows the cycling performance of all as-prepared materials at an invariable current density of 4C. Clearly, the doped materials exhibit better performance than that of TNTs material, while the FSTNTs electrode possesses the highest specific capacity. Specifically, after 50 cycles, the reversible capacity of FSTNTs keeps 138.3 mA h g−1, which is about three times higher than that of STNTs (48.2 mA h g−1) and FSTNTs (55.6 mA h g−1), even over ten times higher than that of TNTs (11.7 mA h g−1). To further evaluate the long cycling stability at a high rate, the FSTNTs sample was tested at a constant rate of 10C over 500 cycles after the initial five cycles at 0.2C, as presented in Fig. 5b. In the first cycle, the irreversible capacity is about 26 mA h g−1 and the coulombic efficiency reaches 89.7%, which can be ascribed to lithium intercalation into irreversible sites and side reaction with trace humidity adsorbed by the high surface area. Fortunately, in the subsequent cycles, the irreversible sites are gradually filled completely and the trace water is gradually consumed, so the discharge–charge processes of FSTNTs electrode tend to stabilization.16,53 Even after 500 cycles, the FSTNTs electrode still affords a remarkable reversible capacity of 61.4 mA h g−1 with a coulombic efficiency larger than 99.8%. These results are among the above average values of most co-doped TiO2 electrodes reported previously shown in Table 1. Fig. 5c shows the rate performance of the whole sample-based electrodes at the discharge–charge rates between 0.2C and 20C. In contrast to other three electrode, the FSTNTs electrode exhibits the best rate performance. Specifically, the discharge specific capacities of 320.4, 212.5, 164.5, 147.3, 126.3, 88.4 and 51.6 mA h g−1 are recorded at increasing current rates of 0.2, 0.4, 1, 2, 4, 10 and 20C, respectively. It is noteworthy that a reversible specific capacity of 166.3 mA h g−1 can be maintained, when the current density recovers to 1C after the high rate discharge–charge cycling. These results clearly demonstrate that the FSTNTs electrodes exhibit superior lithium storage properties with prolonged cycle life and great rate capability for the fast charge–discharge process.


image file: c6ra13850k-f5.tif
Fig. 5 Cycling performance of all the as-prepared samples at a constant current density of 4C (a) and 10C (b); (c) the rate performance of the whole samples.
Table 1 The comparison of different co-doped TiO2 as anode for LIBs
Sample Cycle performance Ref.
S, N co-doped anatase TiO2 63.5 mA h g−1 at 10C after 40 cycles 31
C, N co-doped mesoporous anatase TiO2 Over 160 mA h g−1 at 1C after 100 cycles 28
F, N co-doped anatase TiO2 ∼75 mA h g−1 at ∼0.19C after 60 cycles 30
F, N co-doped rutile TiO2 ∼150 mA h g−1 at ∼0.19C after 60 cycles
C, N co-doped anatase TiO2 156.7 mA h g−1 at ∼5.95C after 150 cycles 29
Cr, N co-doped anatase TiO2 microspheres 159.6 mA h g−1 at 5C after 300 cycles 26
Fe, S co-doped anatase TiO2 nanotubes ∼140 mA h g−1 at 4C after 50 cycles; 61.4 mA h g−1 at 10C after 500 cycles In this work


The best high-rate prosperities of the FSTNTs electrodes than the other three samples are ascribed to their significantly enhanced electronic conductivities, as shown in Fig. 6. Electrochemical impedance spectroscopy (EIS) was implemented for the whole electrodes before cycling with frequency from 0.01 Hz to 100 kHz. Clearly, all of the Nyquist plots have a similar characteristic, including one depressed semicircle at high frequencies and a straight line at low frequencies, which correspond to the charge-transfer process and lithium-ion diffusion, respectively.54 All curves are fitted with a typical equivalent circuit (the inset of Fig. 6), where Rs is the ohmic resistance of the electrolyte, CPE1 represent the constant phase element and Rct stands for the charge transfer. Wo1 represents the diffusion controlled Warburg impedance.55 Table S2 compares the fitted impedance parameters of all of the TiO2-based electrodes according to the equivalent circuit. It can be easily seen that the Rs values of the whole samples are almost the same, while the FSTNTs electrode possesses the lowest Rct values (44.89 Ω), implying the smallest charge transfer resistance and highest electronic conductivity due to the co-doping with Fe and S, which is due to the fully modified electronic structure resulting from the uniform distribution of substitutional Fe, S co-dopants throughout the whole TiO2 nanotubes.26


image file: c6ra13850k-f6.tif
Fig. 6 The Nyquist plots of the whole electrodes before cycling and the equivalent circuit model (inset).

The improved electrochemical properties of the as-synthesized FSTNTs anodes for LIBs can be ascribed to the synergic effect of the nanotubes structure and the co-doping with iron and sulfur. Firstly, the primary nanocrystals with small size shorten the electronic and lithium ion diffusion pathway, leading to good rate capability. Secondly, a larger interlayer spacing in the FSTNTs guarantees a more favorable lithium insertion and extraction, thus increasing the lithium storage capacity. Thirdly, the relative high surface area of the nanotube structure could provide more active surface sites and facilitate fast lithium ion transfer between electrode and electrolyte. Moreover, the electronic conductivity and lithium ion diffusion coefficient of FSTNTs are significantly increased. Therefore, the electrochemical performance of FSTNTs is greatly enhanced.

Conclusions

In summary, Fe, S co-doped anatase TiO2 nanotubes have been successfully synthesized by a facile and suitable sol–gel method and subsequent chemical process. Owing to the enhancement of Fe, S dopant pair of both the thermodynamic and the kinetic solubility, the electronic conductivity and lithium ion diffusion coefficient of FSTNTs are significantly improved. Combining with the nanotubes structure, small primary nanoparticles and larger interlayer spacing, these FSTNTs exhibit superior lithium storage properties with excellent cycling stability for 500 cycles at 10C and remarkable rate capability up to 20C. These results indicate that the FSTNTs are expected to be useful for the development of high performance TiO2-based anodes for LIBs.

Acknowledgements

The authors acknowledge the financial support from China Postdoctoral Science Foundation project (Grant no. 2015M572265), National Natural Science Foundation of China (Grant no. 51404304) and the Innovation driven project of Central South University (Grant no. 2015cx001). The authors also thank other supports from the Engineering Research Centre of Advanced Battery Materials, the Ministry of Education, China.

Notes and references

  1. J. Wang, Q. Zhang, X. Li, B. Zhang, L. Mai and K. Zhang, Nano Energy, 2015, 12, 437–446 CrossRef CAS.
  2. C. Lv, X. Yang, A. Umar, Y. Xia, Y. Jia, L. Shang, T. Zhang and D. Yang, J. Mater. Chem. A, 2015, 3, 22708–22715 CAS.
  3. J. Wang, Q. Zhang, X. Li, D. Xu, Z. Wang, H. Guo and K. Zhang, Nano Energy, 2014, 6, 19–26 CrossRef CAS.
  4. R. Wang, X. Xue, W. Lu, H. Liu, C. Lai, K. Xi, Y. Che, J. Liu, S. Guo and D. Yang, Nanoscale, 2015, 7, 12833–12838 RSC.
  5. P. G. Bruce, B. Scrosati and J. M. Tarascon, Angew. Chem., Int. Ed., 2008, 47, 2930–2946 CrossRef CAS PubMed.
  6. J. S. Chen, L. A. Archer and X. Wen Lou, J. Mater. Chem., 2011, 21, 9912 RSC.
  7. S. Liu, Z. Wang, C. Yu, H. B. Wu, G. Wang, Q. Dong, J. Qiu, A. Eychmuller and X. W. David Lou, Adv. Mater., 2013, 25, 3462–3467 CrossRef CAS PubMed.
  8. M. Vijayakumar, S. Kerisit, C. Wang, Z. Nie, K. M. Rosso, Z. Yang, G. Graff, J. Liu and J. Hu, J. Phys. Chem. C, 2009, 113, 14567–14574 CAS.
  9. W. Li, F. Wang, Y. Liu, J. Wang, J. Yang, L. Zhang, A. A. Elzatahry, D. Al-Dahyan, Y. Xia and D. Zhao, Nano Lett., 2015, 15, 2186–2193 CrossRef CAS PubMed.
  10. H. Ren, R. Yu, J. Wang, Q. Jin, M. Yang, D. Mao, D. Kisailus, H. Zhao and D. Wang, Nano Lett., 2014, 14, 6679–6684 CrossRef CAS PubMed.
  11. P. Acevedo-Peña, M. Haro, M. E. Rincón, J. Bisquert and G. Garcia-Belmonte, J. Power Sources, 2014, 268, 397–403 CrossRef.
  12. Z. Chen, I. Belharouak, Y. K. Sun and K. Amine, Adv. Funct. Mater., 2013, 23, 959–969 CrossRef CAS.
  13. Y. G. Guo, Y. S. Hu, W. Sigle and J. Maier, Adv. Mater., 2007, 19, 2087–2091 CrossRef CAS.
  14. Y. Yang, X. Ji, M. Jing, H. Hou, Y. Zhu, L. Fang, X. Yang, Q. Chen and C. E. Banks, J. Mater. Chem. A, 2015, 3, 5648–5655 CAS.
  15. V. Gentili, S. Brutti, L. J. Hardwick, A. R. Armstrong, S. Panero and P. G. Bruce, Chem. Mater., 2012, 24, 4468–4476 CrossRef CAS.
  16. J. Xu, Y. Wang, Z. Li and W. F. Zhang, J. Power Sources, 2008, 175, 903–908 CrossRef CAS.
  17. G. S. Zakharova, C. Jähne, A. Popa, C. Täschner, T. Gemming, A. Leonhardt, B. Büchner and R. Klingeler, J. Phys. Chem. C, 2012, 116, 8714–8720 CAS.
  18. Y. Zhang, F. Du, X. Yan, Y. Jin, K. Zhu, X. Wang, H. Li, G. Chen, C. Wang and Y. Wei, ACS Appl. Mater. Interfaces, 2014, 6, 4458–4465 CAS.
  19. J.-H. Jeong, D.-w. Jung, E. W. Shin and E.-S. Oh, J. Alloys Compd., 2014, 604, 226–232 CrossRef CAS.
  20. Y. Wang, T. Chen and Q. Mu, J. Mater. Chem., 2011, 21, 6006 RSC.
  21. M. Lübke, I. Johnson, N. M. Makwana, D. Brett, P. Shearing, Z. Liu and J. A. Darr, J. Power Sources, 2015, 294, 94–102 CrossRef.
  22. J. Li, D. Yang, X. Zhu, L. Wang, A. Umar and G. Song, Sci. Adv. Mater., 2015, 7, 269–280 CrossRef.
  23. C. Andriamiadamanana, C. Laberty-Robert, M. T. Sougrati, S. Casale, C. Davoisne, S. Patra and F. Sauvage, Inorg. Chem., 2014, 53, 10129–10139 CrossRef CAS PubMed.
  24. Y. Lai, W. Liu, J. Fang, F. Qin, M. Wang, F. Yu and K. Zhang, RSC Adv., 2015, 5, 93676–93683 RSC.
  25. M. Fehse, S. Cavaliere, P. E. Lippens, I. Savych, A. Iadecola, L. Monconduit, D. J. Jones, J. Rozière, F. Fischer, C. Tessier and L. Stievano, J. Phys. Chem. C, 2013, 117, 13827–13835 CAS.
  26. Z. Bi, M. P. Paranthaman, B. Guo, R. R. Unocic, H. M. Meyer Iii, C. A. Bridges, X.-G. Sun and S. Dai, J. Mater. Chem. A, 2014, 2, 1818–1824 CAS.
  27. S. B. Zhang, J. Phys.: Condens. Matter, 2002, 14, R881–R903 CrossRef CAS.
  28. H. Ming, X. Li, L. Su, M. Liu, L. Jin, L. Bu, Z. Kang and J. Zheng, RSC Adv., 2013, 3, 3836 RSC.
  29. C. Lai, X. C. Yuan, X. L. Cao, Q. Q. Qiao, Y. L. Wang and S. H. Ye, Electrochem. Solid-State Lett., 2012, 15, A65 CrossRef CAS.
  30. C. T. Cherian, M. V. Reddy, T. Magdaleno, C.-H. Sow, K. V. Ramanujachary, G. V. S. Rao and B. V. R. Chowdari, CrystEngComm, 2012, 14, 978–986 RSC.
  31. W. Jiao, N. Li, L. Wang, L. Wen, F. Li, G. Liu and H. M. Cheng, Chem. Commun., 2013, 49, 3461–3463 RSC.
  32. M. Hamadanian, A. Reisi-Vanani, M. Behpour and A. S. Esmaeily, Desalination, 2011, 281, 319–324 CrossRef CAS.
  33. T. Kasuga, M. Hiramatsu, A. Hoson, T. Sekino and K. Niihara, Adv. Mater., 1999, 11, 1307–1311 CrossRef CAS.
  34. M. R. Bayati, A. Z. Moshfegh and F. Golestani-Fard, Mater. Lett., 2010, 64, 2215–2218 CrossRef CAS.
  35. G. Zhang, H. B. Wu, T. Song, U. Paik and X. W. Lou, Angew. Chem., Int. Ed., 2014, 53, 12590–12593 CAS.
  36. J. Yu, C. Y. Jimmy and X. Zhao, J. Sol-Gel Sci. Technol., 2002, 24, 95–103 CrossRef CAS.
  37. H. Usui, S. Yoshioka, K. Wasada, M. Shimizu and H. Sakaguchi, ACS Appl. Mater. Interfaces, 2015, 7, 6567–6573 CAS.
  38. D. Yan, C. Yu, Y. Bai, W. Zhang, T. Chen, B. Hu, Z. Sun and L. Pan, Chem. Commun., 2015, 51, 8261–8264 RSC.
  39. J. Ni, S. Fu, C. Wu, J. Maier, Y. Yu and L. Li, Adv. Mater., 2016, 28, 2259–2265 CrossRef CAS PubMed.
  40. Y. Zhang, H. Shen and Y. Liu, J. Nanopart. Res., 2016, 18, 1–18 CrossRef.
  41. J. Yu, Q. Xiang and M. Zhou, Appl. Catal., B, 2009, 90, 595–602 CrossRef CAS.
  42. P. Anil Kumar Reddy, P. Venkata Laxma Reddy, V. Maitrey Sharma, B. Srinivas, V. D. Kumari and M. Subrahmanyam, J. Water Resour. Prot., 2010, 02, 235–244 CrossRef.
  43. T. Ohno, M. Akiyoshi, T. Umebayashi, K. Asai, T. Mitsui and M. Matsumura, Appl. Catal., A, 2004, 265, 115–121 CrossRef CAS.
  44. K. Zhu, Q. Wang, J.-H. Kim, A. A. Pesaran and A. J. Frank, J. Phys. Chem. C, 2012, 116, 11895–11899 CAS.
  45. D. Dambournet, I. Belharouak and K. Amine, Chem. Mater., 2010, 22, 1173–1179 CrossRef CAS.
  46. J. S. Chen, Y. L. Tan, C. M. Li, Y. L. Cheah, D. Luan, S. Madhavi, F. Y. Boey, L. A. Archer and X. W. Lou, J. Am. Chem. Soc., 2010, 132, 6124–6130 CrossRef CAS PubMed.
  47. J. Y. Shin, D. Samuelis and J. Maier, Adv. Funct. Mater., 2011, 21, 3464–3472 CrossRef CAS.
  48. Z. Tian, Z. Zhou, S. Liu, F. Ye and S. Yao, Solid State Ionics, 2015, 278, 186–191 CrossRef CAS.
  49. Y.-F. Long, J. Su, X.-R. Cui, X.-Y. Lv and Y.-X. Wen, Solid State Sci., 2015, 48, 104–111 CrossRef CAS.
  50. J. Wang, J. Polleux, A. James Lim and B. Dunn, J. Phys. Chem. C, 2007, 111, 14925–14931 CAS.
  51. X. Du, Q. Wang, T. Feng, X. Chen, L. Li, L. Li, X. Meng, L. Xiong, X. Sun, L. Lu and Y. Xu, Sci. Rep., 2016, 6, 20138 CrossRef CAS PubMed.
  52. Z. Jin, M. Yang, J. Wang, H. Gao, Y. Lu and G. Wang, Chem.–Eur. J., 2016, 22, 6031–6036 CrossRef CAS PubMed.
  53. J. Li, Z. Tang and Z. Zhang, Electrochem. Solid-State Lett., 2005, 8, A316 CrossRef CAS.
  54. J. Li, F. Qin, L. Zhang, K. Zhang, Q. Li, Y. Lai, Z. Zhang and J. Fang, J. Mater. Chem. A, 2014, 2, 13916 CAS.
  55. J. Wang, X. Li, Z. Wang, B. Huang, Z. Wang and H. Guo, J. Power Sources, 2014, 251, 325–330 CrossRef CAS.

Footnote

Electronic supplementary information (ESI) available. See DOI: 10.1039/c6ra13850k

This journal is © The Royal Society of Chemistry 2016
Click here to see how this site uses Cookies. View our privacy policy here.