Ionic liquid-based uranium(VI) extraction with malonamide extractant: cation exchange vs. neutral extraction

Clotilde Gaillard*a, Maria Boltoevabc, Isabelle Billardde, Sylvia Georgbc, Valérie Mazanbc and Ali Ouadibc
aInstitut de Physique Nucléaire de Lyon, Université de Lyon, CNRS-IN2P3, 69622 Villeurbanne Cedex, France. E-mail: gaillard@ipnl.in2p3.fr
bUniversité de Strasbourg, IPHC, 23 rue du Lœss, 67037 Strasbourg, France
cCNRS, UMR 7178, 67037 Strasbourg, France
dUniv. Grenoble Alpes, LEPMI, 38000 Grenoble, France
eCNRS, LEPMI, 38000 Grenoble, France

Received 2nd May 2016 , Accepted 11th July 2016

First published on 14th July 2016


Abstract

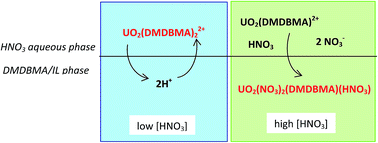
We present new insights into the extraction of uranium(VI) from a nitric acid aqueous phase into 1-butyl-3-methylimidazolium bis(trifluoromethanesulfonyl)imide ionic liquid ([C4mim][Tf2N]) using a malonamide extractant, namely N,N′-dimethyl-N,N′-dibutylmalonamide (DMDBMA). UV-vis absorption spectrophotometry and extended X-ray absorption fine structure (EXAFS) experiments have been carried out on the extracted phases and new extraction data were used in order to model the mechanism lying behind the U(VI) extraction. We show that two different uranyl species are involved, as a function of the aqueous nitric acid concentration: the cation UO2(DMDBMA)x2+ (2 ≤ x ≤ 3) at low acid concentration, and the neutral UO2(NO3)2(DMDBMA) at high acid concentration. The former is extracted by exchange with 2 protons, while the latter is co-extracted with a HNO3 molecule. We show that the uranium extraction is performed without the direct help of IL ions, although the latter pollute noticeably the aqueous phase.

1. Introduction

Ionic liquids (IL) are a well-known class of solvents composed entirely of cations and anions. The use of hydrophobic ILs in the replacement of traditional organic solvents for the metal ion extraction has been widely studied over the last few years, showing the ability of these unusual solvents to improve the efficiency and/or the selectivity of the metal ion separation in comparison with traditional organic solvents.1–5 The hydrophobicity of the studied IL is usually driven by the Tf2N anions (Tf2N being bis(trifluoromethanesulfonyl)imide), while the cationic part is composed of imidazolium Cnmim+, pyridinium or tetraalkylammonium based patterns. In molecular solvents, the metallic species extracted with the help of an organic extractant molecule are neutral solvates and ion-pairs. The use of IL complicates the extraction process. According to the nature of the IL ions, the extracting molecule and the aqueous phase composition (nature and concentration of the mineral acid), the extraction may be performed via an ion-exchange process, neutral coextraction or a more “traditional” neutral solvation.6 The former mechanism is often presented as a major drawback for a foreseen IL use for industry as the exchange may be performed with IL ions and entails a pollution of the aqueous phase. As a consequence, researches are made in order to reduce this phenomenon,7,8 for instance by increasing the IL hydrophobicity by using cations with long alkyl chains, like C8mim+ or C10mim+, or highly hydrophobic binary extractants.9 However, this often goes with a drop of the extraction efficiency.10–13 Moreover, the inherent solubility of the ionic liquid in the acidic aqueous phase by contact during the extraction process is also to be considered, as it was shown to depend on the nature of the IL but also on the nature and concentration of the acid.14,15

The partitioning of actinides from the spent nuclear fuel is made by hydrometallurgical methods based on successive liquid–liquid extraction processes from a nitric aqueous phase. Many studies have been made on the possible use of IL in such processes to replace the organic solvents used nowadays.11,14,16–24 Among possible extractants, malonamides allow a selective separation of actinides over fission products, have the advantage to be completely incinerable (necessary for nuclear waste management) and to display a large variety of structures, owing to the flexibility of their chemical backbone.25 In molecular solvents, the extraction of uranium(VI) from nitric acid phase is formally made via the formation of a neutral solvate UO2(NO3)2L.26,27 But the formation of the protonic form of amides is not negligible at high acidic conditions. Also, malonamides have a large affinity for HNO3 which leads to the extraction of non-dissociated acid in the organic phase by the formation of Lx(HNO3)y species, even at low acid concentration.28,29 As a consequence, it was suggested that the separation of uranium at high HNO3 loading goes with the co-extraction of a nitric acid molecule, and thus, to the extraction of UO2(NO3)2(L)HNO3 (ref. 30 and 31) or UO2(NO3)2(L)HNO3L species.32 Several authors have replaced the molecular solvent by the [C4mim][Tf2N] ionic liquid to study the extraction of actinides by malonamides. Rout et al.12 performed the extraction of Pu(IV), Am(III) and U(VI) by the N,N-dimethyl-N,N-dioctyl-2-(2-hexyloxyethyl)malonamide ligand (DMDOHEMA). In the case of uranium they report a decrease of the distribution coefficient as a function of the HNO3 concentration in the 0.5–8 M range, and postulate the extraction of a cationic species containing two ligands in the whole acidic range. Patil et al.33 used two different malonamide extractants, including DMDOHEMA, to extract uranium(VI) in an [C4mim][Tf2N] IL phase, below 3 M HNO3. They show two trends in the process as the nitric acid concentration increases: for [HNO3] < 0.1 M, a strong increase of the distribution coefficient is observed, which is ascribed by the authors to an IL cation exchange mechanism, while DU decreases between 0.1 and 3 M HNO3.

In a previous work,34 we have focused our attention on the extraction of uranium(VI) with malonamide extractants in the IL [C4mim][Tf2N], comparing the extraction efficiency between a single malonamide molecule (N,N′-dimethyl-N,N′-dibutylmalonamide, so called DMDBMA) and a malonamide-functionalized ionic liquid. Using the DMDBMA molecule as extractant, we evidenced a boomerang-shape curve of extraction with a turning point at 2 M HNO3. We proposed that the extraction of U(VI) with DMDBMA at low nitric acid concentration is performed by a cation exchange between UO22+ and 2H+, while it would occur at high HNO3 concentration by an anion-exchange between UO2(NO3)3 and one Tf2N. This assumption was based on the variation of the uranium distribution coefficient DU as a function of [HNO3] or [DMDBMA], and from the impact of the aqueous C4mim+ and Tf2N concentrations on the extraction efficiency. The present work gives new insights in this system. In particular, the characterization of the extracted species was done by UV-vis spectroscopy and X-ray absorption spectroscopy (EXAFS), showing results that are not in agreement with the extracted anionic species postulated at high HNO3 concentration. New extraction data were collected, in order to take into account the solubility of the ionic liquid ions in the aqueous phase and of the nitric acid in the IL phase. Taking advantage of this complete data set, we propose a refined model for the extraction of uranium(VI) in [C4mim][Tf2N] with DMDBMA. In particular, we show that the uranium extraction is performed without the direct help of IL ions, although the latter pollute noticeably the aqueous phase.

2. Experimental section

2.1. Chemicals

All chemical reagents were used as received without any further purification. 1-Butyl-3-methylimidazolium bis(trifluoromethanesulfonyl)imide (high purity grade 99.5%, hereinafter indicated as [C4mim][Tf2N]) was purchased from Solvionic (Toulouse, France). The syntheses of UO2(Tf2N)2 and [C4mim][NO3] have been reported elsewhere.35 N,N′-Dimethyl-N,N′-dibutylmalonamide (DMDBMA) was prepared and characterized according to the published method.34 The other chemical reagents used, 1,2-dichloroethane, concentrated nitric acid, sodium trifluoroacetate, sodium citrate, deuterated nitric acid and deuterium oxide were of analytical grade. Deionized water from an Elga® purification system of resistivity 18.2 MΩ cm was used for solution preparations and dilutions.

2.2. Sample preparation

The highly hygroscopic uranium salt UO2(Tf2N)2 and the ionic liquids [C4mim][NO3] and [C4mim][Tf2N] were dried prior to use under vacuum at 60 ± 1 °C for two hours and then for one hour at ambient temperature.35

Two sets of samples were prepared in order to measure the final aqueous concentration of C4mim+ and Tf2N as a function of the initial nitric acid concentration at [DMDBMA]IL = 50 mM, and as a function of the DMDBMA concentration at two nitric acid concentrations ([HNO3]aq,init = 0.45 M and 4.51 M). Equal volumes of organic and aqueous phases were used (typically 0.5 mL). The organic phase was prepared by dissolving weighted amount of DMDBMA in neat [C4mim][Tf2N]. The aqueous phases were obtained by dilution of concentrated HNO3 or DNO3 in the case of further NMR measurements. We assume a similar behavior (i.e. a small isotopic effect) between the deuterated DNO3 and non-deuterated HNO3 acids. After mixing in 2.0 mL Eppendorf tubes, the biphasic system was shaken mechanically (VXR basic Vibrax, IKA) at 1200 rpm for three hours at room temperature (20 ± 1 °C) and then separated by centrifuging at 4000 rpm for two minutes (Micro Star 12, VWR). Then, the aliquots of equilibrium aqueous phase were taken for further analysis.

The composition of samples analyzed by EXAFS and UV-vis spectroscopy is given in Table 1. The first set was obtained by dissolving in neat [C4mim][Tf2N] weighted quantities of UO2(Tf2N)2, DMDBMA and/or [C4mim][NO3]. The final water content in those solutions was measured after EXAFS measurements by coulometric technique (Karl-Fischer titration, Mettler Toledo DL 32) and found below 100 ppm. The second set of IL samples was obtained by extraction of uranium(VI) with 0.3 M DMDBMA from aqueous nitric acid solutions ([HNO3] = 0.5 M and 6.3 M), using the experimental protocol described above. Prior to U(VI) solvent extraction, the organic and aqueous phases were pre-equilibrated for three hours and then an aliquot of 1 M UO2(Tf2N)2 in 1 M HNO3 was added to the aqueous phase to reach an initial U(VI) concentration of 0.006 M. For comparison purpose, a sample obtained by extraction of uranyl from 3.3 M HNO3 towards 1,2-dichloroethane (DCE) with the help of 0.3 M DMDBMA was also prepared. It contains the neutral complex UO2(NO3)2·DMDBMA.32

Table 1 Composition of IL samples analyzed by EXAFS and UV-vis spectroscopy. [UO22+] = 0.01 M for samples made by salt dissolution in [C4mim][Tf2N], and [UO22+]aq,init = 0.006 M for extracted samples. Nitrates were dissolved as the [C4mim][NO3] salt in the IL
Samples made by salt dissolution in [C4mim][Tf2N]
Sample ID [NO3] (M) [DMDBMA] (M) [UO22+]/[NO3]/[DMDBMA] Speciation obtained by EXAFS (cf. Table S1)
S1_0_1 0 0.01 1/0/1 [UO2(DMDBMA)]2+
S1_0_2 0 0.02 1/0/2 [UO2(DMDBMA)2]2+
S1_0_3 0 0.03 1/0/3 [UO2(DMDBMA)2–3]2+
S1_0_4 0 0.04 1/0/4 [UO2(DMDBMA)3]2+
S1_1_2 0.01 0.02 1/1/2 [UO2(NO3)(DMDBMA)2]+
S1_2_2 0.02 0.02 1/2/2 [UO2(NO3)(DMDBMA)2]+ + UO2(NO3)2(DMDBMA)
S1_3_2 0.03 0.02 1/3/2 UO2(NO3)2(DMDBMA) + [UO2(NO3)(DMDBMA)2]+
S1_2_1 0.02 0.01 1/2/1 UO2(NO3)2(DMDBMA)

Extracted samples
  [HNO3]aq,init (M) [DMDBMA] (M) Speciation obtained by EXAFS (cf. Table S1)
Sample A 0.6 0.3 [UO2(DMDBMA)3]2+
Sample B 6.3 0.3 UO2(NO3)2·DMDBMA
1,2-Dichloroethane (DCE) 3.3 0.3 UO2(NO3)2·DMDBMA


2.3. Technical procedures

After extraction, the aqueous concentrations of IL ions were measured by the NMR technique as reported in detail elsewhere.15 Briefly, an aliquot of the internal standard solution was added to an aliquot of the aqueous phase containing IL ions and then the total volume was adjusted with deuterium oxide. Sodium citrate and sodium trifluoroacetate were used as internal standards for 1H and 19F quantitative NMR measurements, respectively. NMR spectra were acquired using a Bruker Avance-I 300 MHz spectrometer at 298 K.

The U(VI) concentration in stock and work solutions was determined by inductively coupled plasma mass-spectroscopy (ICP-MS, Agilent 7500i) after dilution to the concentration suitable for measurements by 2 vol% nitric acid solution, which contains 10 μg L−1 Tl as an internal standard.

UV-vis absorption spectra have been recorded at room temperature by a Varian Cary 100 spectrophotometer using a quartz cell (optical path length 1 cm) with neat [C4mim][Tf2N] as reference or pure DCE, accordingly.

EXAFS measurements were carried out at the ROBL beamline, ESRF (Grenoble, France) at ambient temperature, using a double crystal Si(111) monochromator. Analysis were made at the U LIII (17[thin space (1/6-em)]166 eV) edge in fluorescence mode using a 13-element germanium detector. The monochromator energy was calibrated by an yttrium metal foil (17[thin space (1/6-em)]038 eV). After their dead-time correction, data were extracted using ATHENA software36 and their analysis was carried out with the FEFFIT code,37 using phase and backscattering amplitude functions generated with the FEFF 8.1 code.38 Fits of the Fourier transform (FT) k3-weighted EXAFS data to the EXAFS equation were performed in the R-space between 1 and 4.3 Å. The k-range used was 3.0–16 Å−1. The amplitude reduction factor (S02) was held constant to 1 for all fits. The shift in the threshold energy (E0) was allowed to vary as a global parameter for all atoms. In all fits, the coordination number of the uranyl axial oxygen atoms (Oax) was held constant at two. The multiple scattering paths of the axial oxygens were included in the fit by constraining its effective path-length to twice the values of the corresponding U–Oax distance. The presence of DMDBMA molecules in the coordination sphere entails the presence of two strong multiple scattering contributions that were taken into account without adding any fitted parameters (N, σ2 and R were linked to values obtained for the single scattering contribution U–C). The same procedure on multiple scattering contributions arising from nitrate groups was applied.

2.4. Fittings

The different chemical models examined in this work have been turned into a set of mathematical equations, based on the mass action law, mass balance for U(VI) and charge balance in the aqueous phase. As already detailed in our previous works,39 we always assumed a constant ionic strength correction, so the derived equilibrium constants are conditional ones. This allows solving the set of mathematical equations into an analytical expression linking DU, the parameters of the model (see Section 3) and the initial chemical conditions (total amount of ligand, initial acidic concentration etc.). For all the models discussed in this work, this mathematical treatment is rather easy because the concentrations of HNO3, H+, NO3 and ligand (protonated or not, see Section 3.2) are always in large excess as compared to the metallic concentration.

Fitting procedures of ion concentrations and DU values have been performed using dedicated Fortran sub-routines, inserted in the MINUIT minimization procedure (Simplex and Migrad procedures, least square adjustment of χ2) available through the CERN libraries, based on the mathematical expressions derived (DU values) or empirically chosen (ion concentrations). Because of the different experimental uncertainties arising from the measurement protocol for DU and ion concentrations, minimizations have been performed on the basis of two different definitions of the χ2 criterion:

 
χ2 = [∑(McalMexp)2]1/2/N (for ion concentration) (1)
 
χ2 = [∑((McalMexp)/Mcal)2]1/2/N (for DU values) (2)
where Mcal and Mexp are the theoretical and experimental measure, respectively, and N is the number of data points.

3. Experimental results

3.1. Spectroscopic analysis of uranium(VI) extracted IL solutions

We have shown previously that the distribution coefficients of uranium(VI) as a function of HNO3 concentration has a “boomerang shape”, with a minimum of extraction at [HNO3] = 2 M (see Fig. 1).34 We have investigated the composition of two IL extracted solutions, chosen from this uranium extraction curve. The first one (sample A) was obtained from an aqueous solution with [HNO3] = 0.6 M. It corresponds to the first part of the extraction curve, where DU decreases with [HNO3]. The second sample (sample B) was obtained by extraction from a 6.3 M HNO3 aqueous solution, it corresponds to the second part of the extraction curve where DU smoothly increases with HNO3 concentration. In both cases, the [C4mim][Tf2N] phase contains 50 mM DMDBMA, as used to obtain the extraction data displayed in Fig. 1.
image file: c6ra11345a-f1.tif
Fig. 1 Extraction data curve of uranium(VI) as a function of the nitric acid concentration34 (symbols), for [DMDBMA] = 50 mM. Lines represent data fits obtained by 2 models explained in part 4, taking into account the aqueous Tf2N concentrations values: model from ref. 34 (dotted line) and new model developed in this paper (solid line).
3.1.1. UV-vis spectroscopy. The UV-vis spectra of those two IL solutions are compared in Fig. 2 with the one obtained by the extraction of uranyl in 1,2-dichloroethane (DCE). The shape of the sample A and B spectra is different, confirming the extraction of two different uranyl species in the DMDBMA/IL phase as a function of the initial HNO3 concentration. Moreover, the shape of the sample A is completely different from the one obtained in DCE, which means that the extracted uranyl species are of different nature in IL and in the molecular solvent at low acid concentration. The shape of the sample B shows some similitudes with the one of U(VI) extracted with DMDBMA into DCE and benzene.32 This feature means that uranyl extracted species from 6.3 M HNO3 in IL are chemically close to those extracted in molecular solvents, UO2(NO3)2·DMDBMA.
image file: c6ra11345a-f2.tif
Fig. 2 UV-vis spectra of U(VI) extracted species by 0.3 M DMDBMA into [C4mim][Tf2N] from 0.6 M HNO3 (A) and 6.3 M (B), compared with the spectra of U(VI) extracted in 1,2-dichloroethane from 3.3 M HNO3.

In order to get more information, we have compared the spectra of the extracted species with those of reference sample containing various ratios of nitrates and DMDBMA (see Fig. 3). In the absence of nitrate ions, the uranium/DMDBMA spectra display three main peaks at 412, 425 and 438 nm. The sample A spectrum exhibits the same shape with peaks at the same position. Thus we can suppose that the composition of the uranyl extracted complex at low acidity is of the same nature, formed only with DMDBMA molecules. The spectrum of sample B looks like those of reference samples containing nitrates and DMDBMA. On the latter, the 3 peaks displayed at 438, 455 and 471 nm are typical of [UO2(NO3)x] units,40,41 they indicate the presence of nitrate ions in the uranium first coordination sphere and their intensity is proportional to the number of nitrate groups. We thus can assume that the complex extracted at high acidity contains some nitrate groups. At this stage, it is not possible to derive more information on the nature of the extracted species, and we have performed EXAFS experiments for that purpose.


image file: c6ra11345a-f3.tif
Fig. 3 UV-vis spectra comparison between extracted IL samples and reference solutions (see nomenclature of samples in Table 1).
3.1.2. EXAFS spectroscopy. Fig. 4 displays the EXAFS spectra and the corresponding Fourier transforms of uranyl samples described in Table 1. Fit results are given in Table S1.
image file: c6ra11345a-f4.tif
Fig. 4 EXAFS (left) and Fourier transform (right) of uranyl samples, spectra are shifted along the y-axis for sake of clarity. Comparison between extracted samples and reference ones. See Table 1 for samples composition.

Sample A and B spectra are compared to reference solutions. In the reference samples S1_0_X, we evidence the total complexation of DMDBMA molecules to uranyl in the ionic liquid for solutions containing 1 or 2 equivalents of ligands. For the S1_0_3 sample containing 3 equivalents of DMDBMA, an average ratio of 4.5 C is found. According to the uncertainties on this value, it would correspond to the complexation of 2 or 3 DMDBMA in the uranyl coordination sphere. We can also envision the simultaneous presence of the 1[thin space (1/6-em)]:[thin space (1/6-em)]2 and 1[thin space (1/6-em)]:[thin space (1/6-em)]3 complexes in solution. The 1[thin space (1/6-em)]:[thin space (1/6-em)]3 stoichiometry is reached for the S1_0_4 sample which contains a 4 fold amount of ligand compared to uranyl. For all stoichiometries, the ligand is complexed to uranyl by a bidentate coordination, as already noticed in the solid state.27,42 Nitrate ions are also strong complexants to uranium(VI). When a sum of 3 ligands (nitrates + DMDBMA) per uranyl is added in solution, only one species is formed corresponding to the filling of the uranyl equatorial plane by the 3 ligands: UO2(NO3)(DMDBMA)2 in sample S1_1_2 and UO2(NO3)2(DMDBMA) in sample S1_2_1. When the total number of ligands per uranyl is above 3, then a mixture of complexes is formed in solution, as a sign of the competitive complexation of nitrates ions and DMDBMA ligands. As a consequence, EXAFS fit results show the formation of a mixture of UO2(NO3)2(DMDBMA) and UO2(NO3)(DMDBMA)2 in both S1_2_2 and S1_3_2 samples.

Let us turn now to the extracted samples. In dichloroethane, our results are in agreement with literature data as we evidence the extraction of the neutral UO2(NO3)2(DMDBMA). In the ionic liquid, the extracted species are of different nature according to the initial acidic concentration in the aqueous phase. At low [HNO3], the uranyl species are cationic complexes composed only by DMDBMA ligands. As for the reference sample S1_0_3, the average number of ligand coordinated to uranyl stands between 2 and 3. It can be interpreted by the presence of 2 different complexes in solution (UO2(DMDBMA)22+ and UO2(DMDBMA)32+). However, according to the large uncertainty on the coordination number determination, we can also envision the presence of an unique species, either UO2(DMDBMA)22+ or UO2(DMDBMA)32+. Therefore, in the following, the cationic extracted species will be written as UO2(DMDBMA)x2+ species with 2 ≤ x ≤ 3. At high [HNO3], uranyl is extracted in the IL phase as the neutral UO2(NO3)2(DMDBMA).

3.2. Effect of DMDBMA concentration on the IL ions solubility in the aqueous phase and on the acid extraction in the IL phase

All NMR measurements in this study were carried out with samples containing deuterium oxide, D2O and deutero-nitric acid, DNO3. Nitric acid and water with hydrogen atoms substituted by hydrogen isotope, deuterium, exhibit nearly identical chemical behavior. Thus, in order to simplify the notation we use only the name nitric acid, HNO3, in the following. In Fig. 5 we compare the solubility of IL ions in aqueous phases as a function of HNO3 concentration after contacting nitric acid solutions with neat [C4mim][Tf2N]15 or with an organic phase composed of 50 mM DMDBMA in [C4mim][Tf2N].43
image file: c6ra11345a-f5.tif
Fig. 5 Comparison of the C4mim+ (a) and Tf2N (b) aqueous concentrations at equilibrium as a function of the initial nitric acid concentration in the aqueous phase without DMDBMA (red symbols, from ref. 15) and with DMDBMA 50 mM (black symbols, from ref. 43). Dotted lines represent the data fits used for the modeling (see Section 4).

The variation of the initial nitric acid concentration results in a noticeable change of the ILs' ion individual solubilities for both biphasic systems, with and without DMDBMA in the IL phase. Without DMDBMA, the solubility of C4mim+ increases monotonously with the increase in the acid concentration, to reach a value of 0.1 M for [HNO3] = 6 M. The introduction of 50 mM DMDBMA in the IL phase leads to a slight increase of the C4mim+ solubility as compared to neat IL. Above 3 M of HNO3 there is no substantial difference between the IL cation solubilities for the biphasic systems with and without DMDBMA in the organic phase.

The opposite trend is observed for the Tf2N solubility in HNO3 aqueous phases. Indeed, it appears that DMDBMA significantly reduces the amount of Tf2N anions in the aqueous phase, whatever the initial nitric acid concentration. Fig. 6 displays the solubility of IL ions in the aqueous phase as a function of the DMDBMA concentration for two nitric acid concentrations: 0.45 M and 4.51 M. Two different trends are observed for each ion. The IL cation solubility in the aqueous phase increases with the DMDBMA concentration, while the IL anion concentration decreases. As a conclusion, we show that the solubility of each IL ion in the aqueous phase is different as a function of the nitric acid and ligand concentration, so that it is not possible to consider that [C4mim+]aq,eq and [Tf2N]aq,eq are equal and constant.


image file: c6ra11345a-f6.tif
Fig. 6 Aqueous concentration at equilibrium of C4mim+ and Tf2N as a function of the DMDBMA concentration in [C4mim][Tf2N], at two nitric acid concentrations: 0.45 M (left) and 4.51 M (right). Dotted lines represent the data fits used for the modeling (see Section 4).

By contacting an acidic aqueous phase and an IL phase, even without an extractant and without a metallic ion, part of the acid is extracted in the IL phase. This has been observed previously14 and in the case of [C4mim][Tf2N] and HNO3, the transfer of H+ from the aqueous to the IL phase amounts to 6% of the initial acid concentration. Addition of an extractant further increases this H+ transfer, as observed previously for the same H2O/HNO3//DMDBMA/[C4mim][Tf2N] mixtures34 and confirmed by our additional experiments, as evidenced in Fig. 7, which shows the evolution of the H+ ion at equilibrium in the aqueous HNO3 phase as a function of the ligand concentration in [C4mim][Tf2N]. The “natural” H+ transfer, equal to 6% is indicated as a horizontal dotted line, evidencing the increase in H+ transfer due to the DMDBMA addition.


image file: c6ra11345a-f7.tif
Fig. 7 Evolution of the final concentration of D+ ion in the aqueous DNO3 phase as a function of the ligand concentration in the ionic liquid. [DNO3]aq,init = 0.45 M and 4.51 M (error bars = 2%). Dotted lines represent the acid uptake without ligand. Solid lines represent the data fits used for the modeling (see Section 4).

We previously ascribed these variations to the protonation of the DMDBMA moiety according to:

 
DMDBMAorg + Horg+ ⇔ DMDBMAHorg+ (3)
and we could recover our previous data with a protonation constant in the IL phase equal to KL = 90.34 Our new data, as depicted in Fig. 7, agree well with the two values of KL = 90 and 6% of “natural” H+ transfer. Fixing the ligand protonation constant at KL = 90 leads to concentration of free DMDBMA in the IL always at least 40 times above the initial metal concentration. Thus this quantity has been considered as a constant for the calculations to follow.

4. Extraction mechanism

In a first step, we consider our previous model, as detailed in:34
 
UO22+aq + 2DMDBMAorg + 2Horg+ ⇔ UO2(DMDBMA)22+org + 2Haq+ (4)
 
UO22+aq + 3NO3aq + 2DMDBMAorg + Tf2Norg ⇔ UO2(NO3)3(DMDBMA)2org + Tf2Naq (5)

Eqn (4) and (5) are accompanied by eqn (3) for ligand protonation, and also by the two successive nitrate-uranyl complexations in the aqueous phase. By contrast to our previous study, in which we erroneously assumed the IL's cation and anion solubilities in water to be constant, we now should take into account the [Tf2N] variations as a function of the initial concentrations of HNO3 (fixed DMDBMA at 50 mM) and DMDBMA (fixed HNO3 at 0.49 M and 4.4 M) as illustrated in Fig. 5 and 6. These quantities intervene in the mass action law and in the charge balance (see Section 2.4). This has been done by use of empirical polynoms according to:

For [DMDBMA]init = 50 mM and [HNO3]init from 0.25 M to 6.19 M:

[Tf2N] = 0.7046[HNO3]init2 + 5.538[HNO3]init + 9.37

[C4mim+] = −1.3189[HNO3]2 + 17.556[HNO3] + 39.85

For [HNO3] = 0.445 M and [DMDBMA]init from 0.02 M to 0.1 M:

[Tf2N] = 1923.2[DMDBMA]2 − 334.54[DMDBMA] + 23.384

[C4mim+] = 458.7[DMDBMA] + 18.336

For [HNO3]init = 4.4 M and [DMDBMA] from 0.02 M to 0.1 M:

[Tf2N] = −242.3[DMDBMA] + 59.455

[C4mim+] = 5.03 × 10⁴[DMDBMA]3 + 7333[DMDBMA]2 − 85.21[DMDBMA] + 72.3

In all equations above, [C4mim+] and [Tf2N] are in mM, [DMDBMA] and [HNO3] are in M.

The numerical coefficients of these polynoms have been determined through a fitting procedure (see Section 2.4) and Fig. 5 and 6 illustrate the quality of fitting polynoms. Considering the values obtained and the empirical status of the expressions, care has been taken to never extrapolate C4mim+ and Tf2N concentration values outside the ranges of applicability given above. This range is slightly narrower than that used in our previous publication, owing to a limited availability of the DMDBMA compound.

Another important phenomenon to be taken into account and that was not considered in our previous study is the well-known nitric acid association above 3 M,15,44 that impacts the concentration values of the free nitrate ions in the aqueous phase (appearing in eqn (5) and also in the successive nitrate/uranyl complexations). We took advantage of the data by Ruas and collaborators44 who derived the free and associated nitrate proportions in aqueous solutions of nitric acid, up to 13.6 M. We adjusted the experimental data by use of a polynom as:

[HNO3] < 3 M: no HNO3 association, i.e. [NO3]aq,init = [HNO3]aq,init

[HNO3] > 3 M: [NO3]aq,init = −0.0703 × [HNO3]aq,init2 + 1.2438 × [HNO3]aq,init − 0.3106

The excellent agreement between the experimental data of Ruas and collaborators and the fitted polynom is illustrated in Fig. S1. The polynom was thus safely used in our limited range 0–6 M.

Although this is an improvement in the completeness of the model, it is still not perfect because the effect of all other ions (C4mim+, Tf2N, UO22+ etc.) is not described. We only rely on the fact that as these additional concentrations are low, the global effect should be small.

Under these assumptions, we attempted a fit of the three series of extraction data all together: (i) DU vs. [HNO3]init at [DMDBMA] = 50 mM (ii) DU vs. [DMDBMA] at [HNO3] = 0.5 M and (iii) DU vs. [DMDBMA] at [HNO3] = 4.4 M.

Both DU vs. [DMDBMA] variations are nicely fitted (see Fig. S2), and the DU vs. [HNO3] fit is satisfactory too below 1 M HNO3, but the fit significantly deviates from the experimental data above 1 M HNO3 as shown in Fig. 1 (dotted line). The discrepancy evidenced in Fig. 1 is mainly due to the Tf2N variations, suffering an increase of ca. a factor of 4.6 in the range 1–6 M of HNO3 (see Fig. 5b). This obviously strongly impacts the DU values at high acidic initial concentrations, for which the postulated anionic exchange is dominating the extraction mechanism. The previous model thus appears inappropriate.

Therefore, in a second step, we propose a refined extraction mechanism, in qualitative agreement with the new EXAFS and UV-vis experimental evidences detailed above:

At low acid concentration:

 
UO22+aq + (2 − t)Horg+ + tC4mimorg+ + xDMDBMAorg + z1HNO3 ⇔ [UO2(DMDBMA)x(HNO3)z1]org2+ + (2 − t)Haq+ + tC4mimaq+ (6)

At high acid concentration:

 
UO22+aq + yDMDBMAorg + 2NO3aq + z2HNO3aq ⇔ UO2(NO3)2(DMDBMA)y(HNO3)z2org (7)
where x, y and z1, z2 are accounting for possible different stoichiometric coefficients of the ligand or HNO3 respectively, at low and high acidity. K+0 is the extraction equilibrium constant of the cationic exchange, occurring with (2 − t) H+ and tC4mim+ cations from the IL phase, at low acid concentration. Kn is the equilibrium constant for the ion pair mechanism occurring at high acid concentration. We also include eqn (3), describing the DMDBMA protonation and the complexation between uranyl and nitrates. Eqn (6) is in agreement with the EXAFS data, ruling out nitrate ions within the first coordination sphere of the extracted species at low acidities. Conversely, eqn (7) involves a neutral species due to the concomitant extraction of UO22+ and two nitrate ions and this neutral species also possibly contains some HNO3 neutral entities in the second coordination sphere (z2).

Eqn (6) and (7) are balanced chemical equations and the question is raised about the source of HNO3 entities which possibly appear in the extracted species as this is again linked to the nitric association above 3 M. Therefore, the two possible routes for associating HNO3 to the extracted metallic species above 3 M (either from remaining H+ and NO3 or from newly formed HNO3) lead to differences in the way to express the mass action law. Of course, it is possible that the formation of the complex is a mixed scenario between these two but we consider only the two limiting possibilities.

All these assumptions allow solving the set of mathematical equations into an analytical expression linking DU, the parameters of the model (KL, K+0, Kn, t, x, y and z1, z2) and the initial chemical conditions (total amount of ligand, initial acidic concentration etc.). The two analytical expressions of DU, differing according to the source of HNO3 in the complex, were thus fitted to the experimental DU values already collected (DU vs. HNO3 at fixed DMDBMA concentration – see Fig. 1 – and DU vs. DMDBMA concentration at two fixed HNO3 concentrations, i.e. [HNO3] = 0.49 M and [HNO3] = 4.40 M – see Fig. S2).

Several trials were performed that all concluded that the source of HNO3 within the extracted species is by aggregation of H+ and NO3, even above 3 M of initial nitric acid. This is in line with the fact that these two ions are the major components of concentrated nitric acid solutions even if associated HNO3 exists (see Fig. S1). As for the value of t, it has to be nil to comply with the absence of effect of C4mim+ addition.34 It was therefore set to zero in all subsequent trials discussed below. We then examined the impact of allowing x, y and z to be either positive integers only, as is chemically reasonable, or to be floating real positive values, as is mathematically conceivable. As expected, the χ2 value for floating values is slightly better than for imposed integer values, but the floating values are all rather close to integers except for x. This last result is in agreement with the EXAFS data, which also led to an intermediate value of x, ranging between 2 and 3.

As an illustration, fitted values are collected in Table 2 for floating parameters and integer parameters.

Table 2 Fitted values obtained by the modeling of extraction curve data
  K+0 Kn x y z1 z2 χ2
a Fixed value.
Floating 3.0 × 10⁷ 16.0 2.34 1.01 0.38 1.0 0.107
Integer 6.9 × 10⁸ 17.8 3a 0.99 0.67 0.9 0.181
Integer 4.4 × 10⁵ 1.4 2a 0.97 0.0 1.1 0.169


Consequently, we plotted the best fit obtained for floating parameters in Fig. 1 (and S2) while we summarize the best chemical model using integer values as:

At low acid concentration the chosen integer x value corresponds to the lowest χ2 (see Table 2):

 
UO22+aq + 2Horg+ + 2DMDBMAorg ⇔ UO2(DMDBMA)22+org + 2Haq+ (8)

At high acid concentration:

 
UO22+aq + DMDBMAorg + 2NO3aq + HNO3aq ⇔ UO2(NO3)2(DMDBMA)(HNO3)org (9)

As is seen in Fig. 1, this new model is able to recover the experimental variations in a very satisfactory way and, as compared to our previous proposal, the improvement is obvious above 1 M HNO3. Our trials also clearly show that one HNO3 entity co-extracted with the ion pair is mandatory to obtain a reasonable fit. Actually, in the absence of HNO3 entity for the extraction mechanism at high acidity, the χ2 values is doubled as compared to the value at χ2 = 0.107 (floating option).

This new model obtained from a much complete data set gives different results than our previous one at high acidic concentration, when we suggested the extraction of the [UO2(NO3)3DMDBMA] moieties. This assumption is discarded by our new EXAFS and UV-vis experiments, and the new analytical model developed is based on the extraction of the neutral UO2(NO3)2(DMDBMA)(HNO3). The discrepancy between these two complexes is only apparent as in both cases, the extraction of uranyl implies 3 nitrate entities. But this involves significant chemical differences, as one of the nitrate group lies in the uranyl second coordination sphere as HNO3. This hypothesis is in agreement with the EXAFS results. Indeed, the presence of this undissociated HNO3 cannot be evidenced by this technique which is able to look only at a short distance around the absorbing atom (here U). Actually the extraction of complexes UO2(NO3)2L·HNO3 (L = DMDBMA or DMDOMA) was previously stated by Musikas et al.30,31 for molecular solvents, on the basis of the strong affinity of malonamide molecules with nitric acid. Our study tends to prove that the same kind of species is able to form in ionic liquids.

In the uranyl/DMDBMA extraction system, adding Tf2N ions at high nitric concentration in the aqueous phase diminishes the extraction efficiency of uranium (see Fig. 9 of ref. 34, up to 1 M LiTf2N added). It is often attractive to conclude on this sole DU = f([IL ions]aq) curves that IL ions play a direct role on the extraction mechanism, but our present results show that the phenomenon evidenced may only be a side-effect of the introduction of IL ions in the aqueous phase. In the present case, Tf2N anions do not play an active role in the extraction mechanism, thus questions arise on their effect on the aqueous phase speciation. HTf2N is a strong acid,45,46 and we may envision a change in the HNO3 speciation at high concentration in presence of Tf2N, with a decrease of the amount of associated HNO3. The aqueous phase speciation may also be disturbed by the change in the solution ionic strength. Therefore, the relevance of the experiment itself (adding artificially an IL ion to the aqueous phase in order to demonstrate a metallic ion extraction mechanism) may be questioned. We show here that the result is not the consequence of a uranium extraction mechanism but probably the consequence of a change in the initial aqueous speciation. In fact, it appears difficult (if not impossible) to distinguish between an anion exchange effectively implying Tf2N anions from an ion pairing mechanism which would be disturbed by the addition of a Tf2N salt. The same comment may be made for experiments consisting in introducing an IL cation salt in acidic aqueous phases in order to evidence a possible cation exchange mechanism.

As it is written in our new chemical model, the uranium(VI) extraction with DMDBMA in an ionic liquid is the sole consequence of its interactions with the ligand and nitric acid, the ionic liquid ions have no direct role on the extraction. As a matter of fact, the uranyl solvate extraction at low acidic concentration can be explained by the exchange with 2 protons while at high acid concentration we show the extraction of a neutral complex as in molecular solvents. However, it does not prevent a pollution of the aqueous phase with the IL ions which occurs independently of the uranium partitioning, as show in Fig. 5 and 6. So far, many efforts were made in order to avoid ion-exchange mechanism, arguing on the fact that the subsequent loss of IL ions is one of the major drawbacks for an industrial foreseen application.47–49 Actually, we show that the main point to be addressed is the mineral acid aqueous phase/ionic liquid interactions. It is important to recall that the IL's ion solubilities, in the absence of U(VI), are never below 10 mM and can reach 100 mM. These figures have to be compared to the metal ion concentrations used in laboratory extraction experiments, which lie usually between trace amounts (especially for actinides) to some mM (6 mM in our present study). In this condition, the IL pollution of the aqueous phase from metal ions extraction is marginal comparing to the one occurring “naturally” by phase contact. The situation may be different in the frame of industrial applications where the aqueous phase metal concentration would be much higher. But it seems impossible to draw direct conclusions on the mechanism involved in this case from results obtained at much lower metal ion concentration. Indeed, the effect on the aqueous phase speciation and the subsequent solubility of IL in this phase need to be investigated.

5. Conclusion

We demonstrate that the extraction of uranium(VI) with a malonamide DMDBMA ligand into the hydrophobic [C4mim][Tf2N] ionic liquid is performed without the help of IL ions, over the whole HNO3 acidic range. By coupling spectroscopic analysis of the extracted species and a modelling of the extraction data, we show that [UO2(DMDBMA)x]2+ (2 ≤ x ≤ 3) species are extracted by an ion-exchange mechanism with 2 protons at [HNO3] < 1 M, while at high nitric acid concentration, a neutral solvate composed of ligand molecules and nitric acid is formed. However, it does not avoid a noticeable pollution of the aqueous phase with IL ions, just by contact of the two phases. At this stage, two paths emerge for a future use of IL for metal ion partitioning: (i) taking advantages of the large distribution coefficient while accepting the IL loss in the aqueous phase, or (ii) using extracting systems that diminish the aqueous phase pollution (using very hydrophobic IL, for instance), eventually in disfavor of the extraction efficiency.

Acknowledgements

The EXAFS work has been supported by the European FP7 TALISMAN project, under contract with the European Commission. We acknowledge the ROBL staff for their assistance during EXAFS measurements. The authors gratefully acknowledge the help of Dr Lionel Allouche, Dr Bruno Vincent and Maurice Coppe (Institute of Chemistry, University of Strasbourg, France) for the NMR measurements.

References

  1. S. J. Yoon, J. G. Lee, H. Tajima, A. Yamasaki, F. Kiyono, T. Nakazato and H. Tao, J. Ind. Eng. Chem., 2010, 16, 350 CrossRef CAS.
  2. E. Quijada-Maldonado, J. Romero and I. Osorio, Hydrometallurgy, 2016, 159, 54 CrossRef CAS.
  3. S. Dai, Y. H. Ju and C. E. Barnes, J. Chem. Soc., Dalton Trans., 1999, 1201 RSC.
  4. K. Shimojo, K. Kurahashi and H. Naganawa, Dalton Trans., 2008, 5083 RSC.
  5. A. P. Abbott, G. Frisch, J. Hartley and K. S. Ryder, Green Chem., 2011, 13, 471 RSC.
  6. C. H. C. Janssen, N. A. Macias-Ruvalcaba, M. Aguilar-Martinez and M. N. Kobrak, Int. Rev. Phys. Chem., 2015, 34, 591 CrossRef CAS.
  7. D. Dupont, D. Depuydt and K. Binnemans, J. Phys. Chem. B, 2015, 119, 6747 CrossRef CAS PubMed.
  8. Y. Wang, C. Huang, F. Li, Y. Dong, Z. Zhao and X. Sun, Sep. Purif. Technol., 2016, 162, 106 CrossRef CAS.
  9. A. Rout and K. Binnemans, Dalton Trans., 2014, 43, 1862 RSC.
  10. S. Panja, R. Ruhela, S. C. Tripathi, P. S. Dhami, A. K. Singh and P. M. Gandhi, Sep. Purif. Technol., 2015, 151, 139 CrossRef CAS.
  11. M. L. Dietz and D. C. Stepinski, Talanta, 2008, 75, 598 CrossRef CAS PubMed.
  12. A. Rout, K. A. Venkatesan, T. G. Srinivasan and P. R. Vasudeva Rao, J. Hazard. Mater., 2012, 221–222, 62 CrossRef CAS PubMed.
  13. Y. Shen, W. Li, J. Wu, S. Li, H. Luo, S. Dai and W. Wu, Dalton Trans., 2014, 43, 10023 RSC.
  14. C. Gaillard, V. Mazan, S. Georg, O. Klimchuk, M. Sypula, I. Billard, R. Schurhammer and G. Wipff, Phys. Chem. Chem. Phys., 2012, 14, 5187 RSC.
  15. V. Mazan, I. Billard and N. Papaiconomou, RSC Adv., 2014, 4, 13371 RSC.
  16. P. R. Vasudeva Rao, K. A. Venkatesan, A. Rout, T. G. Srinivasan and K. Nagarajan, Sep. Sci. Technol., 2012, 47, 204 CrossRef CAS.
  17. X. Sun, H. Luo and S. Dai, Chem. Rev., 2012, 112, 2100 CrossRef CAS PubMed.
  18. I. Billard, A. Ouadi and C. Gaillard, Anal. Bioanal. Chem., 2011, 400, 1555 CrossRef CAS PubMed.
  19. L. Y. Yuan, M. Sun, X. H. Liao, Y. L. Zhao, Z. F. Chai and W. Q. Shi, Sci. China: Chem., 2014, 57, 1432 CrossRef CAS.
  20. P. K. Mohapatra, D. R. Raut and A. Sengupta, Sep. Purif. Technol., 2014, 133, 69 CrossRef CAS.
  21. A. Rout, K. A. Venkatesan, T. G. Srinivasan and P. R. Vasudeva Rao, Radiochim. Acta, 2010, 98, 459 CrossRef CAS.
  22. M. S. Murali, N. Bonville and G. R. Choppin, Solvent Extr. Ion Exch., 2010, 28, 495 CrossRef CAS.
  23. I. Billard, A. Ouadi, E. Jobin, J. Champion, C. Gaillard and S. Georg, Solvent Extr. Ion Exch., 2011, 29, 577 CrossRef CAS.
  24. S. Panja, P. K. Mohapatra, S. C. Tripathi, P. M. Gandhi and P. Janardan, Sep. Purif. Technol., 2012, 96, 289 CrossRef CAS.
  25. C. Cuillerdier, C. Musikas, P. Hoel, L. Nigond and X. Vitart, Sep. Sci. Technol., 1991, 26, 1229 CrossRef CAS.
  26. L. Nigond, C. Musikas and C. Cuillerdier, Solvent Extr. Ion Exch., 1994, 12, 297 CrossRef CAS.
  27. G. J. Lumetta, B. K. McNamara, B. M. Rapko, R. L. Sell, R. D. Rogers, G. Broker and J. E. Hutchinson, Inorg. Chim. Acta, 2000, 309, 103 CrossRef CAS.
  28. Q. Tian and M. A. Hughes, Hydrometallurgy, 1994, 36, 315 CrossRef CAS.
  29. L. Nigond, C. Musikas and C. Cuillerdier, Solvent Extr. Ion Exch., 1994, 12, 261 CrossRef CAS.
  30. C. Musikas and G. Thiollet, Meeting of the American Chemical Society, Dallas, April 1989, p. 1989 Search PubMed.
  31. C. Musikas, Sep. Sci. Technol., 1988, 23, 1211 CrossRef CAS.
  32. T. Nakamura and C. Miyake, Solvent Extr. Ion Exch., 1995, 13, 253 CrossRef CAS.
  33. A. B. Patil, P. Pathak, V. S. Shinde, S. V. Godbole and P. K. Mohapatra, Dalton Trans., 2013, 42, 1519 RSC.
  34. M. Bonnaffé-Moity, A. Ouadi, V. Mazan, S. Miroshnichenko, D. Ternova, S. Georg, M. Sypula, C. Gaillard and I. Billard, Dalton Trans., 2012, 41, 7526 RSC.
  35. S. Georg, I. Billard, A. Ouadi, C. Gaillard, L. Petitjean, M. Picquet and V. Solov'ev, J. Phys. Chem. B, 2010, 114, 4276 CrossRef CAS PubMed.
  36. B. Ravel and M. Newville, J. Synchrotron Radiat., 2005, 12, 537 CrossRef CAS PubMed.
  37. M. Newville, B. Ravel, D. Haskel, J. J. Rehr, A. Stern and Y. Yacoby, Phys. B, 1995, 208–209, 154 CrossRef.
  38. J. J. Rehr and R. C. Albers, Rev. Mod. Phys., 2000, 72, 621 CrossRef CAS.
  39. I. Billard, A. Ouadi and C. Gaillard, Dalton Trans., 2013, 42, 6203 RSC.
  40. A. Ikeda, C. Hennig, A. Rossberg, S. Tsushima, A. C. Scheinost and G. Bernhard, Anal. Chem., 2008, 80, 1102 CrossRef CAS PubMed.
  41. C. Görller-Wallrand and S. De Jaegere, J. Chim. Phys. Phys.-Chim. Biol., 1972, 4, 726 Search PubMed.
  42. S. Wahu, J.-C. Berthet, P. Thuery, D. Guillaumont, M. Ephritikhine, R. Guillot, G. Cote and C. Bresson, Eur. J. Inorg. Chem., 2012, 3747 CrossRef CAS.
  43. D. Ternova, M. Boltoeva, L. Cointeaux, C. Gaillard, V. Kalchenko, V. Mazan, S. Miroshnichenko, P. K. Mohapatra, A. Ouadi, N. Papaiconomou, M. Petrova and I. Billard, J. Phys. Chem. B, 2016 Search PubMed.
  44. A. Ruas, P. Pochon, J.-P. Simonin and P. Moisy, Dalton Trans., 2010, 39, 10148 RSC.
  45. S. Katsuta, Y. Watanabe, Y. Araki and Y. Kudo, ACS Sustainable Chem. Eng., 2016, 4, 564 CrossRef CAS.
  46. J. Foropoulos and D. D. DesMarteau, Inorg. Chem., 1984, 23, 3720 CrossRef CAS.
  47. M. L. Dietz, J. A. Dzielawa, I. Laszak, B. A. Young and M. P. Jensen, Green Chem., 2003, 5, 682 RSC.
  48. M. L. Dietz and D. C. Stepinski, Green Chem., 2005, 7, 747 RSC.
  49. C. H. C. Janssen, A. Sanchez and M. N. Kobrak, ChemPhysChem, 2014, 15, 3536 CrossRef CAS PubMed.

Footnote

Electronic supplementary information (ESI) available. See DOI: 10.1039/c6ra11345a

This journal is © The Royal Society of Chemistry 2016
Click here to see how this site uses Cookies. View our privacy policy here.