Optimized Zn2SnO4 nanoparticles with enhanced performance for photodetectors and photocatalysts†
Yu-Fen Wangac,
Yang Dingac,
Jin-Sheng Zhao*b,
Xin Wangac,
De-Jun Liac and
Xi-Fei Li *ac
*ac
aEnergy & Materials Engineering Centre, College of Physics and Materials Science, Tianjin Normal University, Tianjin 300387, China. E-mail: xfli@mail.tjnu.edu.cn
bShandong Key Laboratory of Chemical Energy Storage and Novel Cell Technology, Liaocheng University, Liaocheng, 252059, P. R. China. E-mail: j.s.zhao@163.com
cTianjin International Joint Research Centre of Surface Technology for Energy Storage Materials, Tianjin 300387, China
First published on 7th July 2016
Abstract
In this study, Zn2SnO4 nanoparticles with different sizes are successfully synthesized by a very convenient hydrothermal process. To sufficiently characterize the as-synthesized Zn2SnO4 nanoparticles, XRD, FE-SEM, TEM, UV and BET analyses are carried out. Moreover, the photocurrent response and photocatalytic activity properties of various Zn2SnO4 nanoparticles have been studied. The results indicate that the photocurrent response and photodegradation efficiency behavior of the 3.3 nm Zn2SnO4 nanoparticles are significantly superior to that of the 4.2 nm and 6.2 nm nanoparticles. It is due to small particle size effects with large surface-to-volume ratios, which can increase the number of active surface sites.
1. Introduction
Zn2SnO4 is considered as one of the most prominent compounds in the catalogue of ternary oxide semiconductors, with a typical inverse spinel structure (space group Fd3m), possessing a wide band gap (3.6–3.8 eV) and high electron mobility (10–15 cm2 V−1 s−1), and exhibiting an impressive power conversion efficiency in dye-sensitized solar cells,1–3 Li-ion batteries,4 with an excellent photocatalytic property in the degradation of organic pollution,5,6 gas sensors7,8 and photodetectors.9 At the same time, nanoparticles with sizes of 1–20 nm have significant differences from their bulk form, therefore the controlled growth of monodispersed nanoparticles is crucial in exploiting their unique properties due to the larger specific surface area of nanoparticles. Furthermore, reliable application performance-related properties are required to be consistent, which are only accessible with monodisperse nanoparticles.10 It was reported that Zn2SnO4 is generally fabricated via a solid-state reaction at high-temperatures between SnO2 and ZnO powders; however, such a strategy needs a high temperature and high energy cost. Moreover, Zn2SnO4 can be also be synthesized via a thermal evaporation method at high temperatures by means of heating the metal powder or metal oxide.11,12 Recently, a Zn2SnO4 powder was prepared via a hydrothermal process for the first time.13 The reaction temperature of such a hydrothermal synthesis is much lower than the thermal evaporation method, which is a distinct advantage for the preparation of Zn2SnO4. It has been demonstrated that Zn2SnO4 nanocrystals were prepared under hydrothermal conditions by the reaction of inorganic salts, such as N2H4·H2O, NaOH or NH3·H2O, yielding Zn2SnO4 nanocrystals with cube-shaped, rodlike, or spherical morphologies.14–17 In the same fabrication approach, it still remains a challenge, especially for Zn2SnO4 nanoparticles (<8 nm), for the concurrent control of crystal structure and size.Herein, we introduce the synthesis of Zn2SnO4 nanoparticles with tailorable sizes based on the hydrothermal method. The photocurrent response and photocatalytic activity properties of the size tailored Zn2SnO4 nanoparticles (3.3, 4.2 and 6.2 nm) have been investigated. The photocurrent response and photodegradation efficiency of 3.3 nm Zn2SnO4 nanoparticles were significantly superior to that of the 4.2 nm and 6.2 nm Zn2SnO4 nanoparticles.
2. Experimental
2.1 Synthesis of Zn2SnO4 nanoparticles
The 4.2 nm Zn2SnO4 nanoparticles are prepared through a hydrothermal process, as previously reported by our group.1 A series of experiments were performed by the adjustment of the mineralizer and using a different ratio of H2O and 1,2-propylene glycol.2.2 Characterization
The phase of the as-prepared Zn2SnO4 nanoparticles was characterized by powder X-ray diffraction (XRD, Cu Kα radiation, λ = 1.5418 Å) on a Bruker D8 Advance X-ray diffractometer. The morphology, size and the intrinsic structure of Zn2SnO4 was characterized by field emission scanning electron microscopy (FE-SEM, SU8010) as well as by transmission electron microscopy (TEM) and high-resolution transmission electron microscopy (HR-TEM) by means of a JEOL-2010 HR transmission electron microscope. The N2 adsorption–desorption isotherms and pore-size distribution of the Zn2SnO4 nanoparticles are measured on an ASAP 2010 Surface Area Analyzer (Micromeritics Instrument Corporation). The thickness of the Zn2SnO4 film is measured by using a profilometer (Ambios, XP-1). UV-Vis absorption spectra are measured on a UV-Vis-NIR spectrophotometer (UV, Shimadzu UV-3600). Photocurrent measurements were conducted with a Zennium electrochemical workstation (ZAHNER). To measure the photoelectrical performance of the Zn2SnO4 nanoparticles, a three-electrode cell was used, namely, a platinum wire was used as the counter electrode, a Ag/AgCl (saturated KCl) electrode as the reference electrode, and the different sized Zn2SnO4 nanoparticles/FTO electrode as the photoanode. A 500 W mercury lamp (365 nm) was used as the light source, with the distance between the photoreaction vessel and UV light being 8 cm.2.3 Photoelectrochemical characterizations
The photoelectrochemical characteristics are measured on a Zennium electrochemical workstation (ZAHNER-2), where a 500 W mercury lamp (365 nm) is used as the light source using a three-compartment cell. Typically, 5.0 mg of the Zn2SnO4 nanoparticles are added to 10 mL of ethanol, and then stirred for about 15 min. Furthermore, a thin-film device is fabricated by spray-coating the Zn2SnO4 nanoparticles onto FTO glass, with an average thickness of about 5.0 μm, which formed the Zn2SnO4/FTO glass working electrodes, which are then dried at 70 °C for 6 h in air. The Ag/AgCl electrode and Pt wire are used as the reference electrode and counter electrode, respectively, while a Na2SO4 aqueous solution (0.01 M) is employed as the electrolyte.2.4 Photocatalytic experiments
Typically, 20.0 mg of photocatalyst (Zn2SnO4 nanoparticles) is added into a 100 mL of an aqueous solution with methylene blue (MB) dye (1 × 10⁻⁵ mol L−1) and rhodamine B (RhB) (1 × 10⁻⁵ mol L−1). In the first place, the MB suspensions are stirred for 30 min in the dark, subsequently, under a stirring condition, the photoreaction vessel is exposed to UV irradiation (500 W mercury lamp). The distance is 8 cm between the photo-reaction vessel and the UV light. At given time intervals (10 S), ∼3 mL of the photo-reacted suspension is analyzed via recording variations in the MB absorption peak maximum in the UV-Vis spectra on a UV-Vis spectrophotometer.3. Results and discussion
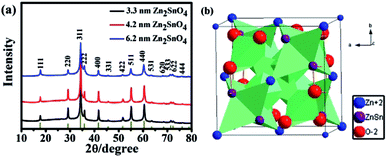
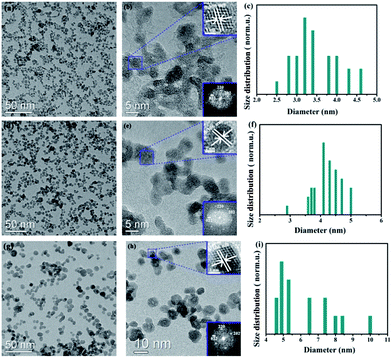
The phase composition and structure of the as-prepared Zn2SnO4 nanoparticles are characterized by powder X-ray diffraction (XRD) measurements, which are shown in Fig. 1a. The peaks of the XRD patterns are indexed as the (111), (220), (311), (222), (400), (331), (442), (511), (440), (531), (620), (533), (622), and (444) reflections, corresponding to the cubic structure of Zn2SnO4 (JCPDS Card No. 24-1470), with the cell constants a = b = c = 8.657 Å. No other characteristic peaks are observed, indicative of the high purity of the as-synthesized samples. Based on the full width of the (311) peak of Zn2SnO4 (at 26.58°) at half maximum (FWHM) via the Scherrer's equation, the average sizes of the nanocrystals are ∼3.0 nm, 4.3 nm and 6.2 nm. Fig. 1b shows the structure of the cubic Zn2SnO4 unit cell, with the connectivities of Zn, O and Sn described below. The Zn2SnO4 complex has a typical inverse spinel structure with the A and B sites occupied by Zn and Sn respectively, namely, the Zn and half of the Sn share the octahedral sites, while the remained Sn occupy the tetrahedral sites.Serial experiments of adjustment of the mineralizers and different ratio of H2O and 1,2-propylene glycol were performed to control the sizes of the Zn2SnO4 nanoparticles. Fig. 2 shows the typical TEM images of the as-synthesized Zn2SnO4 nanoparticles. Low-magnification TEM images of the as-synthesized Zn2SnO4 nanoparticles clearly reveal that the as-synthesized materials were uniform, as shown in Fig. 2a, d and g. High-magnification TEM images (Fig. 2b, e and h) show that all the Zn2SnO4 nanoparticles are well-crystallized. The Zn2SnO4 nanoparticles exhibit clear lattice fringes, and the lattice spacing is 0.306 nm, which is inset in Fig. 2b, e and h, and can be indexed as the (220) plane of the cubic structure of Zn2SnO4. Moreover, the FFT image (inset in Fig. 2b, e and h, right lower) is derived from a single Zn2SnO4 nanoparticle, which is combined with the HR-TEM image (inset Fig. 2b, e and h, right upper), and ensures the single crystalline form of the Zn2SnO4 nanocrystal. The size of the Zn2SnO4 nanoparticles, determined by TEM image analysis, was about 4.2 nm in diameter (Fig. 2f); the results are consistent with our previous report.1 Herein, a series of comparative experiments are further performed, while keeping the other conditions for the synthesis of the 4.2 nm Zn2SnO4 nanoparticles the same. When triethylamine is used as the mineralizer, the size of the nanoparticles in the as-synthesized Zn2SnO4 sample was about 3.3 nm, as shown in Fig. 2c. However, when 40 mL of H2O was used as the solvent, the size of the nanoparticles in the as-synthesized Zn2SnO4 sample was 6.2 nm (Fig. 2i). It was found that nanoparticles tended to grow to larger sizes as a result of a faster rate for grain boundary migration in the solution,18 and that the sizes are in good agreement with the calculated particle sizes from the XRD results.
UV-Vis absorption spectra are useful measurements, which can be related to the band gaps (Eg) of the testing samples. Thus, a material's structural variation can be asserted by this method. The presently prepared Zn2SnO4 nanoparticles with different sizes obtained at various experimental conditions are further researched by UV-Vis measurements and the obtained results are shown in Fig. 3a. It is well known that nano-sized materials can lead to a blue shift in the absorption wavelength. The 3.3 nm and 4.2 nm Zn2SnO4 nanoparticles exhibited a larger blue shift compared to the 6.2 nm Zn2SnO4 nanoparticles. According to the data from the absorption spectra, the Eg of the product can be calculated using the Tauc's method,19 which is estimated from the intercept of the extrapolated linear part of the (αhν)2 versus the hν curve with an energy axis (see Fig. 3b). Herein, α, the absorption coefficient, is measured as a function of the photon energy, whereas hν, the photon energy, is determined by the irradiation wavelength. It is observed from Fig. 3b that the band gaps of the 3.3 nm Zn2SnO4, 4.2 nm Zn2SnO4 and 6.2 nm Zn2SnO4 nanoparticles are about 3.80, 3.76 and 3.73 eV, respectively, which corresponds to the direct transition gap of the valence band and the conduction band. Compared to the bulk Zn2SnO4, the absorption edge of the present three Zn2SnO4 nanoparticles shows a blue shift. It is proposed that the increase in the band gap of the Zn2SnO4 nanoparticles indicate the quantum confinement effects result from the small size regime,20 also indicated by FE-SEM and TEM results.
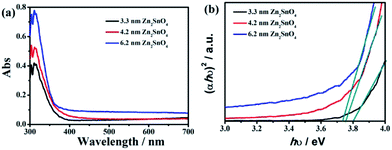 | ||
| Fig. 3 (a) UV-Vis absorption spectra and (b) plot of (αhν)2 as a function of Zn2SnO4 nanoparticles with different sizes. | ||
The specific surface areas as well as the pore size distributions of the Zn2SnO4 nanoparticles with different sizes are obtained by analysis of the nitrogen adsorption–desorption isotherms (Fig. 4). For the calculation and determination of the surface area, the data are fitted into a Brunauer–Emmett–Teller (BET) model. The surface areas of the 3.3 nm Zn2SnO4, 4.2 nm Zn2SnO4 and 6.2 nm Zn2SnO4 nanoparticles are 181.5, 159.6 and 130.9 m2 g−1, respectively. In light of the Barrett–Joyner–Halenda (BJH) model (based on cylindrical pores), the pore size distribution and average pore diameter of different sized Zn2SnO4 nanoparticles can be calculated. The pore size distributions over the complete range of the isotherm are calculated by the density functional theory module using the Micromeritics software (BJH is limited to pore diameters ≥ 2 nm), which is shown in Fig. 4b. The pore distribution follows the order of 6.2 nm Zn2SnO4 nanoparticles > 4.2 nm Zn2SnO4 nanoparticles > 3.2 nm Zn2SnO4 nanoparticles, and the maximum pore size distributions are around 4.06, 4.68 and 6.82 nm, respectively. However, the adsorption–desorption isotherms generated for the Zn2SnO4 nanoparticles with different sizes are very similar in shape. The main differences in the distribution curves are the relatively larger pore region.
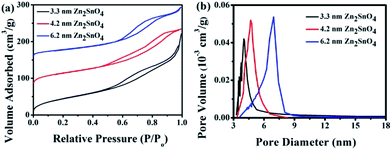 | ||
| Fig. 4 (a) N2 adsorption–desorption isotherm curves and (b) BJH pore size distributions calculated from N2 desorption isotherms of Zn2SnO4 nanoparticles with different sizes. | ||
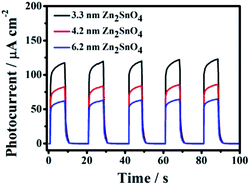
The ON–OFF light cycles are carried out to investigate the photoinduced performances of the Zn2SnO4 nanoparticles with different sizes. Photoresponses of the different sized Zn2SnO4 nanoparticle samples under a UV light pulse are performed using a UV hand lamp with a 365 nm wavelength (Fig. 5), and an on–off interval of 10 s. When the UV light periodically is turned “on” and “off”, the photocurrent is switched from the “on” to the “off” state reproducibly. The switching is reversible and very quick between the two states, ensuring that the Zn2SnO4 device performs as a photosensitive switch with high-quality. Upon UV illumination, the photocurrent of the 3.3 nm Zn2SnO4 nanoparticles rapidly increased from 3.5 μA to a steady value of approximately 120 μA on average. The 4.2 nm and 6.2 nm Zn2SnO4 nanoparticles obtained a photocurrent from 2.2 μA to a steady value of approximately 82 μA and from 1.8 μA to 62 μA on average, respectively. The photocurrent then rapidly decreased to the initial level when the UV light is turned off, indicating that the Zn2SnO4 photodetector has a perfect stability. The photocurrent induced by generated electron–hole pairs is significant enhanced,21 which is about 35 times (IUV/Idark). For the n-type UV detector, it is widely accepted that a lower conductivity is the result of adsorbed oxygen molecules in the dark; herein, the free electrons are captured, and at the same time, near the detector surface, a depletion layer is formed:
| O2 (g) + e− → O2− (ad) | (1) |
When the photons with a higher energy than the band gap of the Zn2SnO4 nanoparticles are exposed to UV light, the holes generated by the photons will transfer to the surface, which can recombine with the adsorbed free electrons afterwards. This process can be described with the reaction below:
| h+ + O2− (ad) → O2 (g) | (2) |
Thus, there is a notable photocurrent enhancement resulting in extra photo-generated electrons.22,23 The improved performance of the photoconductive device (3.3 nm Zn2SnO4 nanoparticles) may be due to the increase in the adsorbed oxygen molecules.
The photocatalytic properties of the Zn2SnO4 nanoparticles have been widely studied for their future applications such as environmental remediation. Herein, we study the photocatalytic properties of Zn2SnO4 nanoparticles for the photodegradation of MB in solution, which is irradiated by UV light, in which the normalized temporal concentration changes (C/C0) of MB are proportional to the normalized maximum absorbance (A/A0) during photodegradation.24 The photocatalytic activity of different sized Zn2SnO4 nanoparticles is tested to confirm the effect of particle size. The photocatalytic activity of different sizes of Zn2SnO4 nanoparticles are shown in Fig. 6. It suggests that the photocatalytic activity decreased monotonically with the decrease in the specific surface area of the Zn2SnO4 nanoparticles. It was found that the 3.3 nm Zn2SnO4 nanoparticles (181.5 m2 g−1) has a larger specific surface area than the 4.2 nm Zn2SnO4 nanoparticles (159.6 m2 g−1) and the 6.2 nm Zn2SnO4 nanoparticles (130.9 m2 g−1). The initial MB for the 3.3 nm, 4.2 nm and 6.2 nm Zn2SnO4 nanoparticles is decomposed by 81%, 55% and 48%, respectively, under UV light illumination for 100 minutes. We also studied the photocatalytic properties of the Zn2SnO4 nanoparticles (3.3 nm, 4.2 nm and 6.2 nm) for the photodegradation of RhB in solution, and the 3.3 nm Zn2SnO4 nanoparticles have a better efficiency than the other Zn2SnO4 nanoparticles (4.2 nm and 6.2 nm), which is shown in Fig. S2 (ESI†). Smaller Zn2SnO4 nanoparticles (3.3 nm) exhibit an outstanding photocatalytic activity due to their small particle size and therefore larger surface-to-volume ratios are able to enhance the numbers of active surface sites, wherein the charge carriers are generated and can react with the absorbed molecules, while at the same time, superoxide radicals and hydroxyls are formed.25 Moreover, the smaller size of the Zn2SnO4 could facilitate the interfacial charge transfer rate as well as inhibit the high charge carrier recombination rate.26
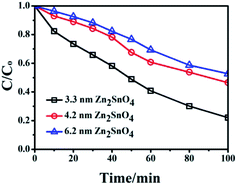 | ||
| Fig. 6 Photocatalytic activities of Zn2SnO4 nanoparticles with different sizes for photodegradation of MB molecules. | ||
4. Conclusions
In conclusion, we have demonstrated a simple one-pot hydrothermal process to control Zn2SnO4 nanoparticle size (3.3, 4.2 and 6.2 nm). The photoelectric and photocatalytic properties of the Zn2SnO4 nanoparticles with different sizes have been investigated in detail. The photocurrent response and photodegradation efficiency of the 3.3 nm Zn2SnO4 nanoparticles are significantly superior to that of the Zn2SnO4 nanoparticles with 4.2 nm and 6.2 nm diameters. The enhancement is due to the smaller Zn2SnO4 nanoparticle size (3.3 nm) with a larger surface-to-volume ratio, which could enhance the numbers of active surface sites. In addition, the different sized Zn2SnO4 may be applied to various fields, for example, dye-sensitized solar cells, electrochemical energy storages, batteries and gas sensors.Acknowledgements
The authors acknowledge the financial supports from the Key Projects of Tianjin Municipal Natural Science Foundation of China (14JCZDJC32200 and 13JCZDJ33900), National Natural Science Foundation of China (51572194, 51473074 and 51272176), the Thousand Youth Talents in Tianjin of China program, the Academic Innovation Funding (52XC1404), Application Development Foundation of Tianjin Normal University (52XK1508), Scientific Research Foundation of Tianjin Normal University (5RL131), and National Training Program of Innovation and Entrepreneurship for Undergraduates in Tianjin of China (201610065012.00).Notes and references
- Y. F. Wang, K. N. Li, Y. F. Xu, H. S. Rao, C. Y. Su and D. B. Kuang, Nanoscale, 2013, 5, 5940–5948 RSC.
- Y. F. Li, X. Z. Zheng, H. X. Zhang, B. B. Guo, A. Y. Pang and M. D. Wei, Electrochim. Acta, 2011, 56, 9257–9261 CrossRef CAS.
- P. P. Das, A. Roy, S. Das and P. S. Devi, Phys. Chem. Chem. Phys., 2016, 18, 1429–1438 RSC.
- Y. Zhao, Y. Huang, X. Sun, H. Huang, K. Wang, M. Zong and Q. Wang, Electrochim. Acta, 2014, 120, 128–132 CrossRef CAS.
- J. Zeng, M. Xin, K. W. Li, H. Wang, H. Yan and W. J. Zhang, J. Phys. Chem. C, 2008, 112, 4159–4167 CAS.
- W. W. Wang, Y. J. Zhu and L. X. Yang, Adv. Funct. Mater., 2007, 17, 59–64 CrossRef CAS.
- Y. Q. Jiang, C. X. He, R. Sun, Z. X. Xie and L. S. Zheng, Mater. Chem. Phys., 2012, 136, 698–704 CrossRef CAS.
- Y. Q. Jiang, X. X. Chen, R. Sun, Z. Xiong and L. S. Zheng, Mater. Chem. Phys., 2011, 129, 53–61 CrossRef CAS.
- Y. Zhao, L. Hu, H. Liu, M. Liao, X. Fang and L. Wu, Sci. Rep., 2014, 4, 06847 CrossRef CAS PubMed.
- A. C. Templeton, M. P. Wuelfing and R. W. Murray, Acc. Chem. Res., 2000, 33, 27–36 CrossRef CAS PubMed.
- H. Y. Chen, J. X. Wang, H. C. Yu, H. X. Yang, S. S. Xie and J. Q. Li, J. Phys. Chem. B, 2005, 109, 2573–2577 CrossRef CAS PubMed.
- J. S. Jie, G. Z. Wang, X. H. Han, J. P. Fang, Q. Y. Yu, Y. Liao, B. Xu, Q. T. Wang and J. G. Hou, J. Phys. Chem. B, 2004, 108, 8249–8253 CrossRef CAS.
- J. Fang, A. H. Huang, P. X. Zhu, N. S. Xu, J. Q. Xie, J. S. Chi, S. H. Feng, R. R. Xu and M. M. Wu, Mater. Res. Bull., 2001, 36, 1391–1397 CrossRef CAS.
- H. L. Zhu, D. R. Yang, G. X. Yu, H. Zhang, D. L. Jin and K. H. Yao, J. Phys. Chem. B, 2006, 110, 7631–7634 CrossRef CAS PubMed.
- A. Rong, X. P. Gao, G. R. Li, T. Y. Yan, H. Y. Zhu, J. Q. Qu and D. Y. Song, J. Phys. Chem. B, 2006, 110, 14754–14760 CrossRef CAS PubMed.
- B. Tan, E. Toman, Y. G. Li and Y. Y. Wu, J. Am. Chem. Soc., 2007, 129, 4162–4163 CrossRef CAS PubMed.
- T. L. Villarreal, G. Boschloo and A. Hagfeldt, J. Phys. Chem. C, 2007, 111, 5549–5556 Search PubMed.
- G. Dhanaraj, K. Byrappa, V. Prasad, M. Dudley, F. Abbona and D. Aquilano, Springer Handbook of Crystal Growth, Springer, Berlin Heidelberg, 2010, pp. 53–87 Search PubMed.
- J. Tauc and A. J. Menth, J. Non-Cryst. Solids, 1972, 8–10, 569–585 CrossRef CAS.
- J. W. Zhu, H. Q. Chen, H. B. Liu, X. J. Yang, L. D. Lu and X. Wang, Mater. Sci. Eng., A, 2004, 384, 172–176 CrossRef.
- L. J. Chen, A. Manekkathodi, M. Y. Lu and C. W. Wang, Adv. Mater., 2010, 22, 4059–4063 CrossRef PubMed.
- P. D. Yang, H. Kind, H. Q. Yan, B. Messer and M. Law, Adv. Mater., 2002, 14, 158–160 CrossRef.
- L. Li, P. C. Wu, X. S. Fang, T. Y. Zhai, L. Dai, M. Y. Liao, Y. Koide, H. Q. Wang, Y. Bando and D. Golberg, Adv. Mater., 2010, 22, 3161–3165 CrossRef CAS PubMed.
- H. Zhang, X. J. Lv, Y. M. Li, Y. Wang and J. H. Li, ACS Nano, 2010, 4, 380–386 CrossRef CAS PubMed.
- N. P. Xu, Z. F. Shi, Y. Q. Fan, J. H. Dong, J. Shi and Z. C. Hu, Ind. Eng. Chem. Res., 1999, 38, 373–379 CrossRef CAS.
- A. Testino, I. R. Bellobono, V. Buscaglia, C. Canevali, M. D'Arienzo, S. Polizzi, R. Scotti and F. Morazzoni, J. Am. Chem. Soc., 2007, 127, 3564–3575 CrossRef PubMed.
Footnote |
| † Electronic supplementary information (ESI) available: FE-SEM images of Zn2SnO4 nanoparticles with different sizes. See DOI: 10.1039/c6ra13769e |
| This journal is © The Royal Society of Chemistry 2016 |

