Magnetic solid phase extraction of polycyclic aromatic hydrocarbons and chlorophenols based on cyano-ionic liquid functionalized magnetic nanoparticles and their determination by HPLC-DAD

Shabnam Bakhshaeia, Muhammad Afzal Kamboha, Hamid Rashidi Nodehac, Sharifuddin Md Zaina, Siti Khalijah Mahmad Rozia, Sharifah Mohamad*ab and Issam A. Mohammed Mohialdeena
aDepartment of Chemistry, Faculty of Science, University of Malaya, Kuala Lumpur, 50603, Malaysia. E-mail: bakhshaei.s@gmail.com; afzal82_kamboh@yahoo.com; hamid_rashidi82@yahoo.com; smzain@um.edu.my; sitikhalijah_mahmadrozi@yahoo.com; sharifahm@um.edu.my; issam@um.edu.my; Fax: +60 379674193; Tel: +60 379676751
bUniversity of Malaya Centre for Ionic Liquids, University of Malaya, Kuala Lumpur 50603, Malaysia
cDepartment of Chemistry, Faculty of Science, University of Tehran, Tehran, 1417466191, Iran

Received 26th May 2016 , Accepted 2nd August 2016

First published on 9th August 2016


Abstract

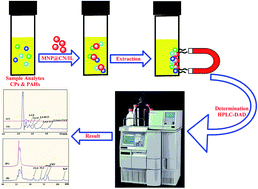
A magnetic solid-phase extraction (MSPE) procedure on the newly synthesized cyano-ionic liquid functionalized magnetic nanoparticles (MNP@CN/IL) was established and validated for the separation/preconcentration of polycyclic aromatic hydrocarbons (PAHs) and chlorophenols (CPs) from water samples prior to their HPLC-DAD determination. The new magnetic (MNP@CN/IL) adsorbent was characterized by Fourier transform infrared (FT-IR) spectroscopy, X-ray diffraction (XRD), elemental analysis (CHNS), energy-dispersive X-ray spectroscopy (EDX), vibrating sample magnetometry (VSM), thermal gravimetric analysis (TGA) and transmission electron microscopy (TEM). The proposed method showed preconcentrations of 200 and 100 with low limits of detection (LOD = 0.40–0.59 and 0.35–0.67 μg L−1) with linearity ranges from 0.1–100 and 3–100 μg L−1 for PAHs and CPs, respectively. The extraction recoveries from environmental samples (leachate and sludge from a landfill site) ranged from 89.50–110.2% and 80.67–112.7% for PAHs and CPs, respectively, with satisfactory precision (% RSD less than 5%). The combination of cyano group and ionic liquid on the surface of the MNPs enhanced the extraction efficiency which might be due to π–π interactions as well as electrostatic interactions.

1. Introduction

Nowadays, the contamination of natural streams due to different organic pollutants such as polycyclic aromatic hydrocarbons (PAHs) and chlorophenols (CPs) is becoming a critical issue for environmental researchers. CPs are extensively used for the generation of different kinds of industrial products such as fertilizers, pesticides, fungicides, herbicides, antiseptics, wood preservatives as well as being used as intermediates in many manufacturing processes such as for pharmaceuticals and dyes.1–5 PAHs are mainly released into the ecosystem through oil spills, and refining activities; by incomplete combustion or pyrolysis of organic materials especially fossil fuels and incineration of wastes.6–8 The release of PAH and CP contaminated effluents into aqueous streams has been found to be very harmful to human beings. PAHs and CPs can cause histopathological alterations, genotoxicity, mutagenicity and carcinogenicity to humans.9–14 US Environmental Protection Agency (EPA) and the European Union (EU) have classified numerous CPs as main perilous substances. According to Japanese Ministry of Health, Labour and Welfare; the maximum tolerable level for phenols in drinking water is 5 μg L−1. The US EPA has classified various PAHs such as benzo[a]pyrene, benz[a]anthracene, chrysene, benzo[b]fluoranthene, benzo[k]fluoranthene, dibenz[a,h]anthracene, and indeno[1,2,3-cd]pyrene as Group B2 due to their probability of carcinogenic risk to human health. According to the WHO, PAHs concentration in drinking water should be between 1 ng L−1 to 11 μg L−1.15,16 However, exceeded i.e., 2.848 mg L−1 and 4.596 mg L−1 of PAHs and CPs, respectively has been reported in drinking water.17,18 Hence, due to the exceeded limit and their toxic potencies to human health; rapid, sensitive, reliable and economically feasible method for the separation/preconcentration of PAHs and CPs from environmental samples is extremely necessary.19 Solid phase extraction (SPE) due to its high separation capacity, low cost, ease of automation and ability to combine with other detection techniques is considered as one of the most adequate isolation/preconcentration method for PAHs and CPs from environmental samples.20–23 Recently magnetic solid phase extraction (MSPE) has received more attention in trace analysis.3,24 Magnetisable adsorbents provide easier, faster and cheaper separation, which avoids additional centrifugation, filtration, column passing operation demands and packing of the adsorbents into SPE cartridges.24–30 Different functionalized magnetic adsorbents such as metals oxides,31 carbon materials,32 silica materials,33 metal organic frameworks34 and ionic liquids35–37 coated on magnetic iron oxide nanoparticles have been synthesised and employed in MSPE for the separation/preconcentration of PAHs and CPs. Though, magnetic adsorbents provide large surface area, high efficiency and environmental friendly outcomes due to easy reusability but still they suffer some drawbacks, i.e. sensitivity and selectivity. To overcome these limitations, intensive attempts have been made to improve the selectivity of magnetic adsorbents for the preconcentration of PAHs and CPs from environmental samples. In this view, cyanopropylsiloxanes as polarizable adsorbents have shown very high extraction efficiency towards polar compounds at high as well as low temperature conditions.38–40 The unshared electronic pair of nitrogen in cyano group increase polar affinity through the formation of intermolecular hydrogen bonding with hydrogen donor molecules such as phenols, ketones, alcohols and esters due to the presences of π-electrons.38 However, conventionally prepared cyano based silica coated adsorbent are not much more stable at harsh chemical conditions.38 The chemical attachments of cyanopropylsiloxanes on the surface magnetic nanoparticle enhance their stability under harsh chemical conditions. On other hand the extraction performance of adsorbents towards PAHs and CPs can be enhanced by introducing the π–π conjugation with aromatic moieties.29 In this respect, imidazolium-based ionic liquids by virtue of a benzyl group into the cationic part of ionic liquids (ILs) deserve particular attention.41–44 ILs as a new class of green organic materials has excellent chemical properties such as non-volatile, thermally stable and unusual dual polarity nature. ILs have a significant selectivity towards both polar and nonpolar analytes through multiple interactions, i.e. electrostatic, hydrophobic and π–π interaction.45 However, environmental concerns have restricted its frequent utilization because of expensive synthesis, low mass transfer and tedious equilibrium as well as phases separation. Since these drawbacks can be easily shorten by the immobilisation of ILs onto magnetic nanoparticles.46 Consequently, in present work a magnetic solid-phase extraction (M-SPE) procedure on the newly synthesized cyano-ionic liquid functionalized magnetic nanoparticles (MNP@CN/IL) was established as well as validated for the separation/preconcentration of polycyclic aromatic hydrocarbons (PAHs) and chlorophenols (CPs) from water samples prior to their HPLC-DAD determination.

2. Experimental

2.1 Chemical and reagent

All chemicals as well as reagents were of analytical and chromatographic grades. Cyanopropyltriethoxysilane, 1-benzylimidazole, 3-(chloropropyl)-trimethoxysilane and ammonium hydroxide solution 25% were purchased from Sigma-Aldrich, Germany. (NH4)2Fe(SO4)2·6H2O was obtained from Guangdong, China. FeCl3·6H2O, toluene and ethylacetate were purchased from R&M Chemical, UK, while 2-propanol purchased was from J.T.Baker. Diethyl ether was purchased from Fisher-Scientific, UK. Dichloromethane was obtained from Sigma-Aldrich, USA. Hydrochloric acid as well as HPLC grade acetonitrile, methanol and n-hexane were purchased from Merck, Germany. The selected analytes (Table 1): flourene (FLO), fluoranthene (FLU), pyrene (PYR), chrysene (CRY), benzo(a)pyrene (BaP) were purchased from Supelco Analytical, USA. 2-Chlorophenol (2-CP), 3-chlorophenol (3-CP), 2,4-dichlorophenol (2,4-DCP), 2,4,6-trichlorophenol (2,4,6-TCP) and 2,3,4,6-tetrachlorophenol (2,3,4,6-TTCP) were purchased from Sigma-Aldrich, Germany.
Table 1 Chemical structure of PAHs and CPs used in this study
Analyte (PAHs) Structure Analyte (CPs) Structure
Flourene image file: c6ra13702d-u1.tif 2-Chlorophenol image file: c6ra13702d-u2.tif
Fluoranthene image file: c6ra13702d-u3.tif 3-Chlorophenol image file: c6ra13702d-u4.tif
Pyrene image file: c6ra13702d-u5.tif 2,4-Dichlorophenol image file: c6ra13702d-u6.tif
Chrysene image file: c6ra13702d-u7.tif 2,4,6-Trichlorophenol image file: c6ra13702d-u8.tif
Benzo(a)pyrene image file: c6ra13702d-u9.tif 2,3,4,6-Tetrachlorophenol image file: c6ra13702d-u10.tif


2.2 Instruments

IR spectra were recorded on Perkin Elmer X1FTIR Fourier Transform Infrared Spectroscopy (FT-IR) in KBR mode in the range of 400–4000 cm−1. X-ray diffraction (XRD) was measured with a PANalytical Empyrean X-ray diffractometer (40 mA, 40 kV) using Cu Kα radiation in the scanning range of 5 (2θ) to 80° (2θ) at rate of 0.07° min−1. The elemental compositions were analysed by energy-dispersive X-ray spectroscopy (EDX) as well as Perkin Elmer series II CHNS 2400 analyser. The magnetic properties were analysed by using vibrating sample magnetometer (VSM LakeShore 7400 series). Thermogravimetric analysis (TGA) was conducted under nitrogen atmosphere in the range of 50–900 °C at a heating rate of 10 °C min−1 using (TGA7, Perkin-Elmer, USA). The size and morphology of magnetic particles were observed by transmission electron microscopy (TEM) (Tecnai G2 20 S-Twin). A HPLC system (Shimadzu, Japan) equipped with LC-20AT pump, SPD-M20A diode array detector (DAD), SIL-20A HT auto sampler and CTO-10AS VP column oven was used for chromatography performance. The HPLC column used was a C-18 reverse (250 × 4.6 mm) hypersil gold, particle Sz. (μ) 5, Thermo science, USA.

2.3 Chromatographic conditions

The isocratic separation was carried out using acidified (1% with acetic acid) water/methanol (20[thin space (1/6-em)]:[thin space (1/6-em)]80) and water/acetonitrile (20[thin space (1/6-em)]:[thin space (1/6-em)]80), as a mobile phase with 1 mL min−1 flow rate for CPs and PAHs respectively. The HPLC column temperature was set at 40 °C. The sample inject volume was 10 μL for PAHs and 20 μL for CPs respectively. The DAD detection for all the selected CPs was carried out at 280 nm, while selected PAHs i.e., FLO, FLU, PYR, CRY and BaP were analyzed at multiple wave lengths i.e., 254, 284, 270 and 266 nm respectively.

2.4 Synthesis

2.4.1 Synthesis of 1-benzyl-3-(trimethoxysilylpropyl)imidazolium chloride (BTMP-IM). 1-Benzyl-3-(trimethoxysilylpropyl) imidazolium chloride (BTMP-IM), was synthesized as follow; 1-benzylimidazole (316 mg, 2 mmol) and 3-(chloropropyl)-trimethoxysilane (3.67 mL, 2 mmol) were added to a two neck 50 mL round-bottomed flask and reaction mixture was stirred under nitrogen atmosphere at 80 °C for 48 h. The reaction mixture was cooled to room temperature and rinsed with 25 mL diethyl ether. Following the removal of diethyl ether by rotary evaporator, viscous yellowish oil (yield% 97) was obtained and kept in the desiccator for 24 h. IR (cm−1): 3299m, 3033w, 2942s, 2841m, 1561s, 1497s, 1230m, 1191s, 1072s, 1031s, 907w, 816s, 778s, 710s, 663s, 464s. 1H NMR (400 MHz, CHCl3): 10.85–10.75 (s, 1H, IM-H), 7.49–7.40 (m, 3H, IM-H), 7.38–7.28 (m, 1H, IM-H), 7.27–7.20 (m, 2H, IM-H), 5.40–5.70 (s, 2H, benzyl-H), 4.26–4.30 (t, J = 7.6 Hz, 2H, alkyl-CH2), 3.41–3.57 (s, 9H, O–CH3), 1.12–1.20 (p, J = 6.8 Hz, 2H, alkyl-CH2), 0.58–0.62 (t, J = 8.0 Hz, 2H, alkyl-CH2). 13C NMR (400 MHz, CHCl3): 138.1, 133.3, 129.6, 129.2, 121.9, 53.6, 52.0, 50.9, 50.7, 24.2, 6.1.
2.4.2 Preparation of Fe3O4 nanoparticles. Fe3O4 magnetic nanoparticles (MNPs) (Fig. 1A) were prepared via the modification of previously reported procedure. 0.5 g of (NH4)2Fe(SO4)2·6H2O and 1 g FeCl3·6H2O were dissolved in 30 mL of deionized water and stirred vigorously for 5 min at 50 °C. Following the drop wise addition of 5 mL of ammonia solution (32%), reaction mixture was further stirred at room temperature for 5 h. The resultant black Fe3O4 nanoparticles were collected by external magnet and washed with excess of deionized water and dried under vacuum at 80 °C for 24 h.
image file: c6ra13702d-f1.tif
Fig. 1 Synthesis of (A) MNP, (B) MNP@CN and (C) MNP@CN/IL.
2.4.3 Synthesis of cyano-functionalized magnetic nanoparticles (MNP@CN). The cyano-group functionalized magnetic nanoparticles (MNP@CN) were prepared as follow, 0.6 g of the freshly prepared Fe3O4 were dispersed in 2-propanol/water solution (5[thin space (1/6-em)]:[thin space (1/6-em)]1) and followed by 15 min sonication at room temperature. Following the addition of 10 mL ammonia solution (25%), 3 mL of cyanopropyltriethoxysilane added rapidly and the reaction mixture was stirred for 24 at room temperature (Fig. 1B). Finally, the resultant slightly darker brown MNP@CN nanoparticles were collected and washed with deionized water and ethanol. The MNP@CN was then dried under vacuum at 80 °C for 20 h.
2.4.4 Preparation of cyano-ionic liquid functionalized magnetic nanoparticles (MNP@CN/IL). MNP@CN/IL were prepared as follow; freshly prepared MNP@CN was suspended in 50 mL toluene, following the 15 min sonication, 2.21 g of BTMP-IM and 4 mL aqueous triethylamine (as catalyst) were added and reaction mixture was stirred at 80 °C for 24 h. Finally, the resultant MNP@CN/IL nanoparticles were collected and washed with deionized water and ethanol. The MNP@CN/IL was then dried under vacuum at 80 °C for 24 h (Fig. 1C).

2.5 MSPE procedure

For CPs MSPE, 30 mg MNP@CN/IL was placed in a vial containing 50 mL of sample solution (0.5 ppm mixed solution) at pH 6, the mixture was mechanically stirred at room temperature for 10 min and then allowed to stand for 5 min under magnetic field separation. After discarding the sample solution, analytes were eluted from MNP@CN/IL with 1000 μL of methanol/acetic acid (1%) and mechanically stirred for 10 min more, this fixation step was repeated twice. The eluent was collected and dried under a stream of nitrogen and then re-dissolved in 500 μL methanol. Finally, the re-dissolved solution was analysed by HPLC.

While, the MSPE procedure for PAHs extraction was same as CPs extraction except; 10 mg adsorbent with 100 mL sample solution (0.1 ppm mixed solution) and twice 2500 μL dichloromethane (DCM) as desorption solvent.

2.6 Real sample pre-treatment

In line to identify the matrix effect of the optimised method, 4 μg L−1 and 100 μg L−1 of CPs and PAHs were spiked separately in the leachate and sludge from landfill site, Jeram, Kuala Selangor. After sample collection the collected leachate was immediately filtered using 110 mm filter paper and stored in the dark at 4 °C. The sludge samples were dried at the room temperature and following the grinding were also stored in the dark at 4 °C in glass bottle. Finally for the sample preparation, 1 g of sludge was weighted and placed in a 50 mL plastic centrifuge tube with 3 mL of methanol as an extraction solvent and was sonicated for 10 min. Following the sonication the suspended sludge was centrifuged at 3500 rpm for 5 min. Then the supernatant filtered through PTFE syringe filter (13 mm, 0.22 μm) and transferred to the volumetric flask and standard analytes were added as well as diluted with ultra-pure water and proceed for magnetic solid phase extraction.

3. Result and discussion

3.1 Characterization

3.1.1 FT-IR analysis. Comparative FT-IR spectral analysis for the confirmation of different functional groups in pure MNP, MNP@CN and newly MNP@CN/IL is represented in Fig. 2A–C. Sharp and strong Fe–O stretching vibration can be seen in MNP at around 640 cm−1 (Fig. 2A), while following the cyano-functionalization and then modification with IL the Fe–O stretching peak intensity is comparatively decreased in case of MNP@CN and MNP@CN/IL (Fig. 2B and C). The bands at 3440 cm−1 and 1648 cm−1 in MNPs are attributed to the O–H stretching and bending vibration of water molecule (physically adsorbed) respectively. The successful functionalization of MNPs with cyanopropyltriethoxysilane can be predicted by the some additional bands in MNP@CN (Fig. 2B) at 2255, 2250 and 1160 cm−1 for C–H, cyano group (C[triple bond, length as m-dash]N) and Si–O stretching respectively. As compared to the MNP@CN, the 1-benzyl-3-(trimethoxysilylpropyl) imidazolium modified magnetic nanocomposites MNP@CN/IL possessed some additional peaks at 3178, 1568, 1527, 1462, 1450 cm−1. Since MNP@CN (Fig. 2B) do not contain any aromatic group stretching, but it can be seen that following the modification process the resultant MNP@CN/IL showed C–H (aromatic) stretching vibration at 3178 cm−1, band at 1568 cm−1 represents the C[double bond, length as m-dash]C of benzyl ring, while C[double bond, length as m-dash]N stretching vibration of imidazolium ring can be predicted by band at 1450 cm−1. In addition the presence of a strong cyano (C[triple bond, length as m-dash]N) group stretching band at 2250 cm−1 also confirmed that incoming BTMP-IM reacts with hydroxyl groups of MNP@CN.
image file: c6ra13702d-f2.tif
Fig. 2 IR spectra of bare MNP (A), MNP@CN (B) and MNP@CN/IL (C).
3.1.2 XRD analysis. The crystalline profile of the MNP, MNP@CN and MNP@CN/IL were analysed using XRD and the X-ray diffraction profiles are shown in Fig. 3A–C, respectively. The characteristic peaks of MNP compliance with the standard Fe3O4 crystal XRD profile (JCPDS card number 19-0629).47 The characteristic peaks at 2θ = 30.25°, 35.74°, 43.44°, 53.65°, 57.37° and 63.01° where attributed to the (220), (311), (400), (422), (511) and (440) reflections, respectively. The same peaks were detected in MNP@CN and MNP@CN/IL which indicates that the magnetic crystalline profile was not changed during the modification process.
image file: c6ra13702d-f3.tif
Fig. 3 XRD profile of bare MNP (A), MNP@CN (B) and MNP@CN/IL (C).
3.1.3 Elemental analysis (EDX) and (CHNS). The elemental composition of the magnetic nanoparticles was studied using EDX analysis as shown in Fig. 4A–C. The EDX results for MNP (Fig. 4A) showed 24.50% & 75.50% of Fe and O respectively. Meanwhile following the modification process the results unambiguously showed the presence of Si, N and C in MNP@CN and MNP@CN/IL.
image file: c6ra13702d-f4.tif
Fig. 4 EDX elemental composition of bare MNP (A), MNP@CN (B) and MNP@CN/IL (C).

In addition, elemental analysis i.e., CHNS results as represented in Table 2 also confirmed the successful coating of BTMP-IM and cyanopropyltriethoxysilane on the surface of MNP. It is clear from the results that MNP@CN contains 4.29% of N and 15.06% of C while MNP@CN/IL contains 5.46% of N and 47.56% of C. The increase in N and C percentage is due to the attachment of BTMP-IM. The small amount of N% in MNP might be due to presence of ammonium in sample from preparation step.

Table 2 Elemental analysis of synthesis adsorbents by CHNS analyser
Sample C (%) H (%) N (%)
MNP@CN/IL 47.56 4.03 5.46
MNP@CN 15.06 3.33 4.29
MNP 0 0.16 0.98


3.1.4 VSM for magnetic properties. Strong magnetization is of great importance for the separation of target analytes through MSPE process. The magnetic behaviour of the MNP, MNP@CN and MNP@CN/IL was investigated by using vibration sample magnetometry (VSM) at room temperature. The hysteresis loops of nanoparticles are illustrated in Fig. 5A–C. The mass saturation magnetization (Ms) for bare MNP, MNP@CN and MNP@CN/IL were found 63.2 emu g−1, 19.8 emu g−1 and 34.6 emu g−1, respectively. Fig. 5B and C shows the value of MS for modified adsorbents (MNP@CN and MNP@CN/IL) was reduced as compared MNP (Fig. 5A). This importance indicates the coating of MNP with cyanopropyltriethoxysilane and IL which apparently causes a reduction in the magnetic strength. Although there was an increase in Ms value of MNP@CN/IL compared to MNP@CN which might be due to heating step through synthesis of MNP@CN/IL that increases the magnetic properties or due to improper washing step of MNP@CN.
image file: c6ra13702d-f5.tif
Fig. 5 Hysteresis loop of bare MNP (A), MNP@CN (B) and MNP@CN/IL (C).
3.1.5 Thermal stability. The thermal stability of the synthesised MNP, MNP@CN and MNP@CN/IL can be accessed from Fig. 6A–C. MNP showed high thermal stability up to 900 °C with the mass loss of about 3% (Fig. 6A). In the case of MNP@CN (Fig. 6B) and MNP@CN/IL (Fig. 6C), approximately 1.7% weight loss below 250 °C is due to loss of physically adsorbed organic volatiles and water molecules. The 32.4% weight loss for MNP@CN (6C) between 250 °C and 900 °C is most probably due to the combustion of cyanopropyltriethoxysilane. In case of MNP@CN/IL (6C), the 24% weight loss between 240 and 630 °C corresponds to the thermal carbonization and the decomposition of organic groups such as IL combustion. Only 24.0%, weight loss for MNP@CN/IL between 250 °C and 900 °C indicates that synthesized magnetic nanoparticles are highly thermally stable (Fig. 6C).
image file: c6ra13702d-f6.tif
Fig. 6 TGA curves of bare MNP (A), MNP@CN (B) and MNP@CN/IL (C).
3.1.6 TEM. The TEM images of the MNP, MNP@CN and MNP@CN/IL are demonstrated in Fig. 7A–C. The TEM image of MNP confirmed a spherical agglomerate morphology with average diameter of the bare particles around 11.90 nm. As it can be seen in Fig. 7B, the average diameter of nanoparticles slightly increased to 14.90 nm with spherical agglomerate morphology after the modification of MNP using cyanopropyltriethoxysilane. Further coating on the surface of MNP@CN with IL produced nanoparticles with spherical morphology and well dispersed with average diameter of 16.60 nm as shown in Fig. 7A.
image file: c6ra13702d-f7.tif
Fig. 7 TEM image of bare MNP (A), MNP@CN (B) and MNP@CN/IL (C).

3.2 MSPE optimization study

3.2.1 Elution solvent. Elution solvent is an important parameter in extraction methods, since it directly affect the sensitivity and efficiency.10 The effect of desorption solvent on the MSPE performance has been investigated using methanol, methanol containing 1% acetic acid and acetonitrile. As it is obvious from the desorption results (Fig. 8A) of CPs from the MNP@CN/IL that addition of 1% (as ratio with methanol) acetic acid to methanol increased the desorption ability toward CPs. This might be due to the high competition of acetic acid with CPs to form hydrogen bonds with cyano group on the surface of MNP@CN/IL. In order to obtain a high enrichment factor the elution solvent volume (250 to 1500 μL of methanol/1% acetic acid) was investigated (Fig. 8B). By increasing the volume (250 to 1500 μL), the enrichment factor/peak area ratio was increased slightly and it attained a maximum at 250 μL of elution solvent volume. Beyond the 250 μL of elution solvent volume there is no significant change in the peak area was observed, consequently 250 μL was chosen as the optimized elution solvent volume for further analysis. The effect of elution solvent in case of PAHs has been examined by using DCM, acetonitrile, n-hexane and ethylacetate as eluting solvents. Obtained results (Fig. 8C), indicated that DCM is the best eluting solvent and satisfactory results for all the selected FLO, FLU, PYR, CRY and BaP were achieved by using DCM. The high peak area/desorption of PAHs in DCM might be due to hydrophobic nature of both i.e., selected analytes (PAHs) and solvent (DCM) which increase the hydrophobic interaction. Consequently, DCM was assumed to be the most suitable eluting solvent for subsequent experiments. The influence eluting solvent volume was tested in the range of 750 to 3000 μL of DCM, Fig. 8D. The extraction efficiency improves slightly with the increase of the eluent volume from 750 to 2500 μL; but when eluent volume increased more, extraction efficiency decreased. Satisfactory, extraction efficiency of PAHs were obtained by using the 2500 μL of DCM.
image file: c6ra13702d-f8.tif
Fig. 8 MSPE method development study: (A) elution solvent CPs, (B) elution solvent volume (μL) CPs, (C) elution solvent PAHs, (D) elution solvent volume (μL) PAHs.
3.2.2 Extraction time. The extraction time is also a key parameter for the effective MSPE. To optimize the influence of extraction time for the adsorption of CPs and PAHs onto MNP@CN/IL trials ranging from 1 to 30 min were conducted. The recovery of selected CPs and PAHs rapidly increased during the first 10 min and there is no significant effect beyond the 10 min extraction time. Since, highest peak area ratio was observed at 10 min of extraction time. Consequently, it was assumed that the 10 min of contact time is enough for the isolation of targeted analytes (CPs and PAHs) by using newly MNP@CN/IL. Thus 10 min of extraction time is operated for the subsequent experiments.
3.2.3 pH. pH is also one of the crucial parameters and play an essential role during the adsorption process. Because it affects both the aqueous chemistry as well as the dissociation of functional groups on the active sites of the adsorbent.48 Consequently, effect of pH on the adsorption of selected CPs and PAHs onto newly MNP@CN/IL was scrutinized at different pHs (i.e., 2, 4, 6, 8 and 10). It can be seen that (Fig. 9A) the peak area of the selected CPs in acidic condition (pH = 2–6) was high as compared to basic media (pH = 8–10). The high peak area for CPs at pH 2–6 can be explained on the basis of pKa values that are in the range 9.12 to 5.62. While in case of PAHs (Fig. 9B), the extraction efficiency of PAHs increased by increasing the pH from 2 to 6 and maximum extraction (peak area) was achieved at slightly acidic pH (pH = 6). At basic pH, decrease in extraction efficiency of CPs might be due to the repulsion between negative charged surface of adsorbent and selected CPs. Because, at higher pH (pH 8 & 10), both MNP@CN/IL and CPs becomes deprotonated (anionic form) and there may be strong repulsive forces between the anionic sites of both i.e., adsorbent as well as targeted analytes.
image file: c6ra13702d-f9.tif
Fig. 9 Effect of pH: CPs (A) and PAHs (B).

In contrast, the low recoveries for all PAHs were observed when pH is in slightly acidic and basic medium. This phenomena may be explained from the change of charge species and density on the surface of adsorbent (MNP@CN/IL). At acidic condition, there is huge amount of protons available due to protonation of remaining hydroxyl groups from MNPs surface and may saturate the sorbent sites making the surface of the sorbent more cationic. While at basic condition the deprotonation of remaining hydroxyl groups from MNPs making the surface of the adsorbent more anionic. These changes reduce the hydrophobicity of MNP@CN/IL which effects the hydrophobic interaction between PAHs and MNP@CN/IL. Thus, pH 6 was selected for further experiment.

3.2.4 Sample volume. In order to obtain a quantitative extraction recovery of CPs and PAHs the sample volume was investigated in the range of 15 to 150 mL. By increasing the volume (5–50 mL), the extraction recoveries for selected CPs increased and peak area ratio attained a maximum at 50 mL of sample volume. The peak area improved by increasing the sample volume up to 50 mL for the selected CPs and beyond the 50 mL additional of the solution volume did not further affect the extraction efficiency. While in case of PAHs the 100 mL of sample volume showed highest peak area for all the selected PAHs. Consequently, for the significant extraction of PAHs 100 mL of sample volume were optimized and used for subsequent experiments.
3.2.5 Sorbent mass. The weight of the adsorbent is another important factor for determining the quantitative recovery of a target analyte. For this reason, the weight of MNP@CN/IL was optimized within the range of 5–40 mg for both selected CPs and PAHs. Based on the results as shown in Fig. 10A, quantitative recoveries/peak area of selected CPs were obtained using 30 mg of new (MNP@CN/IL) magnetic adsorbent; above 30 mg of adsorbent, the weight recovery/peak area remained nearly constant. In case of PAHs the acquired results (Fig. 10B) showed that the peak area for all the selected PAHs increased dramatically by increasing the adsorbent dosage from 5 to 10 mg and there is no further improvement in peak area beyond 10 mg of dosage. Therefore, 30 & 10 mg of adsorbent dosage was selected for the effective adsorption of CPs and PAHs respectively in subsequent experiments.
image file: c6ra13702d-f10.tif
Fig. 10 Effect of sorbent mass (mg): CPs (A) and PAHs (B).

3.3 Method validation

The analytical performance of the proposed magnetic solid phase extraction MSPE method based on MNP@CN/IL was validated using different analytical parameters such as linearity, limit of detection (LOD), limit of quantification (LOQ) and precision (RSD%) and results are summarized in Table 3. MSPE was carried out using the optimum extraction conditions. Each concentration was triplicate and the mean value of peak area was taken for calibration curve at optimum condition (30 mg adsorbent, 50 mL sample, 10 min extraction time, 1000 methanol/acetic acid (1%) as desorption solvent and pH 6 for CPs) and (10 mg adsorbent, 100 mL sample, 10 min extraction time, twice 2500 DCM as desorption solvent and pH 6 for PAHs). The linearity was studied at seven concentration levels in the range of (3–100 μg L−1 for CPs) and (0.1–100 μg L−1 for PAHs) with coefficient determination (r2) >0.99. The LOD and the LOQ for MSPE extraction using MNP@CN/IL adsorbent for CPs (0.35–0.67; 1.16–2.25 μg L−1) and for PAHs (0.4–0.59; 1.35–1.98 μg L−1) were lower in comparison with MNP, MNP@CN and MNP@IL. The precision of optimum method was obtained using 5 replicate for intra-day and 3 replicate during 3 days for inter-day at the concentration of 50 μg L−1 of CPs mixture solution and 10 μg L−1 of PAHs. The extraction performance of MNP@CN/IL with the mean value of peak area indicated highest extraction efficiency in contrast with the median adsorbents i.e., MNP, MNP@CN and MNP@IL (Fig. 11). Obtained results (Table 3) demonstrate the proposed method to be precise with % RSD > 4.5 for both CPs and PAHs batch which indicates good repeatability of MNP@CN/IL. The lowest value of LOD and LOQ and highest extraction efficiency of MNP@CN/IL compare to median adsorbents justifies the increased sensitivity, affinity and capacity of adsorbent towards the CPs and PAHs by formation of a strong π–π interaction between the imidazolium/benzyl rings of IL with aromatic moieties of CPs and PAHs as well as hydrogen bonding between chlorine/hydroxyl groups of CPs with cyano group. Also, the proposed method provided high enrichment factors of 100 for CPs and 200 for PAHs.
Table 3 Analytical figures of merits of MNP@CN/IL, MNP@CN, MNP@IL and MNP in MSPE: repeatability (% RSDs), LOD (μg L−1) and LOQ (μg L−1) of CPs and PAHsa
Analyte MNP MNP@CN MNP@IL MNP@CN/IL
RSDs LOD LOQ RSDs LOD LOQ RSDs LOD LOQ r2 RSDs LOD LOQ
Intra (n = 5) Inter (n = 3)
a Linearity ranges: for all adsorbents in CPs study was between 3 and 100 μg L−1, in PAHs study: (0.1–100 μg L−1).
2CP 2.07 8.86 29.53 4.00 8.14 27.15 4.72 9.17 30.56 0.9942 4.46 1.70 0.44 1.47
3CP 3.51 9.22 30.73 4.74 3.24 10.81 2.23 6.6 21.97 0.9941 2.24 2.17 0.67 2.25
2,4DCP 3.87 6.71 22.38 3.96 2.75 9.18 2.61 2.67 8.91 0.9904 2.63 0.60 0.35 1.16
2,4,6TCP 3.73 7.04 23.48 4.64 2.9 9.68 3.64 2.71 9.05 0.9938 3.05 0.31 0.45 1.5
2,3,4,6TTCP 3.98 8.75 29.18 4.88 2.67 8.9 2.38 2.47 8.24 0.9951 2.22 1.01 0.46 1.54
FLO 3.56 8.2 27.33 4.91 1.09 3.64 3.22 0.87 2.9 0.9912 1.71 0.73 0.59 1.98
FLU 3.01 4.14 13.8 5.07 1.31 4.36 3.09 0.86 2.88 0.9956 2.49 1.33 0.43 1.42
PYR 4.59 3.12 10.39 5.00 1.31 4.36 2.21 1.66 5.54 0.9967 1.81 1.17 0.48 1.61
CRY 4.01 5.13 17.09 4.14 1.03 3.43 4.68 1.95 6.52 0.9923 0.84 0.46 0.40 1.35
BaP 2.63 7.77 25.89 3.75 0.68 2.27 4.39 1.17 3.91 0.9907 0.58 0.65 0.40 1.35


image file: c6ra13702d-f11.tif
Fig. 11 Comparison of the performance of MNP@CN/IL with MNP, MNP@CN and MNP@IL for the MSPE of CPs (A) and PAHs (B).

3.4 Real samples

In order to assess the field application of the proposed MSPE method, selected CPs and PAHs were isolated from environmental samples i.e., leachate and sludge from landfill site at concentration of 100 μg L−1 and 4 μg L−1. Table 4 shows that the percent recovery for CPs for leachate and sludge were satisfactory between 80.67–111.8% and 103.5–112.7% and their repeatability were in the range of 1.26–4.89% and 0.92–4.51%, respectively. While, the percent recovery of PAHs in leachate was in the range of 89.50–110.2% with RSDs 1.35–4.49% and in sludge were in the range of 93.80–107.5% with RSDs 1.16–4.12%. The typical chromatogram of blank analysis and spiked leachate and sludge are illustrated in Fig. 12.
Table 4 The recovery and % RSDs (n = 5) of CPs and PAHs in the environmental samples (leachate and sludge) with a spiked concentration of 100 and 4 μg L−1
Analyte Leachate Sludge
Recovery (RSDs)% 100 μg L−1 Recovery (RSDs)% 4 μg L−1 Recovery (RSDs)% 100 μg L−1 Recovery (RSDs)% 4 μg L−1
2-CP 80.67 (4.69) 80.62 (3.90) 104.4 (2.58) 105.5 (2.59)
3-CP 111.8 (3.43) 111.5 (4.65) 112.6 (3.24) 108.1 (3.67)
2,4-DCP 90.75 (3.16) 106.0 (4.89) 109.0 (0.92) 110.6 (2.16)
2,4,6-TCP 94.75 (1.80) 100.8 (1.43) 112.7 (2.09) 112.5 (2.50)
2,3,4,6-TTCP 106.4 (2.26) 99.37 (1.26) 106.8 (4.51) 103.5 (3.24)
FLO 107.8 (2.30) 107.0 (4.49) 99.33 (1.16) 100.8 (2.86)
FLU 99.20 (3.37) 89.50 (3.64) 105.5 (3.98) 105 (4.12)
PYR 110.2 (1.35) 108.0 (4.43) 93.80 (2.77) 107.5 (2.32)
CRY 107.0 (2.28) 92.50 (2.70) 102.6 (1.49) 102.5 (2.43)
BaP 102.3 (1.49) 94.00 (2.85) 104.3 (1.99) 104.2 (3.66)


image file: c6ra13702d-f12.tif
Fig. 12 Chromatograms of leachate using MNP@CN/IL as the MSPE adsorbent spiked with CPs of 4 μg L−1 (A), unspiked sludge (A′), spiked with PAHs of 4 μg L−1 (B) and unspiked leachate (B′).

3.5 Comparison with other study

The newly proposed magnetic solid phase extraction MSPE method based on MNP@CN/IL was compared with the previously reported adsorbents for the extraction/determination of CPs and PAHs from aqueous environment. The results revealed that the newly proposed MSPE method based on MNP@CN/IL a rapid, reliable and highly efficient method for the preconcentration/extraction of CPs and PAHs from water sample with low LOD and RSD values with good percent recoveries as compared to the many reported materials (Table 5).
Table 5 The comparison performance data of proposed MSPE method using MNP@CN/IL with other methods for extraction of CPs and PAHs in water samples
Sample Technique/adsorbent Adsorbent mass (mg) Recovery% RSDs% LOD (μg L−1) Ref.
CPs MSPE-HPLC-UV/CTAB-MNP 60 83–98 <5.9 0.11–0.15 49
CPs MSPE-HPLC-UV/CZNC 93–102 <10.2 0.1–2 9
CPs MSPE-HPLC-UV/MNP-IL 100 70.3–88.8 <6.0 0.2–0.35 50
CPs MSPE-HPLC-DAD/MNP@CN/IL 30 80.67–112.7 <4.89 0.35–0.67 This study
PAHs MSPE-HPLC-UV/Fe3O4@AuNPs 100 63.8–110.7 <5.4 0.26–0.52 51
PAHs HPLC-FLD/MNP-C18 50 35–99 <10 0.8–36 52
PAHs GC-MS/Fe3O4-IL 75–102 <8.9 0.04–1.11 53
PAHs MSPE-HPLC-DAD/MNP@CN/IL 10 89.50–110.2 <4.49 0.40–0.59 This study


4. Conclusion

In this study, new cyano-ionic liquid functionalized magnetic nanoparticles were successfully used as a new adsorbent in solid phase extraction for the simple, fast and efficient preconcentration of trace CPs and PAHs from environmental samples. The MSPE parameters affecting the extraction/preconcentration of CPs and PAHs were optimized and the results showed that the proposed MSPE method has acceptable percent recovery and repeatability for CPs and PAHs in environmental samples. Therefore, it was concluded that the presences of cyano group of cyanopropylsiloxanes and benzyl group of IL in new magnetic solid-phase extractor (MNP@CN/IL), significantly contributed and increased the adsorption capability for CPs and PAHs.

Acknowledgements

I would like to acknowledge the valuable support from University of Malaya for the Research Grants (Project No. PG027-2013A and RP011B-14SUS) provided.

References

  1. H. R. Nodeh, W. A. W. Ibrahim, M. A. Kamboh and M. M. Sanagi, RSC Adv., 2015, 5, 76424–76434 RSC.
  2. M. A. Kamboh, W. A. W. Ibrahim, H. R. Nodeh, M. M. Sanagi and S. T. H. Sherazi, New J. Chem., 2016, 3130–3138 RSC.
  3. W. A. Wan Ibrahim, H. R. Nodeh, H. Y. Aboul-Enein and M. M. Sanagi, Crit. Rev. Anal. Chem., 2015, 45, 270–287 CrossRef CAS PubMed.
  4. M. A. Kamboh, I. B. Solangi, S. Sherazi and S. Memon, Desalination, 2011, 268, 83–89 CrossRef CAS.
  5. Y. Kadmi, L. Favier, T. Yehya, I. Soutrel, A. I. Simion, C. Vial and D. Wolbert, Arabian J. Chem., 2015 DOI:10.1016/j.arabjc.2015.06.005.
  6. J. Feng, M. Liu, S. Liu, X. Li and J. Sun, Polycyclic Aromat. Compd., 2015, 1–12 CrossRef.
  7. K. G. Taylor and P. N. Owens, J. Soils Sediments, 2009, 9, 281–303 CrossRef.
  8. S. Lundstedt, P. A. White, C. L. Lemieux, K. D. Lynes, I. B. Lambert, L. Öberg, P. Haglund and M. Tysklind, Ambio, 2007, 36, 475–485 CrossRef CAS PubMed.
  9. R. Alizadeh, Talanta, 2016, 146, 831–838 CrossRef CAS PubMed.
  10. W. A. W. Ibrahim, K. V. Veloo and M. M. Sanagi, J. Chromatogr. A, 2012, 1229, 55–62 CrossRef PubMed.
  11. B. Akbari-adergani, S. Eskandari, A. Hashemi and M. Shekarchi, J. Chem. Health Risks, 2016, 6, 21–31 Search PubMed.
  12. Z. Yarahmadi, A. A. Movahedinia, S. Rastgar and R. A. Ardeshir, Int. J. Toxicol., 2016, 10, 45–49 Search PubMed.
  13. S. Aeenehvand, Z. Toudehrousta, M. Kamankesh, M. Mashayekh, H. R. Tavakoli and A. Mohammadi, Food Chem., 2016, 190, 429–435 CrossRef CAS PubMed.
  14. M. Hoseini, M. Yunesian, R. Nabizadeh, K. Yaghmaeian, R. Ahmadkhaniha, N. Rastkari, S. Parmy, S. Faridi, A. Rafiee and K. Naddafi, Environ. Sci. Pollut. Res., 2016, 23, 1820–1832 CrossRef CAS PubMed.
  15. G. Iwuoha, O. Orubite and I. Okite, J. Appl. Sci. Environ. Manage., 2016, 19, 761–764 Search PubMed.
  16. M. A. Ghadikolaei, Renewable Sustainable Energy Rev., 2016, 57, 1440–1495 CrossRef CAS.
  17. L. Yang, B. Chen, S. Luo, J. Li, R. Liu and Q. Cai, Environ. Sci. Technol., 2010, 44, 7884–7889 CrossRef CAS PubMed.
  18. K. W. S. Al-Janabi, F. N. Alazawi, M. I. Mohammed, A. A. H. Kadhum and A. B. Mohamad, Bull. Environ. Contam. Toxicol., 2011, 87, 106–112 CrossRef CAS PubMed.
  19. G. Fang, J. Chen, J. Wang, J. He and S. Wang, J. Chromatogr. A, 2010, 1217, 1567–1574 CrossRef CAS PubMed.
  20. S. Bakhshaei, A. Kamboh, S. Mohamad, S. M. Zain and A. Maamor, RSC Adv., 2016, 6, 49358–49369 RSC.
  21. R. Mirzajani and F. Kardani, J. Pharm. Biomed. Anal., 2016, 98–109 CrossRef CAS PubMed.
  22. A. A. Pebdani, S. Dadfarnia, A. M. H. Shabani and S. Khodadoust, J. Chromatogr. A, 2016, 1437, 15–24 CrossRef CAS PubMed.
  23. M. Sajid and C. Basheer, Trends Anal. Chem., 2016, 75, 174–182 CrossRef CAS.
  24. E. Dezfoolinezhad, K. Ghodrati and R. Badri, New J. Chem., 2016, 40, 4573–4587 RSC.
  25. A. Mollahosseini, M. Toghroli and M. Kamankesh, J. Sep. Sci., 2015, 38, 3750–3757 CrossRef CAS PubMed.
  26. M. Amjadi, A. Samadi and J. L. Manzoori, Microchim. Acta, 2015, 1–7 Search PubMed.
  27. N. Azizi, P. Kamrani and M. Saadat, Appl. Organomet. Chem., 2016, 30, 431–434 CrossRef CAS.
  28. M. A. Zolfigol, R. Ayazi-Nasrabadi and S. Baghery, Appl. Organomet. Chem., 2016, 30, 273–281 CrossRef CAS.
  29. J. Yang, J.-y. Li, J.-q. Qiao, H.-z. Lian and H.-y. Chen, J. Chromatogr. A, 2014, 1325, 8–15 CrossRef CAS PubMed.
  30. A. Ghorbani-Choghamarani and M. Norouzi, J. Magn. Magn. Mater., 2016, 401, 832–840 CrossRef CAS.
  31. Q. Cheng, F. Qu, N. B. Li and H. Q. Luo, Anal. Chim. Acta, 2012, 715, 113–119 CrossRef CAS PubMed.
  32. S. Zhang, H. Niu, Z. Hu, Y. Cai and Y. Shi, J. Chromatogr. A, 2010, 1217, 4757–4764 CrossRef CAS PubMed.
  33. J. Rashid, M. Barakat, Y. Ruzmanova and A. Chianese, Environ. Sci. Pollut. Res., 2015, 22, 3149–3157 CrossRef CAS PubMed.
  34. L. Hao, X.-L. Liu, J.-T. Wang, C. Wang, Q.-H. Wu and Z. Wang, Chin. Chem. Lett., 2016, 27, 783–788 CrossRef CAS.
  35. Y. Huang, Y. Wang, Y. Wang, Q. Pan, X. Ding, K. Xu, N. Li and Q. Wen, RSC Adv., 2016, 6, 5718–5728 RSC.
  36. A. A. Asgharinezhad and H. Ebrahimzadeh, Anal. Bioanal. Chem., 2016, 408, 473–486 CrossRef CAS PubMed.
  37. Q. Zhang, F. Yang, F. Tang, K. Zeng, K. Wu, Q. Cai and S. Yao, Analyst, 2010, 135, 2426–2433 RSC.
  38. S. Kulkarni, L. Fang, K. Alhooshani and A. Malik, J. Chromatogr. A, 2006, 1124, 205–216 CrossRef CAS PubMed.
  39. M. Miskam, N. Bakar and S. Mohamad, J. Sol-Gel Sci. Technol., 2013, 67, 121–129 CrossRef CAS.
  40. W. Wan Ibrahim, A. Abdul Keyon, N. Prastomo and A. Matsuda, J. Sol-Gel Sci. Technol., 2011, 59, 128–134 CrossRef.
  41. Y. Fan, Y. Li, X. Dong, G. Hu, S. Hua, J. Miao and D. Zhou, Ind. Eng. Chem. Res., 2014, 53, 20024–20031 CrossRef CAS.
  42. J. D. Holbrey, W. M. Reichert, M. Nieuwenhuyzen, O. Sheppard, C. Hardacre and R. D. Rogers, Chem. Commun., 2003, 4, 476–477 RSC.
  43. Z. Bo, H.-L. Zhang, T. Wei, Y. Wei-Guan, F. Xiong, J. Lin-Hai and Q. Da-Bin, Struct. Chem., 2014, 33(3), 415–421 Search PubMed.
  44. C. R. Martinez and B. L. Iverson, Chem. Sci., 2012, 3, 2191–2201 RSC.
  45. D. Han and K. H. Row, Molecules, 2010, 15, 2405–2426 CrossRef CAS PubMed.
  46. F. Galán-Cano, M. del Carmen Alcudia-León, R. Lucena, S. Cárdenas and M. Valcárcel, J. Chromatogr. A, 2013, 1300, 134–140 CrossRef PubMed.
  47. Y. Lu, W. Yang and M. Yin, Mater. Lett., 2014, 125, 4–7 CrossRef CAS.
  48. M. Moeder, Phenols analysis in environmental samples, Meyers, R.A., 2000 Search PubMed.
  49. J. Li, X. Zhao, Y. Shi, Y. Cai, S. Mou and G. Jiang, J. Chromatogr. A, 2008, 1180, 24–31 CrossRef CAS PubMed.
  50. F. Yang, R. Shen, Y. Long, X. Sun, F. Tang, Q. Cai and S. Yao, Environ. Sci.: Processes Impacts, 2011, 13, 440–445 RSC.
  51. Y. Li, L. Qi, Y. Shen and H. Ma, Anal. Chim. Acta, 2014, 811, 36–42 CrossRef CAS PubMed.
  52. Y. Liu, H. Li and J.-M. Lin, Talanta, 2009, 77, 1037–1042 CrossRef CAS PubMed.
  53. F. Galan-Cano, M. del Carmen Alcudia-Leon, R. Lucena, S. Cardenas and M. Valcarcel, J. Chromatogr. A, 2013, 1300, 134–140 CrossRef CAS PubMed.

This journal is © The Royal Society of Chemistry 2016